
Market
Yellow Card Aims to Replace SWIFT with Stablecoins in 5 Years

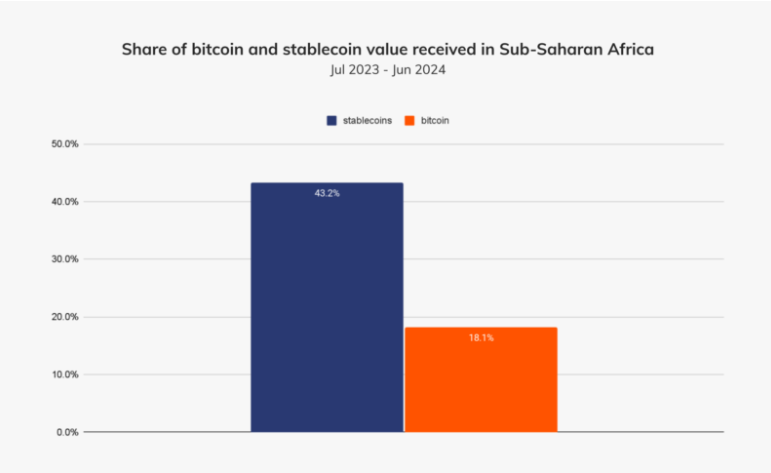
For years, crypto in Africa was synonymous with Bitcoin (BTC). Today, that narrative has flipped, with companies like Yellow Card, a crypto exchange operating in Africa, clearly reflecting this shift.
In an exclusive with BeInCrypto, Yellow Card co-founder and CEO Chris Maurice reveals how it is building a pan-African stablecoin network to leapfrog traditional finance (TradFi). This is amid growing regulatory clarity, collapsing fiat systems, and a remittance revolution.
Stablecoins Are Transforming Africa’s Financial Scene
The pan-African exchange operates in over 20 markets, and Maurice says stablecoins now account for over 99% of its transactions. This makes Yellow Card a bellwether for what might be the most transformative trend in emerging markets finance.
“When we first launched Yellow Card in 2019, people were exclusively buying Bitcoin. Now, the most popular asset is Tether (USDT),” Maurice told BeInCrypto.
As it happened, necessity, not speculation, has driven this evolution. Africa leads the world in peer-to-peer (P2P) crypto trading volume. However, unlike global crypto hubs chasing volatile returns, Africans are choosing stablecoins out of financial survival.
Local currencies are eroding under inflationary pressure in countries like Nigeria, which ranks second globally in crypto adoption (per Chainalysis). Stablecoins offer a reliable store of value and seamless means of cross-border payments.
This is especially critical in a continent with $48 billion annual remittances and persistent banking limitations.
“Stablecoins are solving practical financial services challenges in Africa. People aren’t in love with the tech. They need faster, cheaper ways to move money to survive and thrive,” Maurice added.
Infrastructure Built for the Unbanked
Yellow Card has gone beyond trading services. Its infrastructure integrates mobile money systems (like M-Pesa in Kenya) and local fiat currencies such as the Nigerian naira and Ghanaian cedi. According to the firm’s CEO, this helps onboard users without bank accounts.
By managing compliance, currency exchange, and payments internally, the firm enables businesses to operate without battling unreliable local rails.
“Our mission is to let companies invest, hire, and grow in emerging markets without needing to stress over infrastructure. We’ve built the back office [meaning] cybersecurity, AML, [and] data protection, so they can focus on growth,” he articulated.
The Regulatory Dam Has Broken
Maurice also observed that African regulators kept crypto in limbo for years. In Yellow Card’s view, 2024 marked a tipping point.
“There is regulatory momentum in Africa that is only accelerating. The dam has broken,” he said.
South Africa now classifies crypto as a financial product. It has licensed major exchanges like Luno and VALR. Countries in the Central African Economic and Monetary Community (CEMAC), Mauritius, Botswana, and Namibia have followed suit with licensing regimes.
Meanwhile, regulatory incubators are emerging in Kenya, Nigeria, Rwanda, and Tanzania. Against this backdrop, Maurice says Yellow Card has actively helped draft legislation in Kenya and supports crypto frameworks in Morocco.
Fighting the Informal Market
Still, challenges remain. In countries like Ethiopia, Cameroon, and Morocco, outright bans have driven users underground into high-risk P2P networks. Yellow Card pushes for frameworks that level the playing field for compliant players.
“We face a lot of competition from companies that don’t maintain high AML standards…A level playing field is all we seek,” he said.
With $85 million in venture funding, Yellow Card is deploying capital into compliance and partnerships. With this, the company positions itself as the go-to infrastructure provider for global firms looking to tap African markets.
From Africa to Emerging Markets Everywhere
Cross-border payments are perhaps Yellow Card’s most powerful use case. The company’s co-founder says its stablecoin-powered rails are helping businesses reduce working capital needs, expand to new regions, and hire faster.
“We’ve had clients tell us we’ve enabled them to scale into new countries and reduce their costs dramatically. That’s real economic impact,” said Maurice.
The company is not stopping at Africa. Its infrastructure extends into other frontier markets, with a wave of strategic partnerships expected in 2025.
“Yellow Card has built a series of easy buttons for developed world companies to expand into complicated, high-growth markets,” he noted.
The End of SWIFT?
Perhaps the boldest claim from Yellow Card is what it sees on the five-year horizon: the decline of SWIFT and traditional international transfers altogether.
“As we look out five years, SWIFT is in trouble. In ten, no one will be making international wires again,” Maurice chimed.
Backed by enterprise-grade security and regulatory rigor, Yellow Card attracts interest from blue-chip firms like PayPal and Coinbase exchange, which are looking for stablecoin partners in emerging markets.
“Stablecoins are already a standard part of the financial infrastructure in Africa. CFOs and treasurers in traditional industries are now routinely using them to store and transfer value,” he added.
Africa’s crypto market is still small compared to global giants. Nevertheless, as the world shifts from speculation to utility, the continent’s fragmented financial systems may offer a glimpse into crypto’s most impactful use case: economic empowerment. For Yellow Card, the mission is clear and increasingly urgent.
“We’ve built a company for longevity and scale. Crypto adoption in Africa is stablecoin adoption,” Maurice concluded.
Disclaimer
In adherence to the Trust Project guidelines, BeInCrypto is committed to unbiased, transparent reporting. This news article aims to provide accurate, timely information. However, readers are advised to verify facts independently and consult with a professional before making any decisions based on this content. Please note that our Terms and Conditions, Privacy Policy, and Disclaimers have been updated.


Solana (SOL) has climbed 13% over the past seven days, showcasing strong short-term performance. While momentum indicators like the RSI and EMA lines remain supportive, recent price action suggests that bullish strength may be stalling just below a key breakout point.
At the same time, the sharp drop in BBTrend indicates weakening trend strength and fading volatility, often a sign of incoming consolidation or market indecision. With technicals at a crossroads, SOL’s next move will likely depend on whether buyers can regain control or if a broader pullback begins to unfold.
SOL RSI Rises Sharply, but Pause in Momentum Signals Caution
Solana’s Relative Strength Index (RSI) is currently at 60.35, marking a noticeable rise from 45 just two days ago.
This jump signals growing bullish momentum, although the RSI has remained stable since yesterday, suggesting that upward pressure may be easing for now.
The increase reflects renewed buying interest in recent sessions, pushing SOL closer to overbought territory but not quite there yet. This leveling off could indicate that the market is taking a breather before deciding its next move.
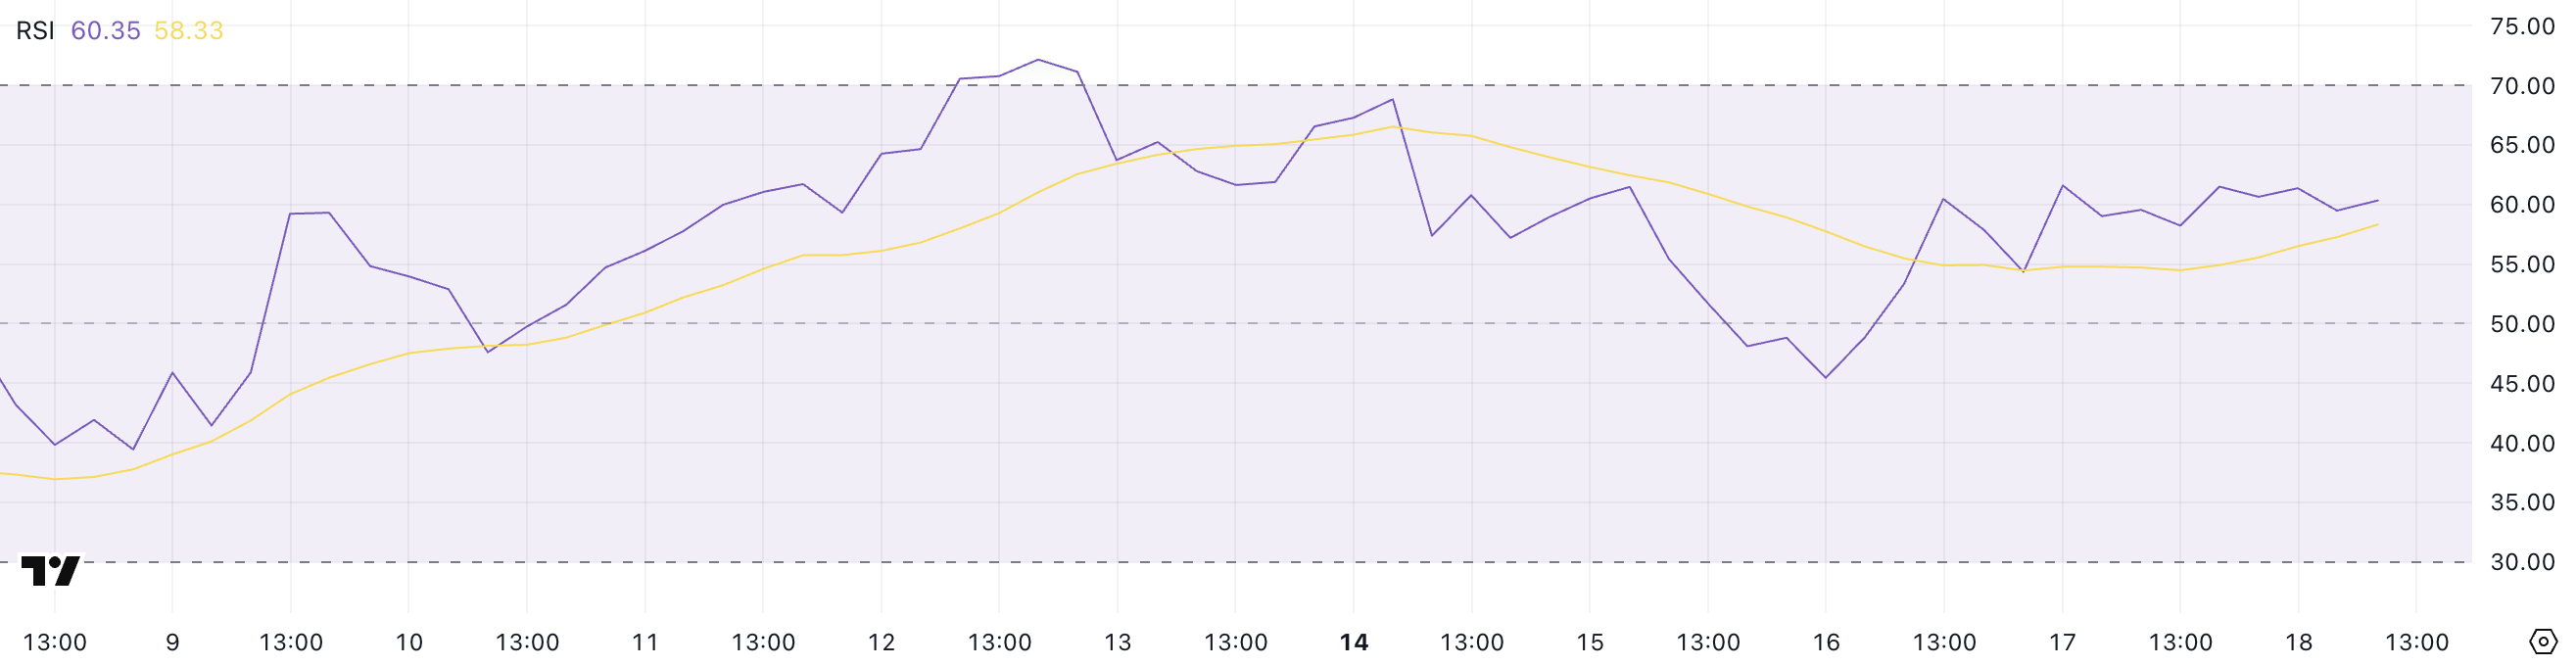
The RSI is a momentum oscillator that measures the speed and magnitude of price movements, ranging from 0 to 100. Values above 70 typically indicate that an asset is overbought and may be due for a pullback, while readings below 30 suggest oversold conditions, potentially signaling a buying opportunity.
With Solana’s RSI at 60.35, the asset is approaching bullish territory but hasn’t yet entered an extreme zone.
This positioning suggests that while recent momentum is positive, SOL could face some short-term consolidation or resistance before continuing higher—unless strong buying interest resumes and pushes the RSI closer to overbought levels.
SOL Trend Strength Weakens as BBTrend Falls Below 6
Solana’s BBTrend indicator is currently at 5.69, a significant drop from the 17.5 reading observed just four days ago.
This sharp decline suggests that volatility around SOL’s price has cooled notably, and the strength of the prior trend is weakening.
While BBTrend doesn’t signal direction on its own, the drop indicates that the strong movement, likely bullish, has lost momentum, and SOL may be entering a phase of consolidation or uncertainty.

BBTrend, short for Bollinger Band Trend, measures the strength of a price trend based on the expansion or contraction of Bollinger Bands.
Higher values suggest a strong, directional move (either up or down), while lower values point to weaker trends and reduced volatility. With BBTrend now at 5.69, Solana is in a much less volatile environment, which often precedes a breakout or a reversal.
For now, this reading signals that the recent momentum is fading. Unless volatility picks up again, SOL’s price may remain range-bound in the short term.
Golden Cross Looms for SOL, But $136 Barrier Still Holding Strong
Solana’s EMA lines continue to reflect a bullish structure, with the short-term average trending above the long-term one—suggesting that positive momentum remains intact.
A potential golden cross is also forming, which, if confirmed, would further reinforce the bullish outlook.
However, despite this favorable setup, Solana price has struggled to break through the $136 resistance level over the past few days, indicating that buyers may be losing steam at this key threshold.
Tracy Jin, COO of MEXC told BeInCrypto:
“Amid widespread volatility, Solana has stood out with notable strength. A combination of favorable technical setups and institutional tailwinds — such as the launch of the first spot Solana ETFs in North America — has helped drive a short-term rally. The token’s reclaim of leadership in decentralized exchange activity and rising total value locked further support the bullish case.”

If SOL manages to push above $136 with strong volume, it could open the path toward the next targets at $147 and potentially higher. But if the current momentum fades and the price reverses, a test of support at $124 becomes likely.
About Solana next moves, Jin told BeInCrypto:
“Despite recent gains, SOL’s near-term outlook remains sensitive to broader liquidity conditions. Any deterioration in market confidence — whether from macro shocks or renewed volatility in Bitcoin — could cap upside potential.”
A breakdown below that could accelerate losses toward $112, and in the event of a deeper correction, SOL could even revisit the $95 region.
Disclaimer
In line with the Trust Project guidelines, this price analysis article is for informational purposes only and should not be considered financial or investment advice. BeInCrypto is committed to accurate, unbiased reporting, but market conditions are subject to change without notice. Always conduct your own research and consult with a professional before making any financial decisions. Please note that our Terms and Conditions, Privacy Policy, and Disclaimers have been updated.

Pi Network released its Mainnet Migration Roadmap today. The roadmap lays out a three‑phase plan to move tens of millions of Pioneers who are still waiting to be moved to the open network. It also introduces new rewards, such as referral bonuses.
However, unlike most project roadmaps, Pi network didn’t provide any estimated date or timeline. This lack of clarification has frustrated early adopters who still await key rewards and clarity on rollout pacing.
Pi Network’s Three‑Phase Migration Plan
According to the roadmap, Pi Network will first complete initial migrations for Pioneers already in the queue. This batch covers verified base mining rewards, Security Circle contributions, lockup commitments, utility‑app usage rewards, and confirmed Node rewards for some operators.
After clearing the first wave, the team will tackle second migrations, adding all referral mining bonuses linked to KYC‑verified team members. Pi says these referral rewards will follow once the current queue finishes.
Finally, the network will move into ongoing periodic migrations—potentially monthly or quarterly—to process any remaining bonuses and rewards.
The cadence “is to be determined,” the roadmap notes.
Community Concerns and Critical Gaps
A thorough observation reveals several gaps and potential concerns in the roadmap.
For one, the plan never discloses how many Pioneers remain in the queue or the network’s daily migration capacity. Without those figures, users can’t predict when their own migration will occur.
Node operators report that some “confirmed Node rewards” have landed, but criteria for qualification remain opaque. Early node runners worry they may miss out without clear benchmarks.
Many Pioneers say they have tapped their claim buttons daily since migration opened yet still lack basic mining rewards. They question whether those base rewards and deferred referral bonuses will ever arrive in phase two.
Also, the roadmap admits the UI’s “Transferable Balance” underestimates actual migrated amounts to save resources. Users fear this pessimistic display could erode trust if their true balances remain hidden.
“I thought we were mining all of these PI coins this whole time? I thought the security circles were the Consensus Mechanism. It kinda seems to me like there isn’t a blockchain, and never was one. What kind of “Blockchain protocol” would “Require” all tokens to be minted at genesis?” one community member wrote.
Crucially, Pi offers no audit or error‑resolution process for users who spot mismatches in their historical mining data.
Given six years of complex records, occasional disputes seem inevitable, but the roadmap remains silent on redress.
All migrations hinge on KYC completion, yet the team omits any scaling targets or timelines for identity verification. A bottleneck here could stall every subsequent phase.
The schedule also ignores how major token unlock events—such as the roughly 108.9 million PI tokens due to release this month—will align with migration waves.
Finally, some Pioneers challenge the project’s foundational narrative. They note that Pi’s statement “all tokens were minted at genesis” contradicts six years of “mining.”
This raises doubts about whether Pi ever operated on a true blockchain protocol.
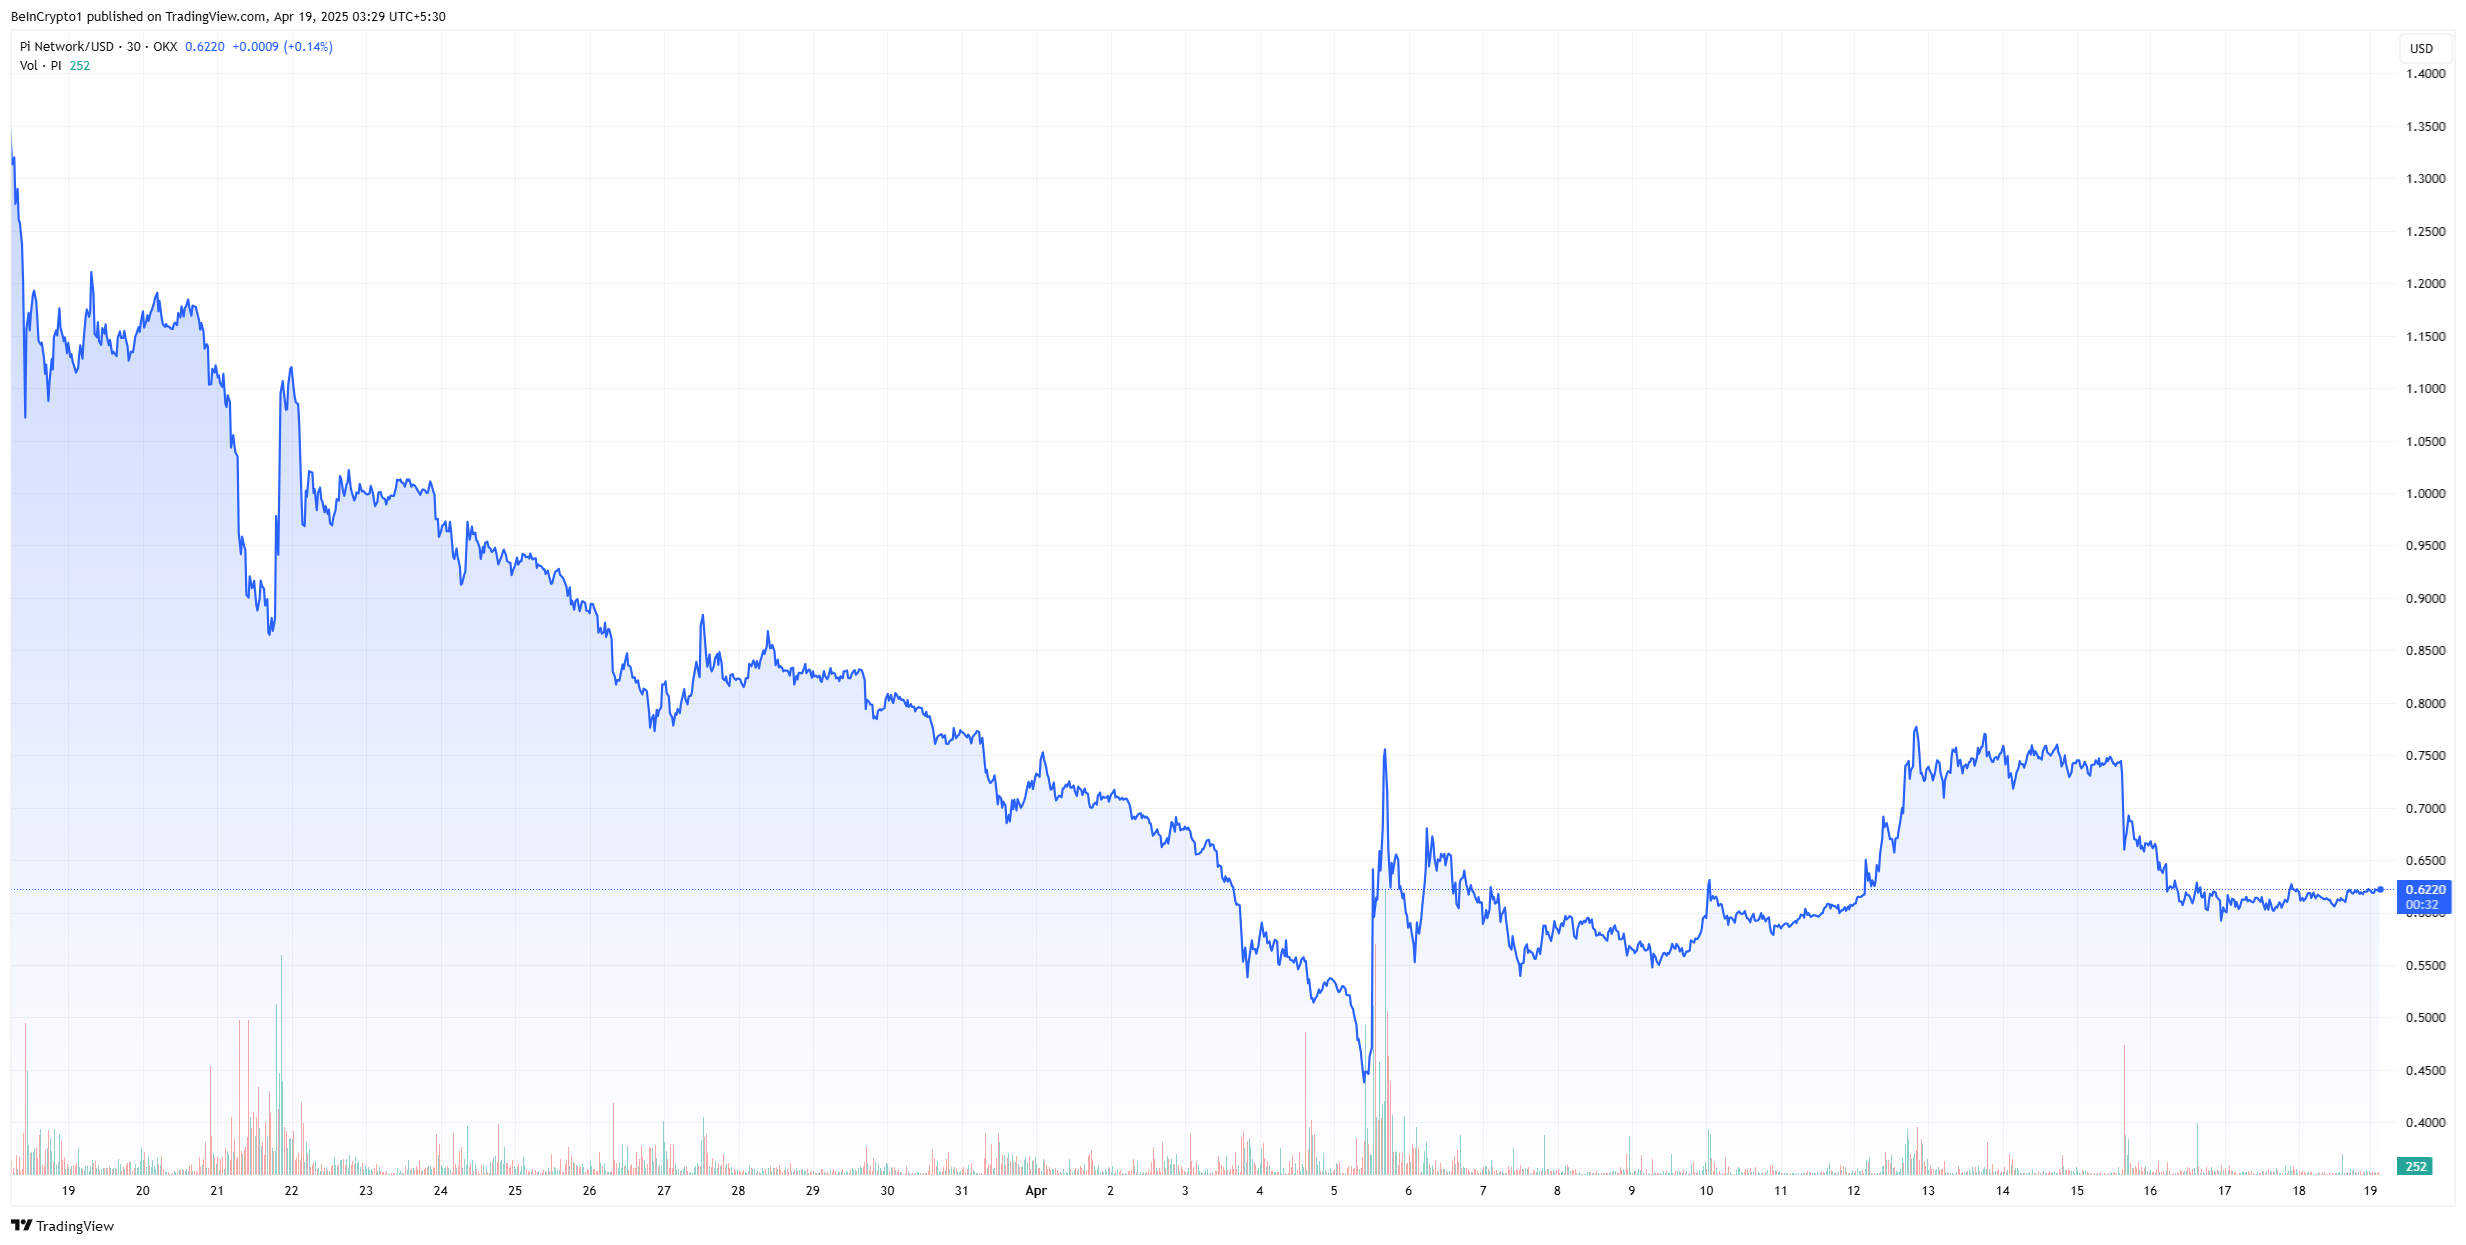
In the past month, PI price has dipped by over 45%. To sustain momentum and community trust, the team must now supply concrete timelines, transparent criteria, and clear audit paths for its Mainnet migration.
Disclaimer
In adherence to the Trust Project guidelines, BeInCrypto is committed to unbiased, transparent reporting. This news article aims to provide accurate, timely information. However, readers are advised to verify facts independently and consult with a professional before making any decisions based on this content. Please note that our Terms and Conditions, Privacy Policy, and Disclaimers have been updated.

The meme coin market is experiencing a surge in investor interest, helping certain tokens recover from their all-time lows (ATLs). Memecoin (MEME) is one such token that has avoided a new ATL and also posted a significant 73% rise.
BeInCrypto has analyzed two other meme coins that have performed well over the past day, making them important tokens to watch.
Memecoin (MEME)
- Launch Date – November 2023
- Total Circulating Supply – 43.11 Billion MEME
- Maximum Supply – 69 Billion MEME
- Fully Diluted Valuation (FDV) – $135.37 Million
MEME had a rough week, hitting a new all-time low at $0.00137. However, the altcoin rebounded sharply, rising by 38% in the last 24 hours to trade at $0.00196. This surge marks a significant recovery, driven by renewed interest in meme coins.
The recent surge in MEME’s price was fueled by a sudden spike in interest for joke tokens, driving a 73% intraday high. To maintain its gains, MEME must successfully breach and flip the $0.00228 resistance into support, a critical level for sustaining its upward momentum.
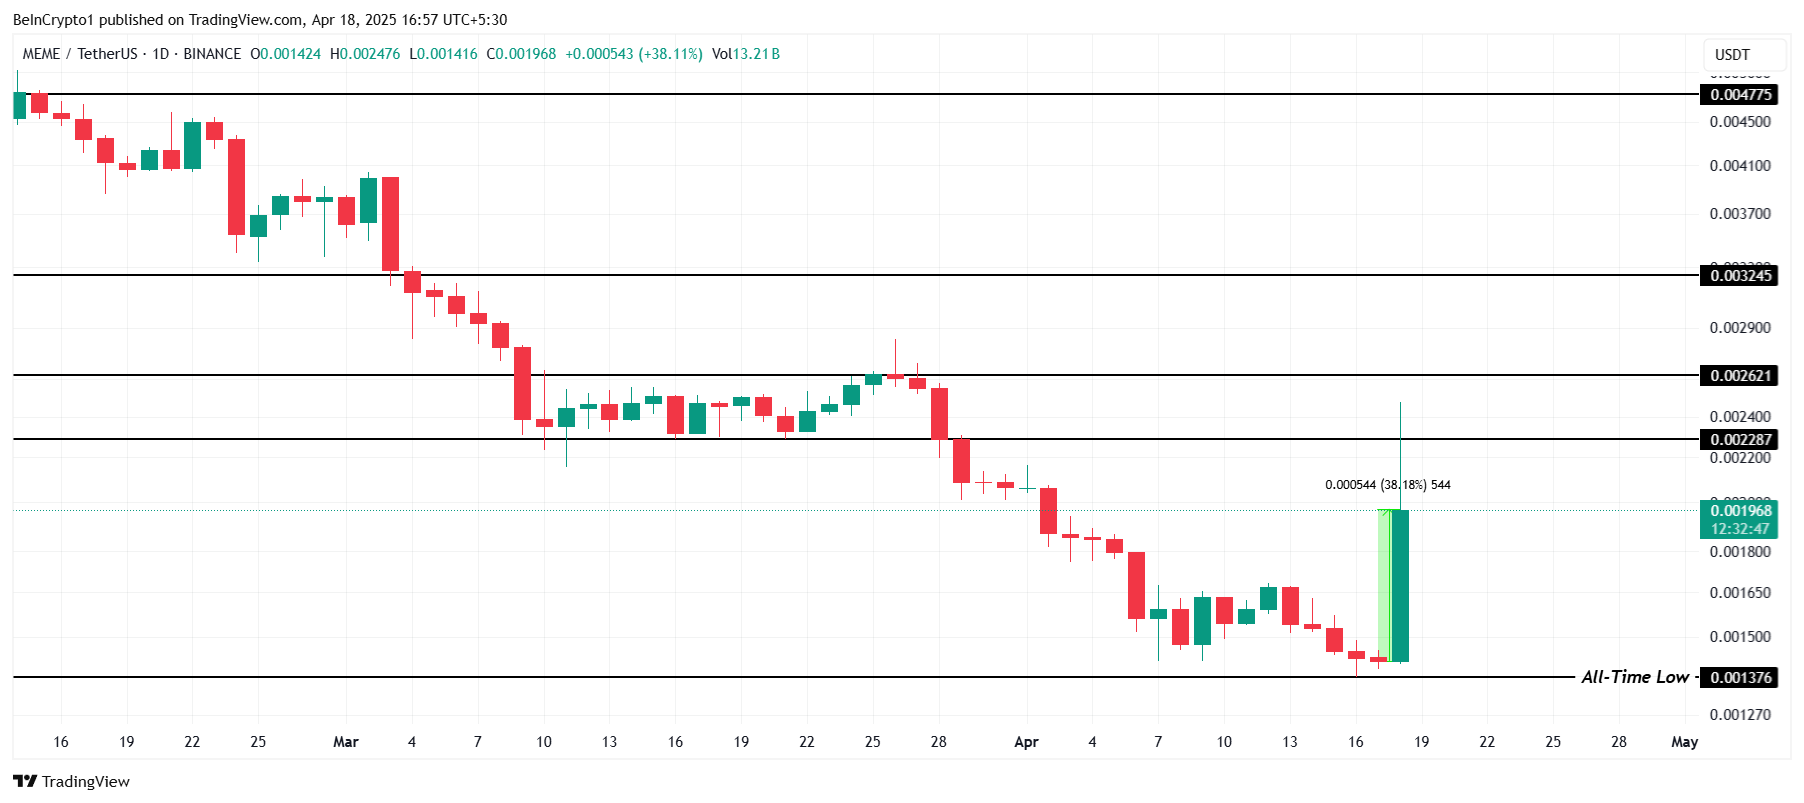
If MEME experiences profit-taking from investors, it could reverse course and drop back down to the all-time low of $0.00137. A decline through this level would invalidate the bullish outlook and signal further challenges for the meme coin.
Bone ShibaSwap (BONE)
- Launch Date – July 2021
- Total Circulating Supply – 249.89 Million BONE
- Maximum Supply – 250 Million BONE
- Fully Diluted Valuation (FDV) – $71.67 Million
BONE posted an impressive 18.5% rise over the last 24 hours, trading at $0.285. The altcoin is currently under the key resistance of $0.295. Given the recent momentum, it seems poised to breach this level, signaling a potential upward trajectory for the token in the near future.
Flipping the $0.295 resistance into support would open the door for BONE to target its next major resistance at $0.348. A sustained push above this level could drive further bullish sentiment, propelling the token toward even higher price levels.

However, if BONE fails to breach $0.295, the bullish momentum could fade. A decline from this point could send the meme coin back towards $0.232, invalidating the optimistic outlook. Such a reversal would likely create caution among investors, delaying potential upward movement.
- Launch Date – April 2024
- Total Circulating Supply – 999.96 Million BAN
- Maximum Supply – 1 Billion BAN
- Fully Diluted Valuation (FDV) – $40.54 Million
BAN, a small-cap token, has caught the attention of investors, rising nearly 25% in the last 24 hours to trade at $0.040. This surge highlights the growing interest in the meme coin market, with BAN standing out despite its smaller market capitalization.
Inspired by the infamous banana taped to a wall, BAN gained significant fame after being purchased by Tron’s founder, Justin Sun, for $6.2 million last year. If the token continues its upward momentum, it could breach the $0.045 barrier and potentially flip it into support, securing its gains.

However, failing to break through the $0.045 resistance could lead to a drop back to $0.032. If this occurs, it would invalidate the bullish outlook and erase the recent gains, putting investors on alert for further price declines.
Disclaimer
In line with the Trust Project guidelines, this price analysis article is for informational purposes only and should not be considered financial or investment advice. BeInCrypto is committed to accurate, unbiased reporting, but market conditions are subject to change without notice. Always conduct your own research and consult with a professional before making any financial decisions. Please note that our Terms and Conditions, Privacy Policy, and Disclaimers have been updated.

Solana (SOL) Price Rises 13% But Fails to Break $136 Resistance

Pi Network Roadmap Frustrates Users Over Missing Timeline

MEME Rallies 73%, BONE Follows

Canary Capital Files For Staked Tron ETF

XRP Volume Plunges 20% Amid Market Uncertainty

BONK Symmetrical Triangle Squeeze: Is A Mega Breakout Imminent?

2.52 Million Altcoins Are Ruining Crypto’s Future

Animoca Brands Valuation Tanks 75% In Two Years, Here’s Why

Crypto exchange BingX hacked for $43 million

Are The Big Players Losing Interest?

Hong Kong’s Securities Association Tips Authorities On Crypto Self-Regulation

Coinbase cbBTC Set to go Live on Solana
2.52 Million Altcoins Are Ruining Crypto’s Future
Animoca Brands Valuation Tanks 75% In Two Years, Here’s Why
Crypto exchange BingX hacked for $43 million
Are The Big Players Losing Interest?
Hong Kong’s Securities Association Tips Authorities On Crypto Self-Regulation
Coinbase cbBTC Set to go Live on Solana
-

 Ethereum23 hours ago
Ethereum Investors Suffer More Losses Than Bitcoin Amid Ongoing Market Turmoil
-

 Market20 hours ago
Ethereum Price Fights for Momentum—Traders Watch Key Resistance
-
 Altcoin20 hours ago
Expert Predicts Pi Network Price Volatility After Shady Activity On Banxa
-

 Altcoin24 hours ago
Dogecoin Price Breakout in view as Analyst Predicts $5.6 high
-

 Ethereum16 hours ago
Ethereum Fee Plunges To 5-Year Low—Is This A Bottom Signal?
-
 Altcoin23 hours ago
Tron Founder Justin Sun Reveals Plan To HODL Ethereum Despite Price Drop
-

 Market18 hours ago
Is XRP’s Low Price Part of Ripple’s Long-Term Growth Strategy?
-

 Market22 hours ago
Sui Meme Coins Surge With Rising DEX Volumes