
Market
XRP Targets Rebound After Hitting Oversold Territory
XRP is down over 5% in the past 24 hours but is currently attempting a rebound, trying to push above the $2 level. After touching deeply oversold RSI levels earlier today, the token is showing early signs of recovery amid shifting macro headlines.
Despite a bearish setup on the Ichimoku Cloud, a short-term bounce is not off the table if momentum builds. However, strong resistance zones remain overhead, and whether XRP can sustain this rebound will depend on both technical breakouts and broader market sentiment.
XRP RSI Is Going Up After Touching Oversold Levels
XRP’s Relative Strength Index (RSI) is currently sitting at 44.24, bouncing back after briefly plunging to 17.80 earlier today—its lowest level in weeks, with its price rebounding after news about Trump considering a 90-day pause in tariffs for all countries except China.
Just a day ago, the RSI was at 46.97, reflecting the sharp volatility XRP has experienced during the recent market sell-off. The RSI is a momentum indicator that ranges from 0 to 100, typically used to identify whether an asset is overbought (above 70) or oversold (below 30).
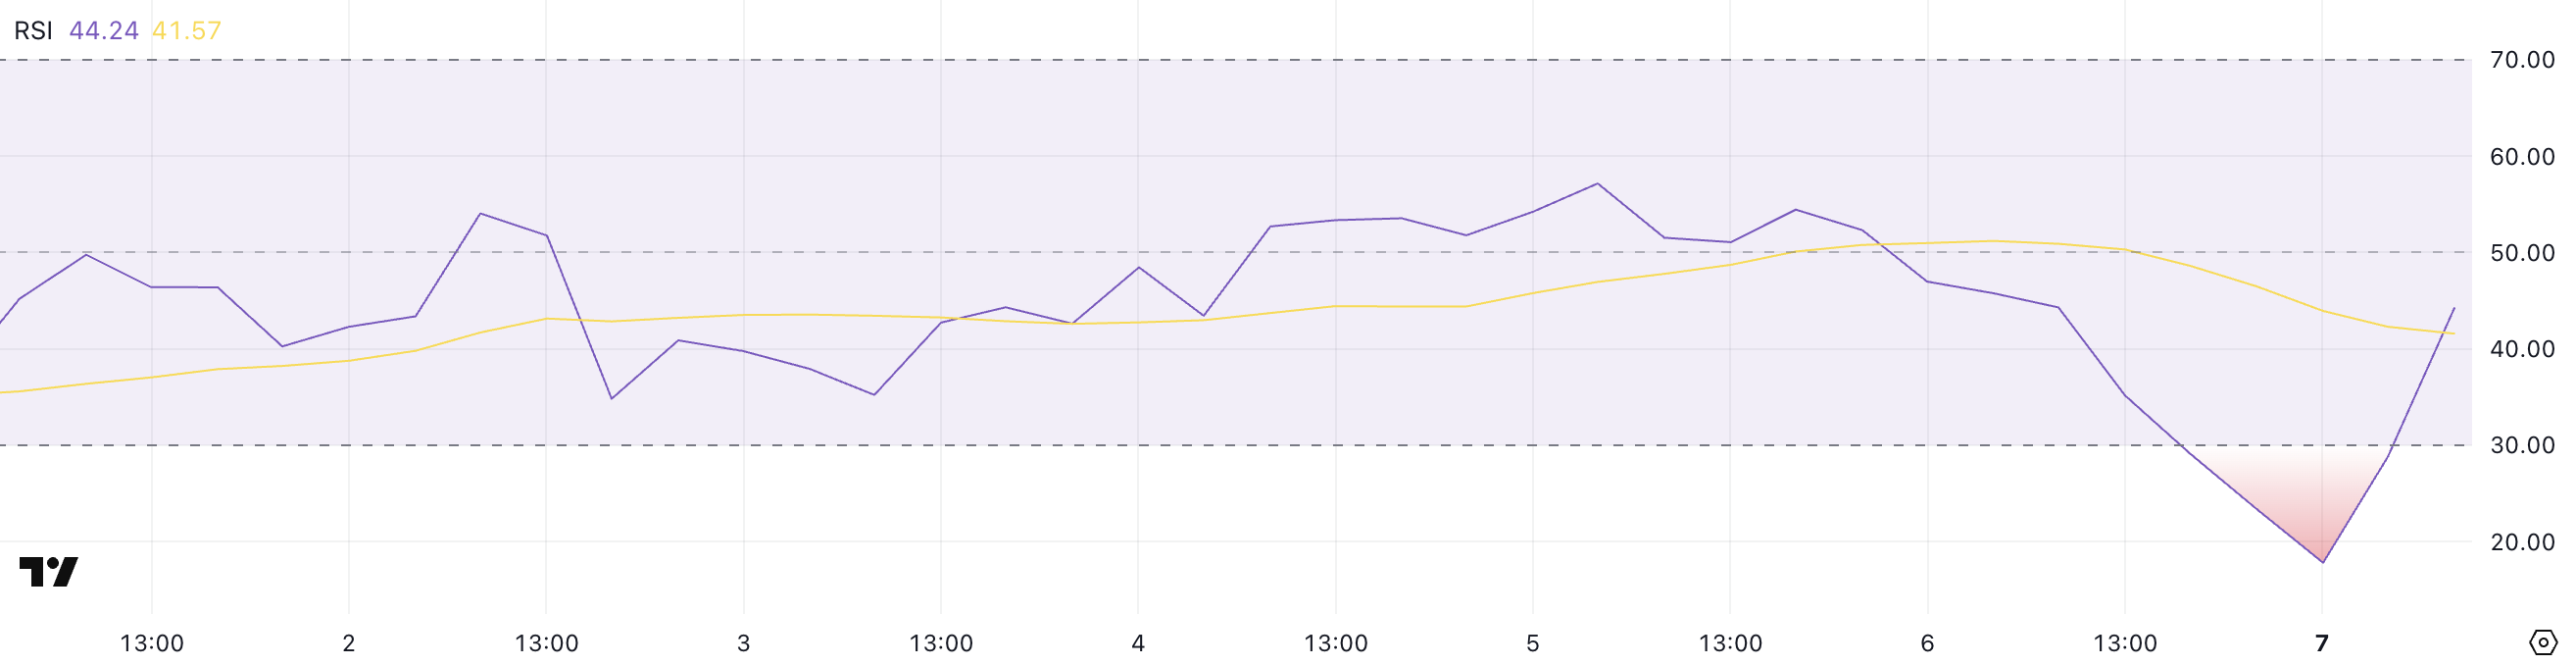
An RSI reading of 44.24 places XRP in neutral territory, suggesting that the selling pressure may be easing, but momentum remains weak. Importantly, XRP hasn’t crossed into overbought territory for nearly three weeks, signaling a lack of sustained bullish momentum.
If the RSI continues to climb and breaks above 50, it could indicate growing strength and potential price recovery. However, if it stalls or turns lower, XRP may continue to struggle for direction in the short term.
XRP Ichimoku Cloud Shows a Bearish Setup, But A Recovery Could Be On The Horizon
The Ichimoku Cloud chart for XRP shows a bearish structure. The price is trading well below the Kumo (cloud), indicating strong downward momentum.
Both the Tenkan-sen (blue line) and Kijun-sen (red line) are sloping down and currently positioned above the price, acting as dynamic resistance levels.
The cloud ahead is red and wide, suggesting continued bearish pressure and little immediate sign of a trend reversal.

However, the recent bullish candle pushing toward the Tenkan-sen hints at a possible short-term bounce or relief rally.
For a true trend shift, XRP would need to break above both the Tenkan-sen and Kijun-sen and eventually enter or surpass the cloud—a scenario that remains distant given the current formation.
Overall, the Ichimoku setup reinforces the broader weakness, with any upside likely facing strong resistance from the cloud and key lines.
Could XRP Break Above $2.20 Soon?
XRP price recently broke below the $1.80 mark for the first time since November 2024, reflecting heavy market pressure and a sharp sell-off. However, the asset has shown signs of recovery in the past few hours, attempting to regain momentum.
If this rebound gains strength, XRP could push toward resistance at $2.02, and a successful breakout may open the path to higher levels around $2.23.
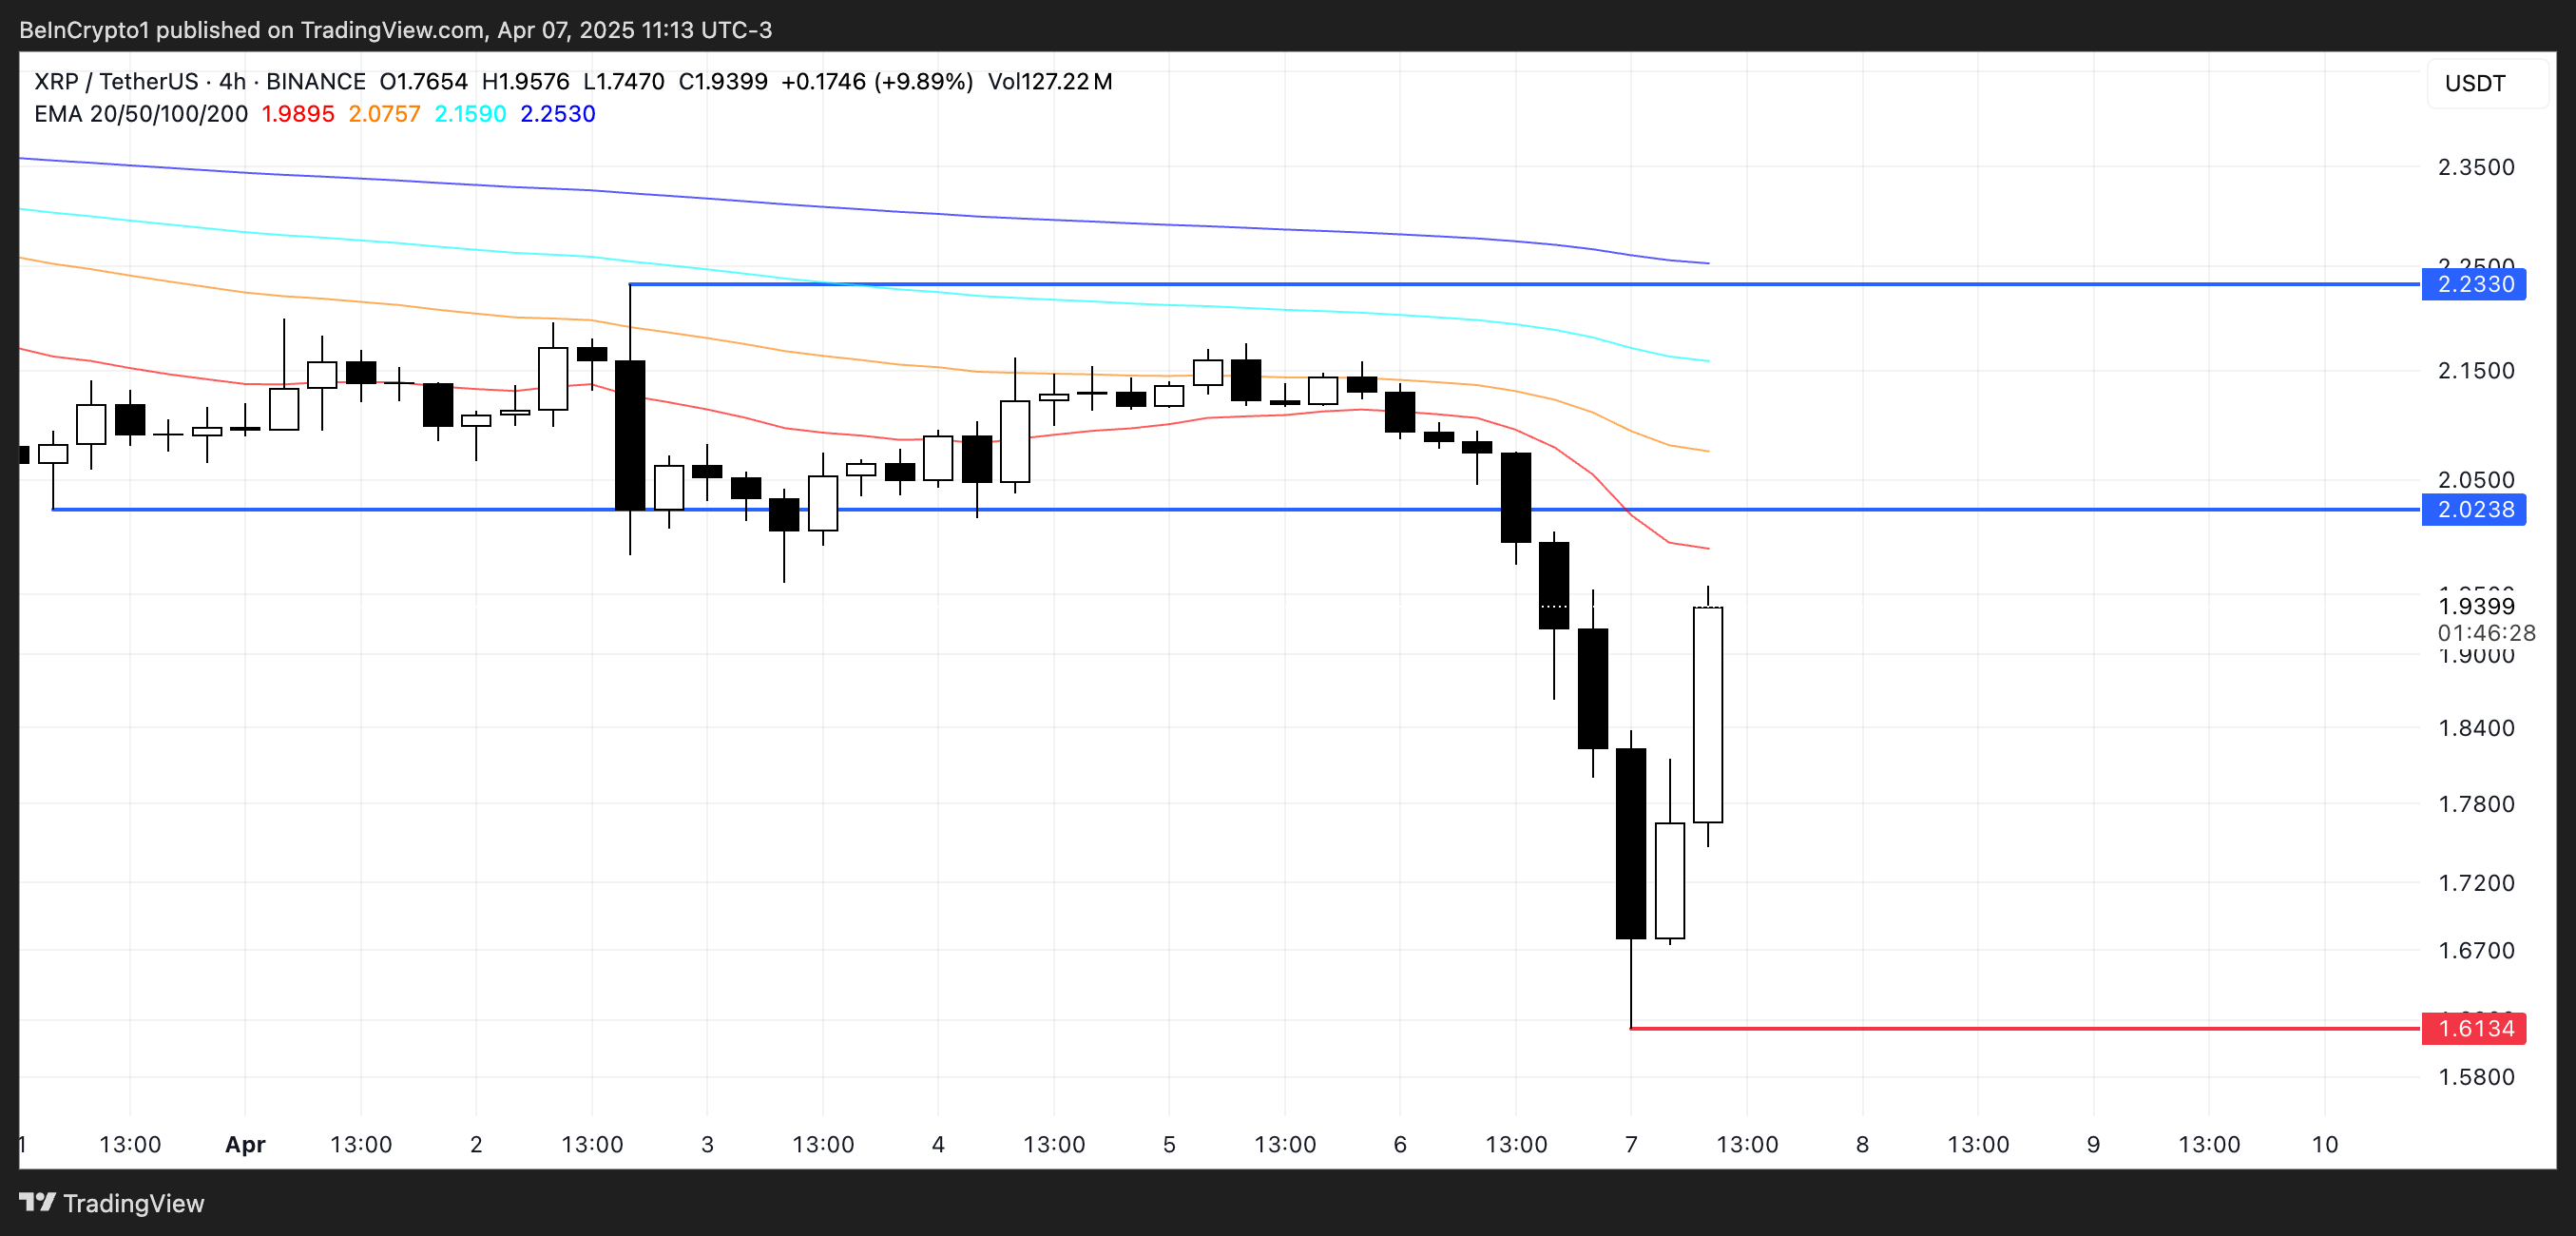
On the flip side, if XRP fails to sustain its current recovery, the price could drop back below $1.80 and revisit support near $1.61.
A breakdown from that level would increase bearish pressure, potentially dragging the price down toward the $1.50 zone.
Disclaimer
In line with the Trust Project guidelines, this price analysis article is for informational purposes only and should not be considered financial or investment advice. BeInCrypto is committed to accurate, unbiased reporting, but market conditions are subject to change without notice. Always conduct your own research and consult with a professional before making any financial decisions. Please note that our Terms and Conditions, Privacy Policy, and Disclaimers have been updated.


According to CoinGecko’s quarterly report, the overall crypto market cap fell 18.6% in Q1 2025. Trading volume on centralized exchanges also fell 16% compared to the previous quarter.
This report identified a few positive trends, but most of them contained at least one significant downside. Despite the market euphoria in January, recession fears are taking a very serious toll.
Crypto Suffered Heavy Losses in Q1
The latest CoinGecko report shows just how bearish the first quarter of the year has been. Although the crypto market started January with a major bullish cycle, macroeconomic factors have heavily impacted market sentiment for the past two months.
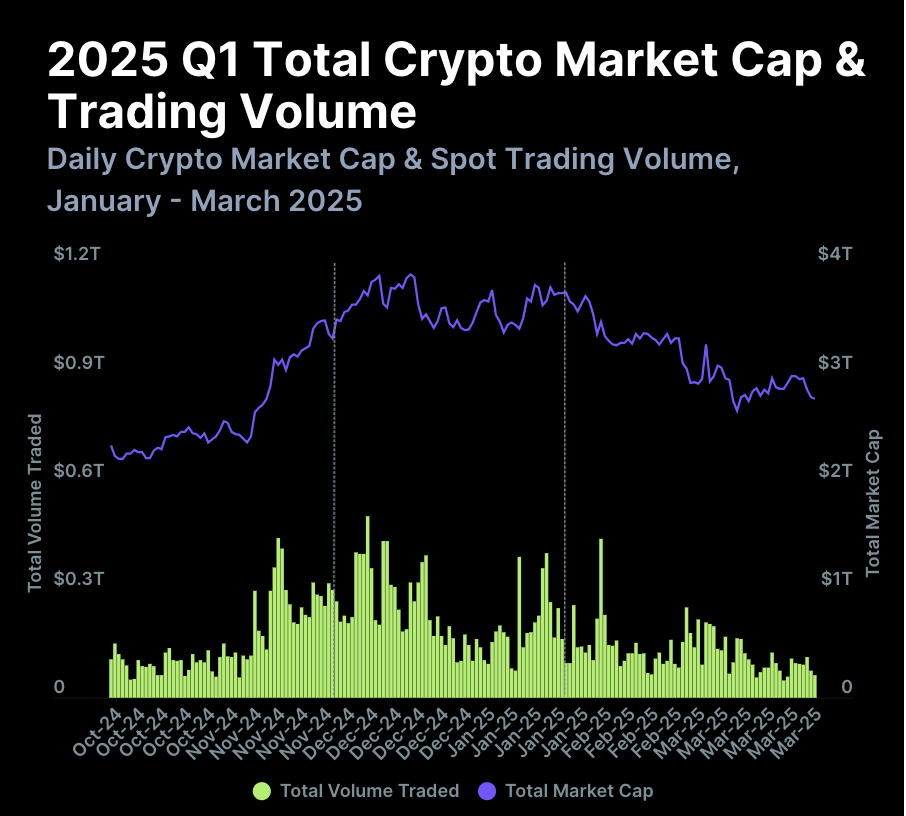
According to this report, crypto’s total market cap fell 18.6% in Q1 2025, a staggering $633.5 billion. Investor activity fell alongside token prices, as daily trading volumes fell 27.3% quarter-on-quarter from the end of 2024. Spot trading volume on centralized exchanges fell 16.3%, which CoinGecko at least partially attributes to the Bybit hack.
The report mostly focused on concrete numbers, but it pointed to a few specific events that impacted crypto. Markets hit a local high around Trump’s inauguration, thanks to market euphoria over possible friendly policies.
His TRUMP meme coin fueled a brief frenzy in Solana meme coin activity, but this quickly slumped. The LIBRA scandal had a further dampening impact.
Bitcoin increased its dominance in Q1 2025, accounting for 59.1% of crypto’s total market cap. It hasn’t maintained that share of the market since 2021, symbolizing how much more stable it’s been than altcoins.
Nevertheless, BTC also fell 11.8% and was outperformed by gold and US Treasury bonds.
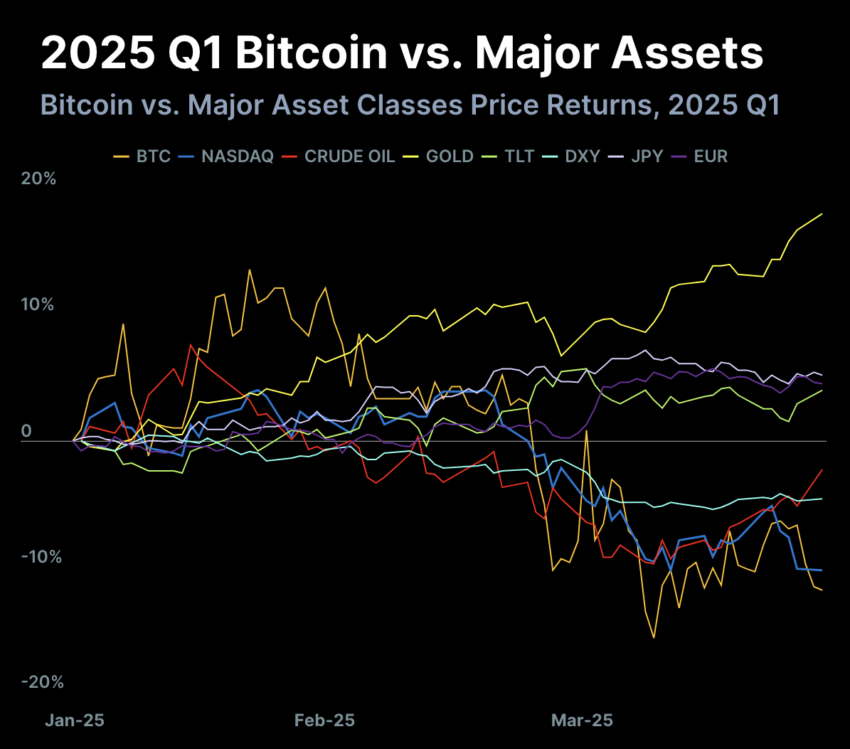
This data point is especially worrying because Trump’s tariffs have wrought havoc on Treasury yields. Even so, the report clearly shows that the rest of crypto suffered even more. Ethereum’s entire 2024 gains vanished in Q1 2025, and multichain DeFi TVL fell 27.5%. C
ountless other areas saw similar results, but they’re too numerous to easily summarize.
That is to say, almost every quantifiable positive development came with at least one major caveat. Solana dominated the DEX trade, but its TVL declined by over one-fifth.
Bitcoin ETFs saw $1 billion in fresh inflows, but total AUM fell by nearly $9 billion due to price drops. The reports reflect that recession fears are gripping the crypto market.
Disclaimer
In adherence to the Trust Project guidelines, BeInCrypto is committed to unbiased, transparent reporting. This news article aims to provide accurate, timely information. However, readers are advised to verify facts independently and consult with a professional before making any decisions based on this content. Please note that our Terms and Conditions, Privacy Policy, and Disclaimers have been updated.

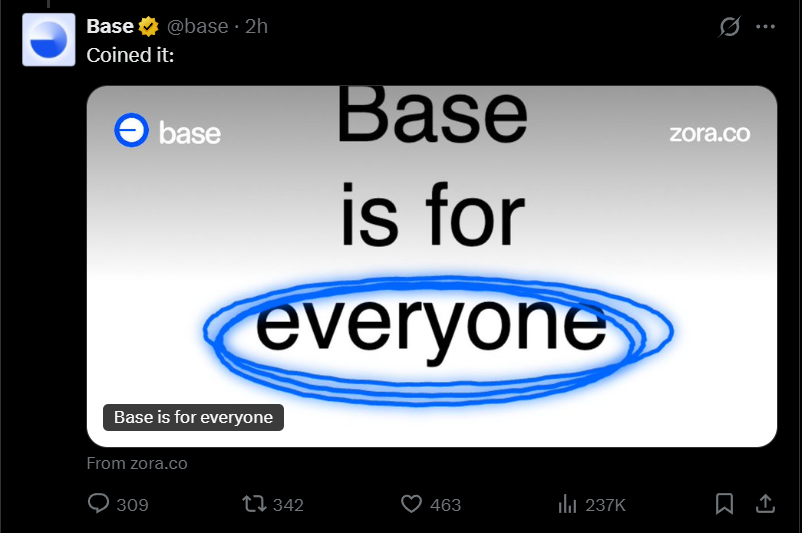
Coinbase’s Layer 2 network, Base, is facing intense scrutiny after what appears to be a major pump and dump—one that it inadvertently helped fuel. The project’s official Twitter account publicly promoted a meme coin titled “Base is for everyone.”
This triggered a speculative surge, driving the token’s market cap to an estimated $15 to $20 million within hours of launch. The token quickly plummeted near zero in mutes.
Did Base Just Help Fuel a Pump and Dump?
Base’s tweet, which featured promotional imagery and direct links to the meme coin on Zora, created the perception of legitimacy.
Traders piled in, and price charts reflected an explosive rally—followed by an equally sharp collapse.
Within one 4-hour trading window, a green candle representing millions in inflow was immediately reversed by a red candle of equal size, marking a total loss of liquidity and confirming a textbook pump and dump.
The token’s value fell by more than 99%, and trading volumes on Uniswap surged past $13 million during the brief window of activity.
There is massive ongoing outrage against both Coinbase and Base. Crypto influencers have called the incident a failure of due diligence and communications strategy.
Accusations of incompetence and poor risk oversight are spreading fast on social media, while memes mocking the network’s “Base is for everyone” slogan are everywhere.
Base is yet to provide an official response to the incident.
Disclaimer
In adherence to the Trust Project guidelines, BeInCrypto is committed to unbiased, transparent reporting. This news article aims to provide accurate, timely information. However, readers are advised to verify facts independently and consult with a professional before making any decisions based on this content. Please note that our Terms and Conditions, Privacy Policy, and Disclaimers have been updated.

XRP is back trading above, $2, and bullish momentum is gradually creeping back compared to its price action at the end of March and beginning of April. Crypto analyst EGRAG CRYPTO believes this week could highlight a turning point for a full flip into bullish momentum, and how the XRP price closes out the week will be very important.
According to the analyst’s outlook, which was posted on social media platform X, the current XRP candle on the weekly timeframe is hovering just above both $2.10 and the 21-week Exponential Moving Average (EMA). However, he noted that the real confirmation lies with if XRP can manage to close the week with a full-bodied candle above $2.25.
Why Is $2.25 Important For XRP’s Price?
The $2.25 level has now become more than just another short-term resistance. It is what EGRAG considers the final barrier to validating the recovery structure forming after March and April’s sharp retracement. His weekly chart shows XRP climbing out from a significant low after bouncing off the 0.888 Fib extension level and now stabilizing above the yellow 21-week EMA line.
The alignment of XRP’s price above both the $2.10 price level and this moving average adds credibility to the potential of a bullish continuation, but EGRAG makes it clear that a weekly close above $2.25 is the “lock-in” point. From a technical standpoint, this would mark the first full-bodied weekly candle above the 21W EMA since the past four weeks. If achieved, this can be interpreted confirmation that bulls have regained dominance and that a bottom was established on April 7.

Furthermore, it suggests that the April 7 bottom will continue to hold as support going forward. The chart also outlines close price targets at $2.51 and $2.60, with Fibonacci extension levels projecting even higher zones at $2.69 on the way to crossing back above $3.
Failing To Close Above $2.25 Could Reintroduce Unwanted Narratives
EGRAG also issued a cautionary note in case there isn’t a clean breakout. Should XRP fail to close the weekly candle above $2.25, he warned it could trigger a return of bearish narratives, including what he referred to as a possible “tariff issue.” This is referring to the recent tariff back-and-forth between the US and China in the past month, which has unbalanced the investment markets.
A strong rejection could see the XRP price pull back toward the $1.96 Fibonacci level or even lower into the broader support band of around $1.58 to $1.30. The white box region on the chart above would then become the primary battleground for bulls and bears if a close above $2.25 is not secured by the end of the week.

Crypto Market Lost $633 Billion in Q1 2025, CoinGecko Finds

Base Meme Coin Wipes $15 Million After Official Promotion

ETF Issuers Bring Stability to Bitcoin Despite Tariff Chaos

Here’s What Happens If The XRP Price Closes Out This Week Above $2.25

Over 1.9M Ethereum Positioned Between $1,457 And $1,598 – Can Bulls Hold Support?

Bitcoin and Ethereum Now Accepted by Panama City Government

2.52 Million Altcoins Are Ruining Crypto’s Future

Animoca Brands Valuation Tanks 75% In Two Years, Here’s Why

Crypto exchange BingX hacked for $43 million

Are The Big Players Losing Interest?

Hong Kong’s Securities Association Tips Authorities On Crypto Self-Regulation

Coinbase cbBTC Set to go Live on Solana
2.52 Million Altcoins Are Ruining Crypto’s Future
Animoca Brands Valuation Tanks 75% In Two Years, Here’s Why
Crypto exchange BingX hacked for $43 million
Are The Big Players Losing Interest?
Hong Kong’s Securities Association Tips Authorities On Crypto Self-Regulation
Coinbase cbBTC Set to go Live on Solana
-

 Market24 hours ago
Hedera Under Pressure as Volume Drops, Death Cross Nears
-

 Market22 hours ago
3 US Crypto Stocks to Watch Today: CORZ, MSTR, and COIN
-

 Market21 hours ago
Bitcoin Price on The Brink? Signs Point to Renewed Decline
-

 Market23 hours ago
Ethena Labs Leaves EU Market Over MiCA Compliance
-
 Market19 hours ago
XRP Price Pulls Back: Healthy Correction or Start of a Fresh Downtrend?
-
 Altcoin18 hours ago
Ripple Whale Moves $273M As Analyst Predicts XRP Price Crash To $1.90
-

 Market18 hours ago
Arbitrum RWA Market Soars – But ARB Still Struggles
-

 Bitcoin17 hours ago
Is Bitcoin the Solution to Managing US Debt? VanEck Explains
