
Market
XRP Price Growth Hindered by Bitcoin Correlation

XRP’s strong correlation with Bitcoin (BTC) might be limiting its performance, as the token has remained relatively muted over the past two months, despite several events that would typically trigger positive price movements.
For instance, in July, reports revealed that Donald Trump raised over $4 million in campaign donations through digital tokens, including XRP, yet this news did not impact XRP’s price. Additionally, the altcoin showed no reaction when 33 million tokens were transferred to a Binance wallet on August 22. Most recently, after Ripple announced plans to introduce smart contracts to the XRP Ledger (XRPL), XRP’s price dropped by 3%.
Ripple’s Ties with Bitcoin Spells Trouble
Ripple’s announcement of plans to introduce smart contracts to the XRP Ledger (XRPL) should ideally have sparked a positive price reaction for XRP. However, the altcoin’s strong correlation with Bitcoin (BTC), with a correlation coefficient of 0.72, has resulted in a muted response. This figure reflects a reasonably strong positive relationship between the two assets.
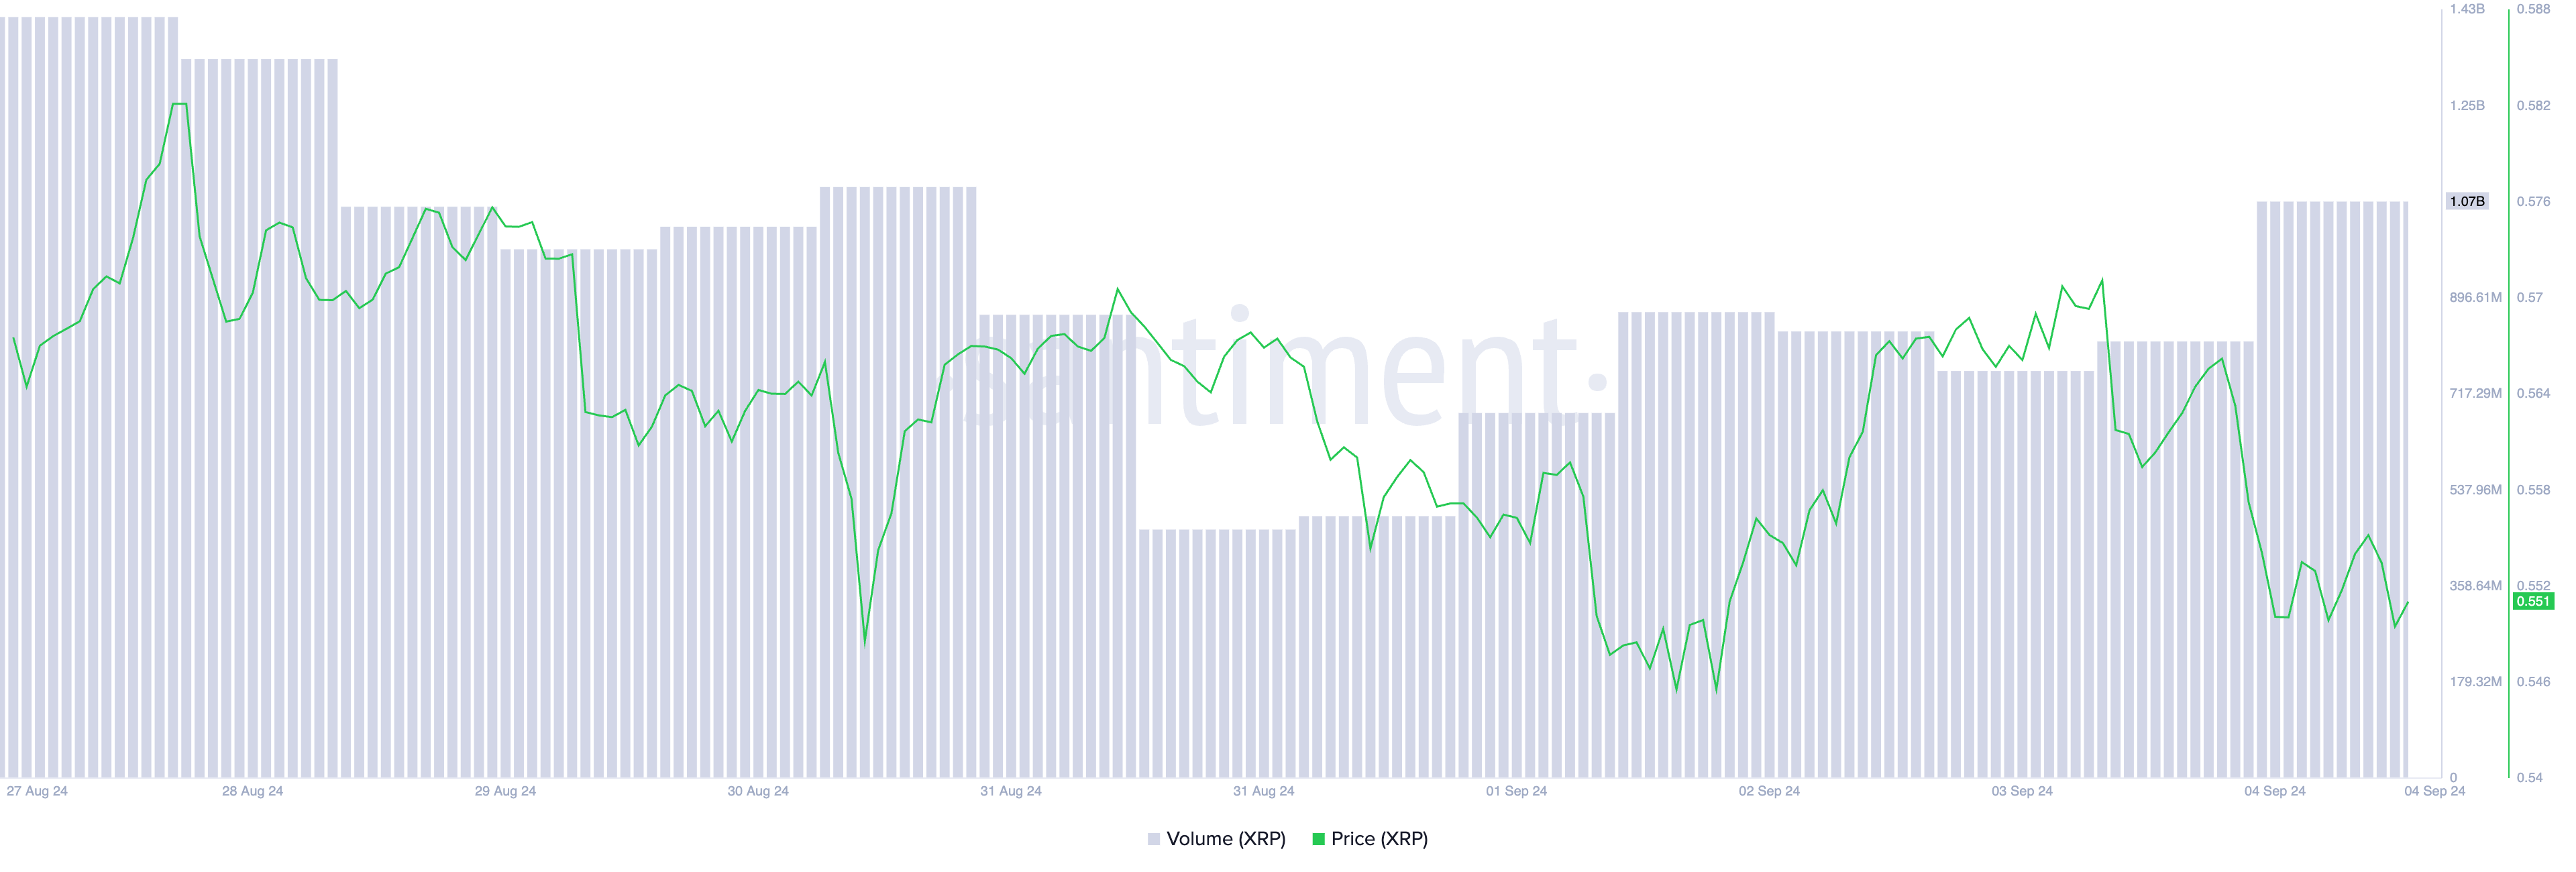
In the past 24 hours, Bitcoin’s price has dropped by 4%, and XRP followed with a 3% decline. Despite this drop, XRP’s trading volume surged by 39%, creating a negative divergence. Such divergence typically indicates increasing selling pressure, suggesting XRP could face further decline.
Read more: XRP ETF Explained: What It Is and How It Works
XRP’s negative price-to-daily active address divergence further confirms the increase in selling activity. This metric tracks the asset’s price movements and compares them with changes in the number of daily active addresses.
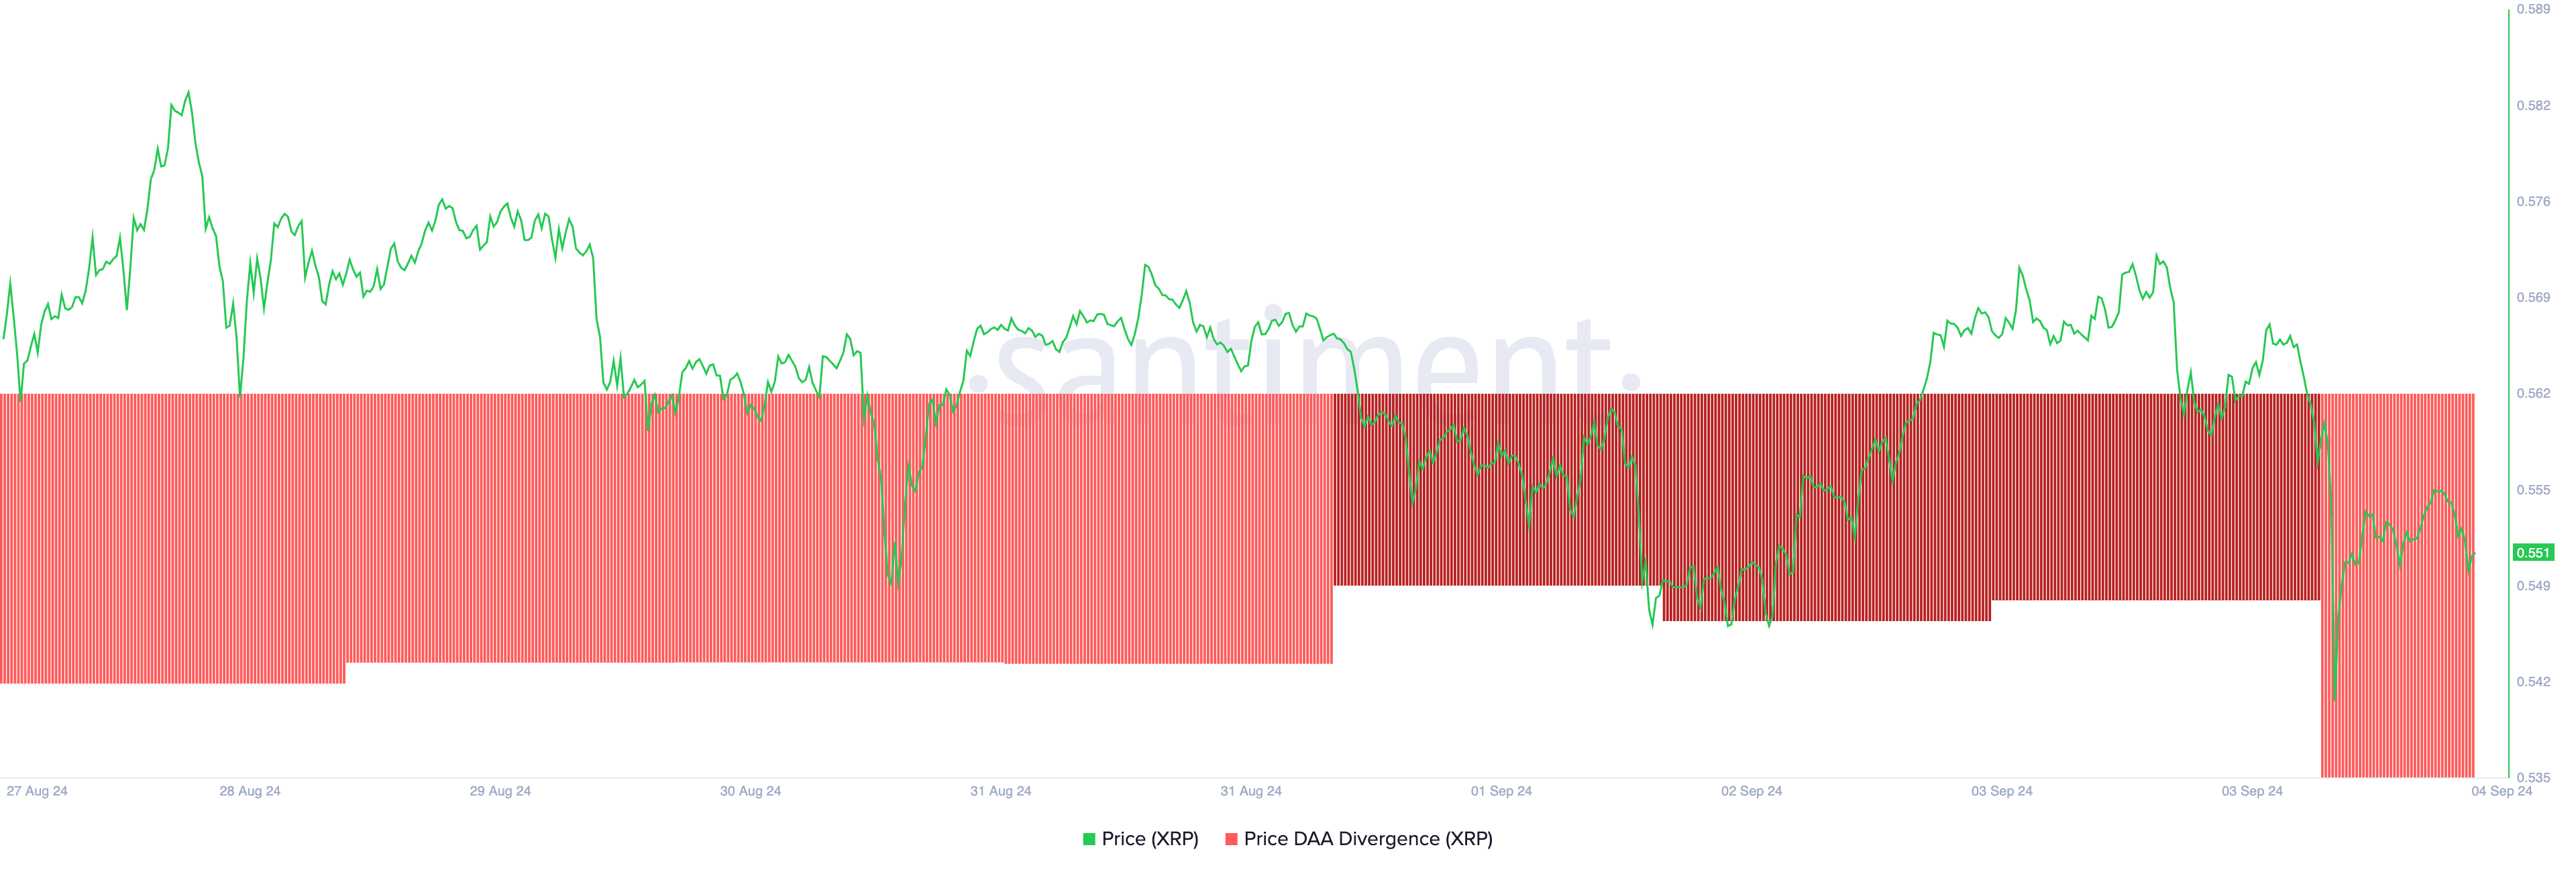
As of this writing, XRP’s price-to-daily active address divergence stands at -63.81, signaling reduced participation in buying, selling, or holding XRP, which could contribute to continued price pressure.
XRP Price Prediction: Brace For More Devaluation
At press time, XRP is trading at $0.55, and its 12-hour chart suggests further decline. The token’s MACD line (blue) sits below its signal line (orange) and the zero line, indicating a strong bearish trend. This setup signals a continued downtrend unless a reversal occurs, prompting traders to either avoid the market or consider short positions.
Additionally, XRP’s bull-bear power, measured by the Elder-Ray Index, reveals that sellers dominate the market. As of now, the index stands at -0.035, having remained negative since August 26, indicating bear power is in control.
Read more: Ripple (XRP) Price Prediction 2024/2025/2030
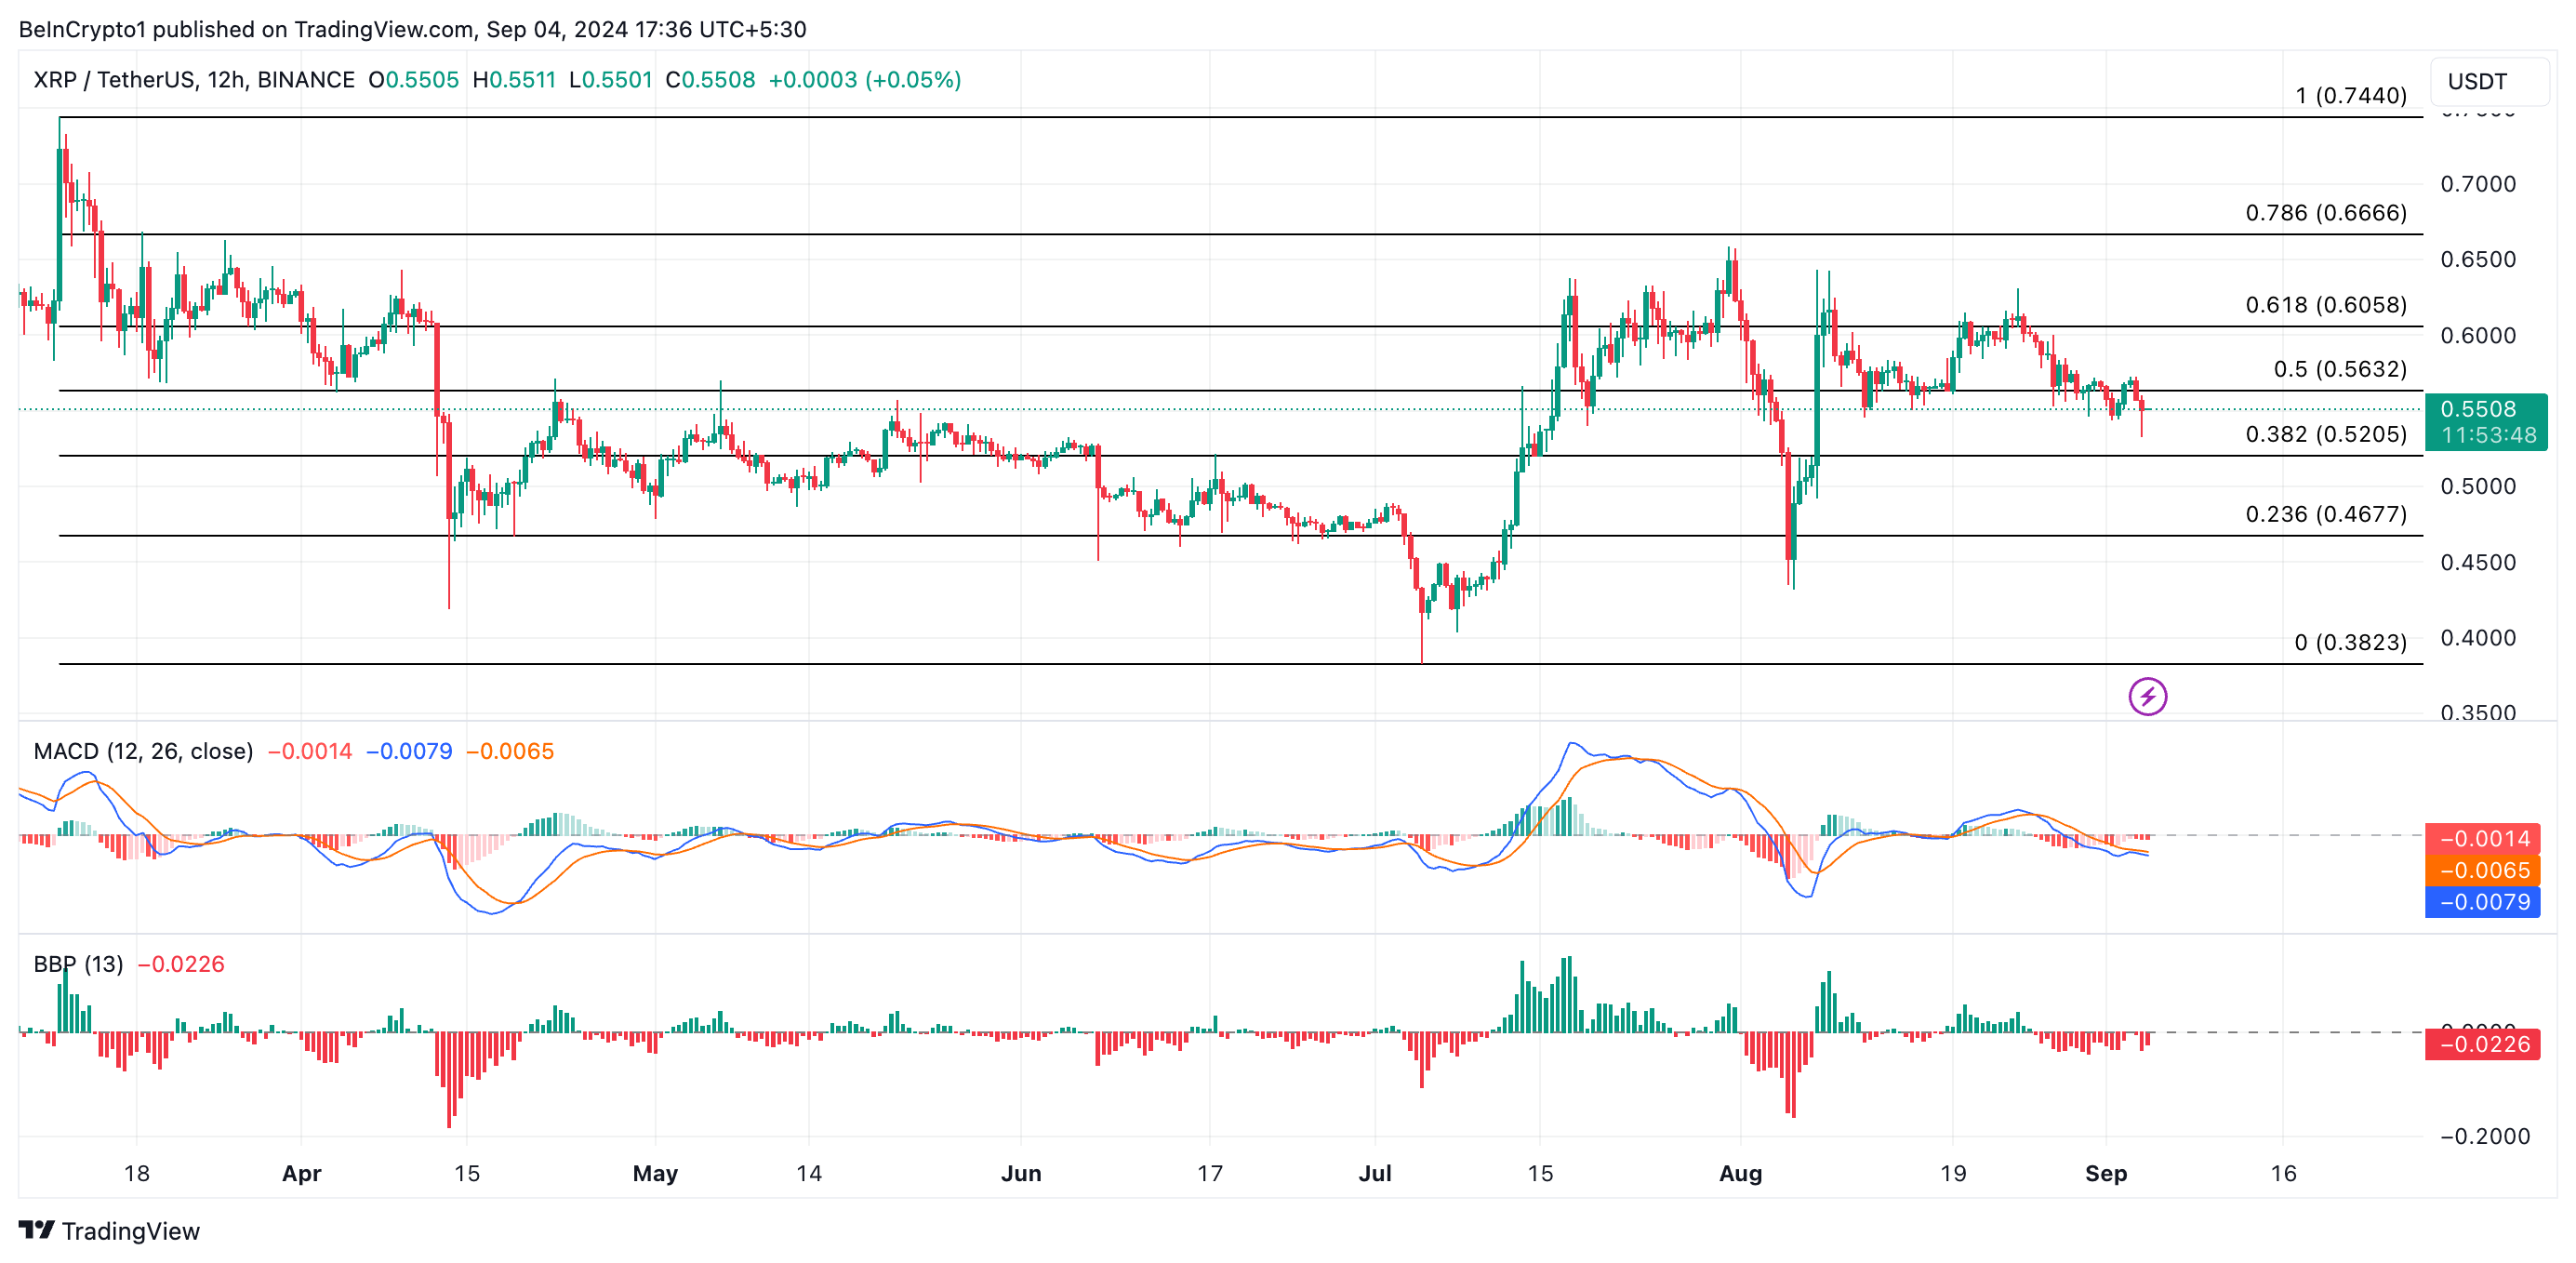
If bears continue to overpower bulls, XRP’s price could drop to $0.52. Should this level fail to hold, a further decline to $0.46 may follow. However, if market sentiment shifts to bullish, XRP could rise to $0.56.
Disclaimer
In line with the Trust Project guidelines, this price analysis article is for informational purposes only and should not be considered financial or investment advice. BeInCrypto is committed to accurate, unbiased reporting, but market conditions are subject to change without notice. Always conduct your own research and consult with a professional before making any financial decisions. Please note that our Terms and Conditions, Privacy Policy, and Disclaimers have been updated.


Reason to trust
![]()
Strict editorial policy that focuses on accuracy, relevance, and impartiality
Created by industry experts and meticulously reviewed
The highest standards in reporting and publishing
Strict editorial policy that focuses on accuracy, relevance, and impartiality
Morbi pretium leo et nisl aliquam mollis. Quisque arcu lorem, ultricies quis pellentesque nec, ullamcorper eu odio.
Ethereum price started a fresh increase above the $1,600 zone. ETH is now up nearly 15% and might attempt a move above the $1,680 zone.
- Ethereum started a decent increase above the $1,550 and $1,600 levels.
- The price is trading above $1,550 and the 100-hourly Simple Moving Average.
- There was a break above a key bearish trend line with resistance at $1,470 on the hourly chart of ETH/USD (data feed via Kraken).
- The pair tested the $1,680 resistance zone and might correct some gains.
Ethereum Price Jumps Over 12%
Ethereum price formed a base above $1,380 and started a fresh increase, like Bitcoin. ETH gained pace for a move above the $1,450 and $1,500 resistance levels.
The bulls even pumped the price above the $1,550 zone. There was a break above a key bearish trend line with resistance at $1,470 on the hourly chart of ETH/USD. The pair even cleared the $1,620 resistance zone. A high was formed at $1,687 and the price is now consolidating gains above the 23.6% Fib retracement level of the upward move from the $1,384 swing low to the $1,687 high.
Ethereum price is now trading above $1,550 and the 100-hourly Simple Moving Average. On the upside, the price seems to be facing hurdles near the $1,650 level.

The next key resistance is near the $1,680 level. The first major resistance is near the $1,720 level. A clear move above the $1,720 resistance might send the price toward the $1,750 resistance. An upside break above the $1,750 resistance might call for more gains in the coming sessions. In the stated case, Ether could rise toward the $1,850 resistance zone or even $1,880 in the near term.
Are Dips Limited In ETH?
If Ethereum fails to clear the $1,650 resistance, it could start a downside correction. Initial support on the downside is near the $1,615 level. The first major support sits near the $1,580 zone.
A clear move below the $1,580 support might push the price toward the $1,535 support and the 50% Fib retracement level of the upward move from the $1,384 swing low to the $1,687 high. Any more losses might send the price toward the $1,480 support level in the near term. The next key support sits at $1,420.
Technical Indicators
Hourly MACD – The MACD for ETH/USD is gaining momentum in the bullish zone.
Hourly RSI – The RSI for ETH/USD is now above the 50 zone.
Major Support Level – $1,535
Major Resistance Level – $1,650

Solana (SOL) has experienced significant volatility recently, with a marked decline following its failure to breach the $150 mark.
Over the last few days, Solana has struggled to break through certain resistance levels that have been affected by broader market trends. However, investor optimism appears to be driving recent price movements as SOL nears $120.
Solana Gains Support
One of the indicators showing promise for Solana’s recovery is its velocity, which measures the pace at which tokens are being circulated. The velocity has reached a monthly high, signaling that the transaction of supply is accelerating.
Amidst recovering price, there’s a noticeable increase in the velocity at which tokens are being transacted, highlighting greater demand. Velocity and price tend to move in tandem. Typically, when both price and velocity rise together, it’s considered a bullish signal — a trend currently seen with Solana.

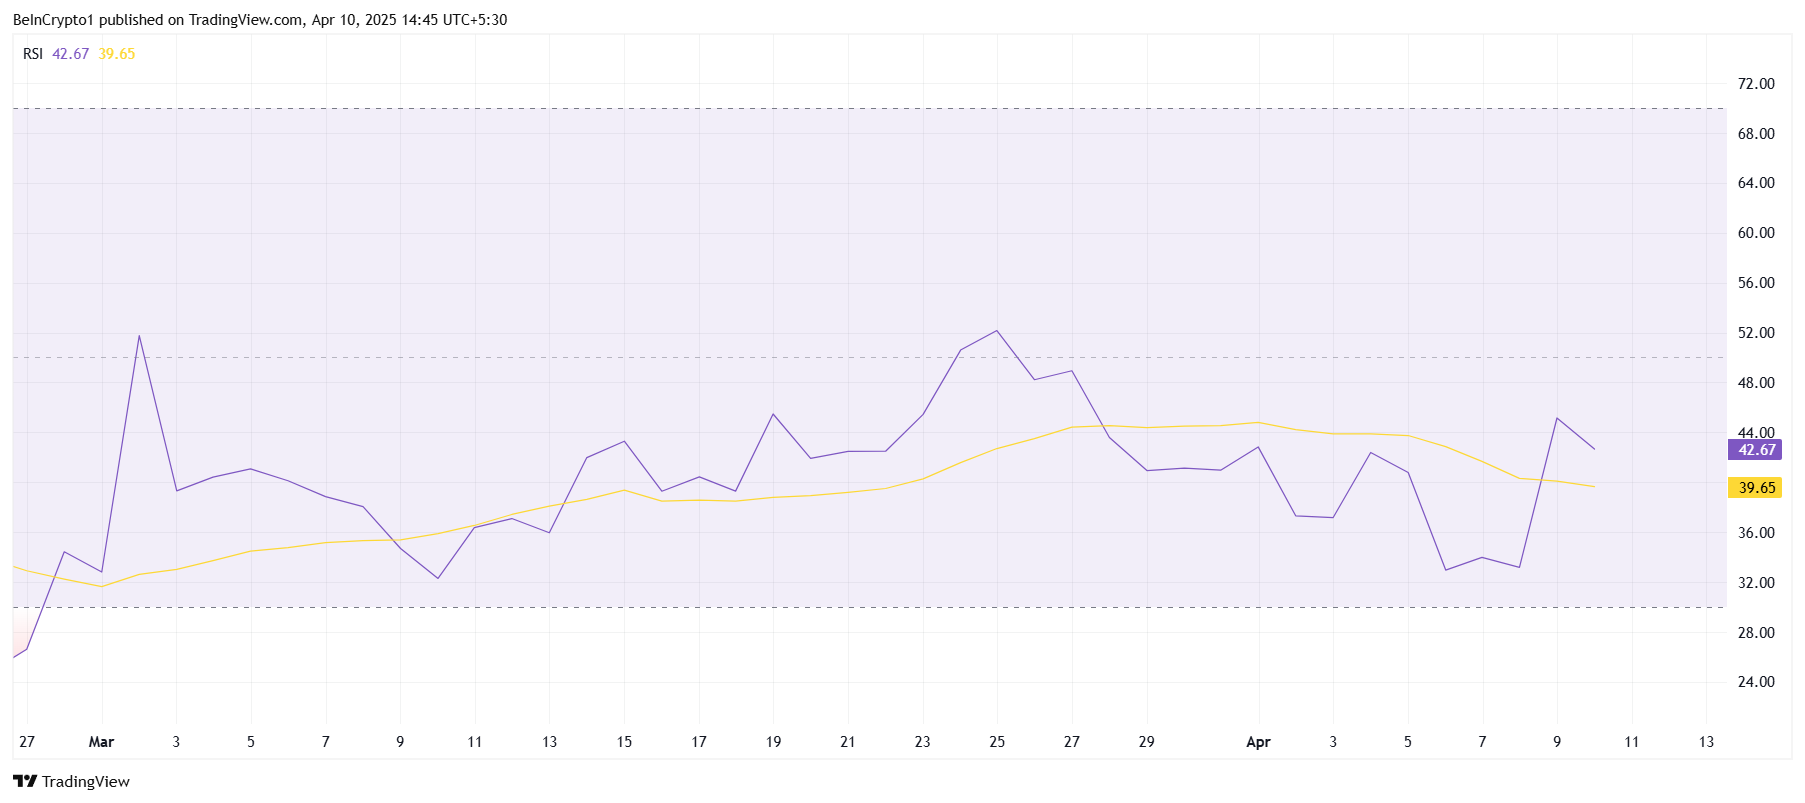
However, despite the favorable signs from the velocity, Solana’s macro momentum remains relatively weak. The Relative Strength Index (RSI) is still stuck in the bearish zone, under the neutral 50.0 mark.
While the broader market has seen some rallies, Solana’s RSI indicates a lack of significant buying momentum. This suggests that while some positive movement is occurring, broader macroeconomic factors may still be playing a limiting role.
The persistent bearish sentiment reflected in the RSI implies that Solana’s recovery may face continued challenges. Despite occasional price bounces, the altcoin has not yet experienced enough momentum to break free from the bearish pressure.
SOL Price Attempts Recovery
Solana’s price has risen by 8.2% in the past 24 hours, trading at $114. While it is showing signs of recovery, the altcoin remains under the key psychological price of $120. Beyond it lies a crucial resistance of $123, which has proven challenging in recent days.
If the bullish momentum continues, Solana could rise past $120 and aim for $123. Securing it as support would likely lead to further gains, pushing Solana toward the $135 mark. Investor confidence and continued supply distribution could support this upward movement.
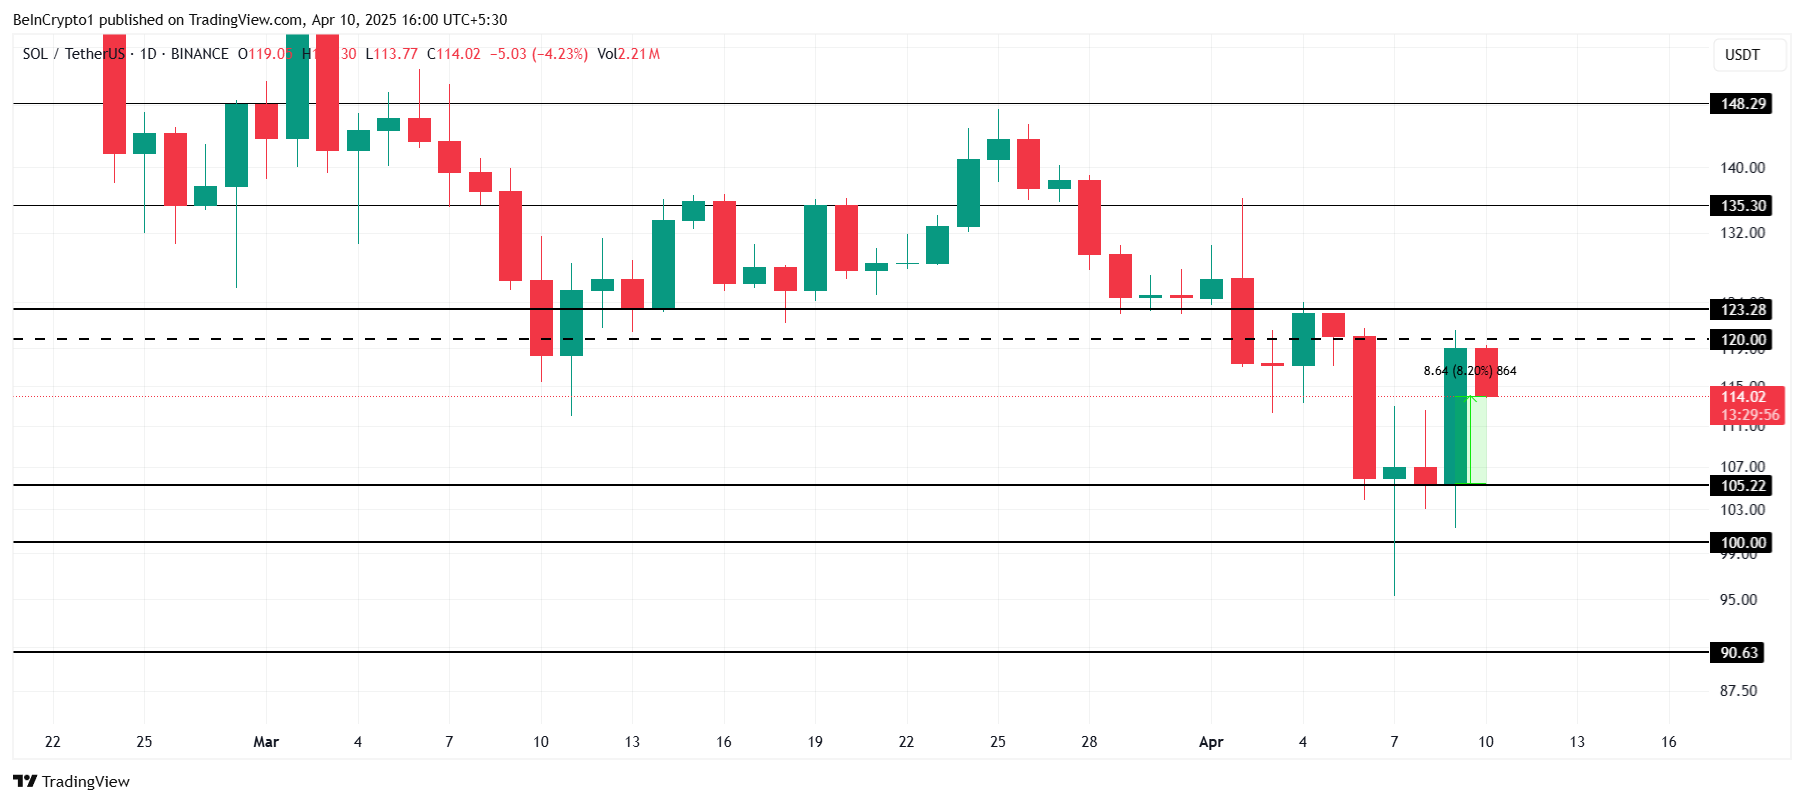
However, if Solana fails to breach the $123 resistance, the price may retreat toward $105 or even lower. A drop below $105 could signal a deeper decline, with the altcoin potentially heading toward the $100 mark. This would invalidate the recent bullish outlook, extending the correction phase for Solana.
Disclaimer
In line with the Trust Project guidelines, this price analysis article is for informational purposes only and should not be considered financial or investment advice. BeInCrypto is committed to accurate, unbiased reporting, but market conditions are subject to change without notice. Always conduct your own research and consult with a professional before making any financial decisions. Please note that our Terms and Conditions, Privacy Policy, and Disclaimers have been updated.

Aayush Jindal, a luminary in the world of financial markets, whose expertise spans over 15 illustrious years in the realms of Forex and cryptocurrency trading. Renowned for his unparalleled proficiency in providing technical analysis, Aayush is a trusted advisor and senior market expert to investors worldwide, guiding them through the intricate landscapes of modern finance with his keen insights and astute chart analysis.
From a young age, Aayush exhibited a natural aptitude for deciphering complex systems and unraveling patterns. Fueled by an insatiable curiosity for understanding market dynamics, he embarked on a journey that would lead him to become one of the foremost authorities in the fields of Forex and crypto trading. With a meticulous eye for detail and an unwavering commitment to excellence, Aayush honed his craft over the years, mastering the art of technical analysis and chart interpretation.
As a software engineer, Aayush harnesses the power of technology to optimize trading strategies and develop innovative solutions for navigating the volatile waters of financial markets. His background in software engineering has equipped him with a unique skill set, enabling him to leverage cutting-edge tools and algorithms to gain a competitive edge in an ever-evolving landscape.
In addition to his roles in finance and technology, Aayush serves as the director of a prestigious IT company, where he spearheads initiatives aimed at driving digital innovation and transformation. Under his visionary leadership, the company has flourished, cementing its position as a leader in the tech industry and paving the way for groundbreaking advancements in software development and IT solutions.
Despite his demanding professional commitments, Aayush is a firm believer in the importance of work-life balance. An avid traveler and adventurer, he finds solace in exploring new destinations, immersing himself in different cultures, and forging lasting memories along the way. Whether he’s trekking through the Himalayas, diving in the azure waters of the Maldives, or experiencing the vibrant energy of bustling metropolises, Aayush embraces every opportunity to broaden his horizons and create unforgettable experiences.
Aayush’s journey to success is marked by a relentless pursuit of excellence and a steadfast commitment to continuous learning and growth. His academic achievements are a testament to his dedication and passion for excellence, having completed his software engineering with honors and excelling in every department.
At his core, Aayush is driven by a profound passion for analyzing markets and uncovering profitable opportunities amidst volatility. Whether he’s poring over price charts, identifying key support and resistance levels, or providing insightful analysis to his clients and followers, Aayush’s unwavering dedication to his craft sets him apart as a true industry leader and a beacon of inspiration to aspiring traders around the globe.
In a world where uncertainty reigns supreme, Aayush Jindal stands as a guiding light, illuminating the path to financial success with his unparalleled expertise, unwavering integrity, and boundless enthusiasm for the markets.

Florida Bitcoin Reserve Bill Passes House With Zero Votes Against

Cash App’s Block Inc Settles for $40 Million Over AML Failures For Crypto Platform

Trump’s Surprise Move Sends ETH Up 15%

Ethereum’s Controversial Developer Freed Before Full Sentence

Solana Price Attempts Recovery, Nears $120, But Needs A Push

XRP Price Eyes $2.0 Breakout—Can It Hold and Ignite a Bullish Surge?

2.52 Million Altcoins Are Ruining Crypto’s Future

Animoca Brands Valuation Tanks 75% In Two Years, Here’s Why

Crypto exchange BingX hacked for $43 million

Are The Big Players Losing Interest?

Hong Kong’s Securities Association Tips Authorities On Crypto Self-Regulation

Coinbase cbBTC Set to go Live on Solana
2.52 Million Altcoins Are Ruining Crypto’s Future
Animoca Brands Valuation Tanks 75% In Two Years, Here’s Why
Crypto exchange BingX hacked for $43 million
Are The Big Players Losing Interest?
Hong Kong’s Securities Association Tips Authorities On Crypto Self-Regulation
Coinbase cbBTC Set to go Live on Solana
-
 Bitcoin17 hours ago
MicroStrategy Bitcoin Dump Rumors Circulate After SEC Filing
-
 Market17 hours ago
XRP Primed for a Comeback as Key Technical Signal Hints at Explosive Move
-

 Altcoin21 hours ago
NFT Drama Ends For Shaquille O’Neal With Hefty $11 Million Settlement
-
 Altcoin20 hours ago
Is Dogecoin Price Levels About To Bounce Back?
-

 Market19 hours ago
FBI Ran Dark Web Money Laundering to Track Crypto Criminals
-

 Market13 hours ago
Bitcoin Rallies After Trump Pauses Tariff—Crypto Markets Cheer the Move
-

 Market18 hours ago
SEC Approves Ethereum ETF Options Trading After Delays
-
 Altcoin22 hours ago
Ethereum Price Signals Strong Recovery After Forming Historical Pattern From 2020