
Market
XRP Price Eyes 20% Move With Golden Pocket Appearance

Reason to trust
![]()
Strict editorial policy that focuses on accuracy, relevance, and impartiality
Created by industry experts and meticulously reviewed
The highest standards in reporting and publishing
Strict editorial policy that focuses on accuracy, relevance, and impartiality
Morbi pretium leo et nisl aliquam mollis. Quisque arcu lorem, ultricies quis pellentesque nec, ullamcorper eu odio.
The XRP price is gearing up for another bullish move upward, as a crypto analyst has predicted a 20% surge in the near future. This optimistic forecast is backed by the formation of a key technical pattern called the Golden Pocket and indicators including strong support levels and a critical resistance zone.
Golden Pocket Signals XRP Price Surge
According to TradingView analyst TehThomas, the XRP price is currently trading within a well-defined Ascending Channel, setting the stage for a potential 20% move upwards. In the 4-hour time frame, XRP has continued to respect this Ascending Channel, forming higher highs and higher lows — a key indicator of a sustained uptrend.
Related Reading
Interestingly, the most notable development in XRP’s price action is the appearance of a Golden Pocket on its chart. A Golden Pocket is a key Fibonacci retracement area that is often used to identify potential support and resistance levels. It represents a complete trend reversal for a cryptocurrency and a possibility of an aggressive uptrend.
The TradingView analyst has revealed that XRP’s current Golden Pocket aligns with an imbalance zone, an area of unfilled liquidity where prices typically revisit before resuming movement.
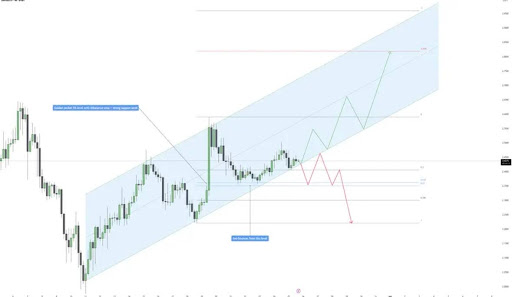
In the chart, XRP’s Golden Pocket sits between the 0.618 – 0.65 Fibonacci retracement level — a well-known area where the price usually finds strong support before continuing the trend. Historically, XRP has reacted twice from this key level, indicating that buyers have been actively defending this area.
TehThomas has predicted that as long as the XRP price can hold above the key Fibonacci retracement level, which also acts as a critical resistance, the cryptocurrency’s bullish structure will remain unchanged. Additionally, XRP could be primed for a massive rally toward the 0.618 Fibonacci extension level, which corresponds with the upper boundary of the Ascending Channel.
If this bullish momentum continues, it means that the analyst expects the XRP price to see a rally to a target between the $2.8 to – $2.9 range. This represents a 29% price increase from XRP’s current price of $2.2.
Short-Term Resistance Could Trigger Decline
TehThomas’s bullish outlook for the XRP price, the TradingView analyst noted that the 1-hour time frame presents short-term resistance, which could lead to a significant pullback before the next leg up. XRP recently faced a rejection at the imbalance zone, indicating that sellers are increasing activity at this level.
Related Reading
Previously, when the price struggled to break the imbalance zone, it highlighted a lack of liquidity to sustain a continued uptrend. A repeat of this could result in a retracement toward the Golden Pocket in the 4-hour timeframe.
Notably, a confirmed breakout from the 1-hour imbalance timeframe could reinforce XRP’s bullish momentum, supporting its projected move toward upper levels of the Ascending Channel. However, a failure could shift this bullish structure, leading to a deeper correction toward lower support levels.
Featured image from iStock, chart from Tradingview.com


Aayush Jindal, a luminary in the world of financial markets, whose expertise spans over 15 illustrious years in the realms of Forex and cryptocurrency trading. Renowned for his unparalleled proficiency in providing technical analysis, Aayush is a trusted advisor and senior market expert to investors worldwide, guiding them through the intricate landscapes of modern finance with his keen insights and astute chart analysis.
From a young age, Aayush exhibited a natural aptitude for deciphering complex systems and unraveling patterns. Fueled by an insatiable curiosity for understanding market dynamics, he embarked on a journey that would lead him to become one of the foremost authorities in the fields of Forex and crypto trading. With a meticulous eye for detail and an unwavering commitment to excellence, Aayush honed his craft over the years, mastering the art of technical analysis and chart interpretation.
As a software engineer, Aayush harnesses the power of technology to optimize trading strategies and develop innovative solutions for navigating the volatile waters of financial markets. His background in software engineering has equipped him with a unique skill set, enabling him to leverage cutting-edge tools and algorithms to gain a competitive edge in an ever-evolving landscape.
In addition to his roles in finance and technology, Aayush serves as the director of a prestigious IT company, where he spearheads initiatives aimed at driving digital innovation and transformation. Under his visionary leadership, the company has flourished, cementing its position as a leader in the tech industry and paving the way for groundbreaking advancements in software development and IT solutions.
Despite his demanding professional commitments, Aayush is a firm believer in the importance of work-life balance. An avid traveler and adventurer, he finds solace in exploring new destinations, immersing himself in different cultures, and forging lasting memories along the way. Whether he’s trekking through the Himalayas, diving in the azure waters of the Maldives, or experiencing the vibrant energy of bustling metropolises, Aayush embraces every opportunity to broaden his horizons and create unforgettable experiences.
Aayush’s journey to success is marked by a relentless pursuit of excellence and a steadfast commitment to continuous learning and growth. His academic achievements are a testament to his dedication and passion for excellence, having completed his software engineering with honors and excelling in every department.
At his core, Aayush is driven by a profound passion for analyzing markets and uncovering profitable opportunities amidst volatility. Whether he’s poring over price charts, identifying key support and resistance levels, or providing insightful analysis to his clients and followers, Aayush’s unwavering dedication to his craft sets him apart as a true industry leader and a beacon of inspiration to aspiring traders around the globe.
In a world where uncertainty reigns supreme, Aayush Jindal stands as a guiding light, illuminating the path to financial success with his unparalleled expertise, unwavering integrity, and boundless enthusiasm for the markets.

Reason to trust
![]()
Strict editorial policy that focuses on accuracy, relevance, and impartiality
Created by industry experts and meticulously reviewed
The highest standards in reporting and publishing
Strict editorial policy that focuses on accuracy, relevance, and impartiality
Morbi pretium leo et nisl aliquam mollis. Quisque arcu lorem, ultricies quis pellentesque nec, ullamcorper eu odio.
Ethereum price failed to recover above $1,700 and dropped below $1,550. ETH is now correcting losses and might face resistance near the $1,620 zone.
- Ethereum failed to stay above the $1,620 and $1,550 levels.
- The price is trading below $1,620 and the 100-hourly Simple Moving Average.
- There is a connecting bearish trend line forming with resistance at $1,615 on the hourly chart of ETH/USD (data feed via Kraken).
- The pair remains at risk of more losses if it fails to clear the $1,620 resistance zone.
Ethereum Price Recovery Faces Resistance
Ethereum price failed to stay above the $1,700 support zone and extended losses, like Bitcoin. ETH declined heavily below the $1,650 and $1,620 levels.
The bears even pushed the price below the $1,550 level. A low was formed at $1,410 and the price recently corrected some losses. There was a move above the $1,550 level. The price climbed above the 23.6% Fib retracement level of the downward move from the $1,815 swing high to the $1,410 low.
However, the bears are active near the $1,620 zone. Ethereum price is now trading below $1,620 and the 100-hourly Simple Moving Average. On the upside, the price seems to be facing hurdles near the $1,615 level.
There is also a connecting bearish trend line forming with resistance at $1,615 on the hourly chart of ETH/USD. It is close to the 50% Fib retracement level of the downward move from the $1,815 swing high to the $1,410 low. The next key resistance is near the $1,660 level.

The first major resistance is near the $1,720 level. A clear move above the $1,720 resistance might send the price toward the $1,820 resistance. An upside break above the $1,820 resistance might call for more gains in the coming sessions. In the stated case, Ether could rise toward the $1,880 resistance zone or even $1,920 in the near term.
Another Decline In ETH?
If Ethereum fails to clear the $1,620 resistance, it could start another decline. Initial support on the downside is near the $1,540 level. The first major support sits near the $1,505 zone.
A clear move below the $1,505 support might push the price toward the $1,420 support. Any more losses might send the price toward the $1,380 support level in the near term. The next key support sits at $1,320.
Technical Indicators
Hourly MACD – The MACD for ETH/USD is losing momentum in the bullish zone.
Hourly RSI – The RSI for ETH/USD is now above the 50 zone.
Major Support Level – $1,540
Major Resistance Level – $1,620

Hedera (HBAR) price rebounded over 10% in the last 24 hours, as some technical indicators are beginning to flash early signs of a potential recovery. The BBTrend has flipped positive after a full week in the red, hinting at a possible momentum shift. However, the Ichimoku Cloud still shows a firmly bearish setup, and EMA lines continue to favor downside risk. Whether HBAR can reclaim lost ground or continue sliding toward multi-month lows will depend on how these conflicting signals resolve in the coming days.
Hedera BBTrend Is Positive After Seven Days
Hedera’s BBTrend indicator has turned positive, currently sitting at 3.96 after spending the past seven days in negative territory and hitting a low of -17.12 on April 1.
The BBTrend (Bollinger Band Trend) is a momentum-based indicator used to assess the strength and direction of a trend relative to its position within the Bollinger Bands.
Readings above 0 suggest bullish momentum and potential upside movement, while readings below 0 indicate bearish pressure and downward momentum.
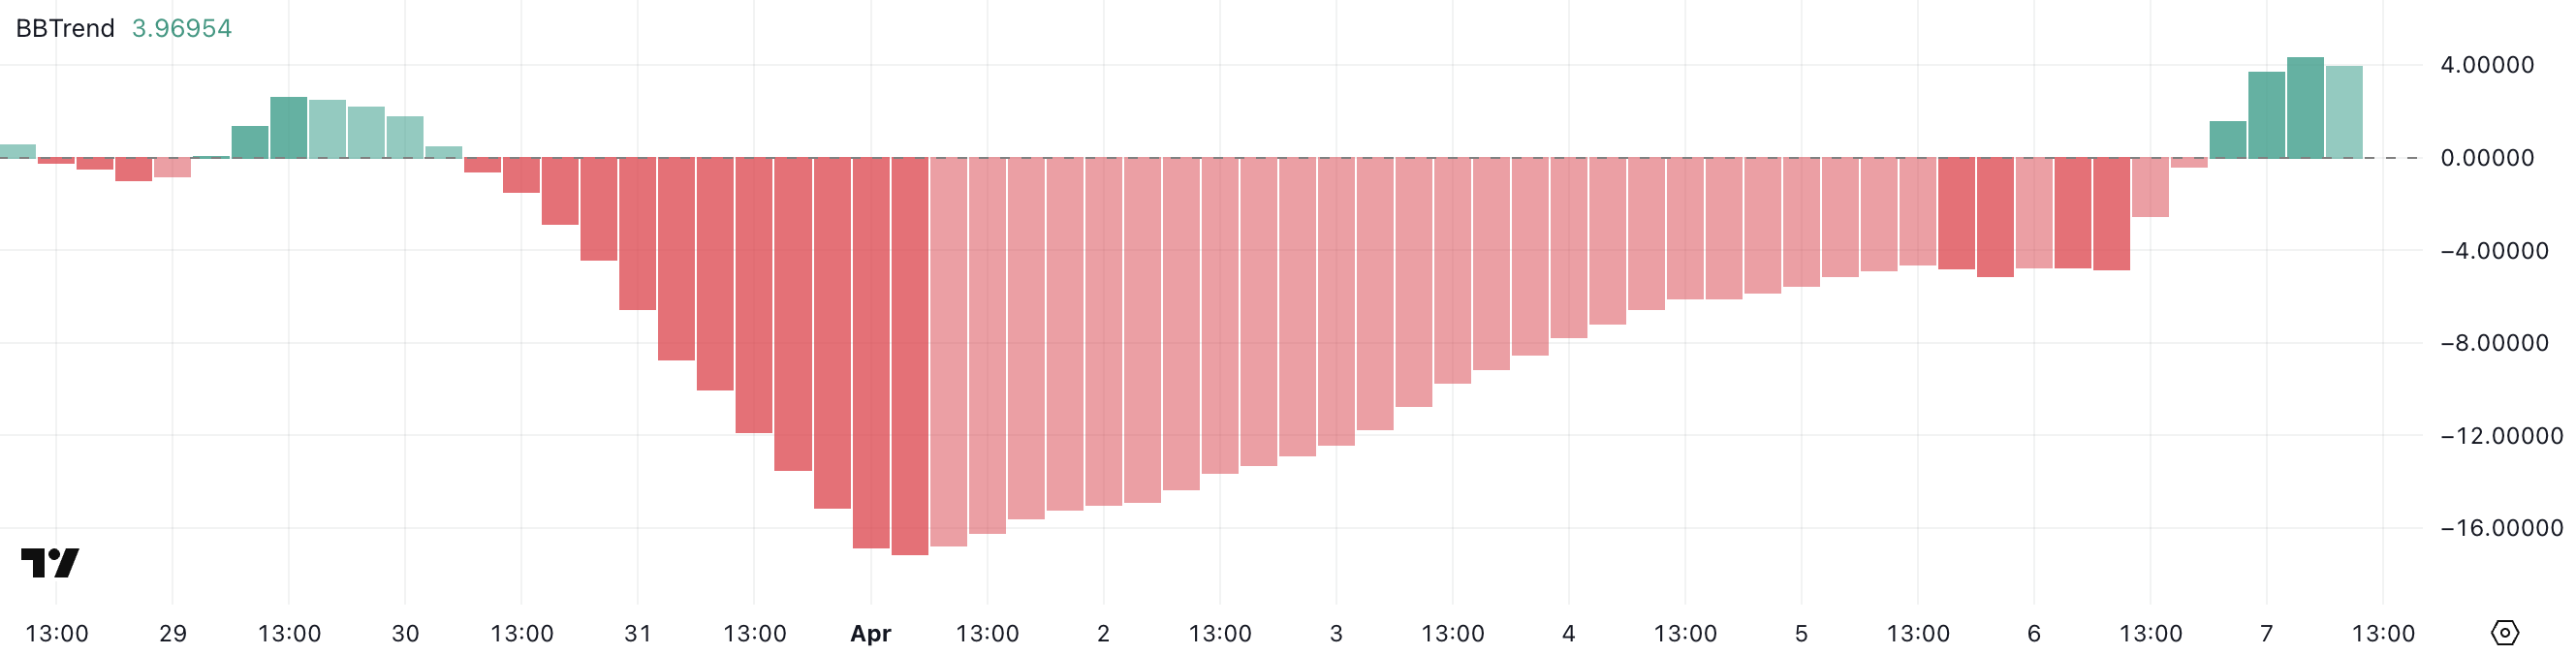
The current BBTrend value of 3.96 suggests that Hedera is showing early signs of a potential bullish reversal following a prolonged downtrend. The shift into positive territory could mean that buying pressure is returning and, if sustained, may support a price recovery.
However, given the recent volatility and overall weakness in the broader market, HBAR will need consistent follow-through above its mid-range levels to confirm this upward shift.
A failure to maintain a positive BBTrend could result in the continuation of sideways or downward movement.
HBAR Ichimoku Cloud Paints A Bearish Picture
The Ichimoku Cloud chart for Hedera currently displays a bearish structure. The price is positioned well below the Kumo (cloud), indicating that downward momentum remains dominant.
The Tenkan-sen (blue line) and Kijun-sen (red line) are both sloping downward and acting as immediate resistance levels, suggesting that sellers still have control over the trend.
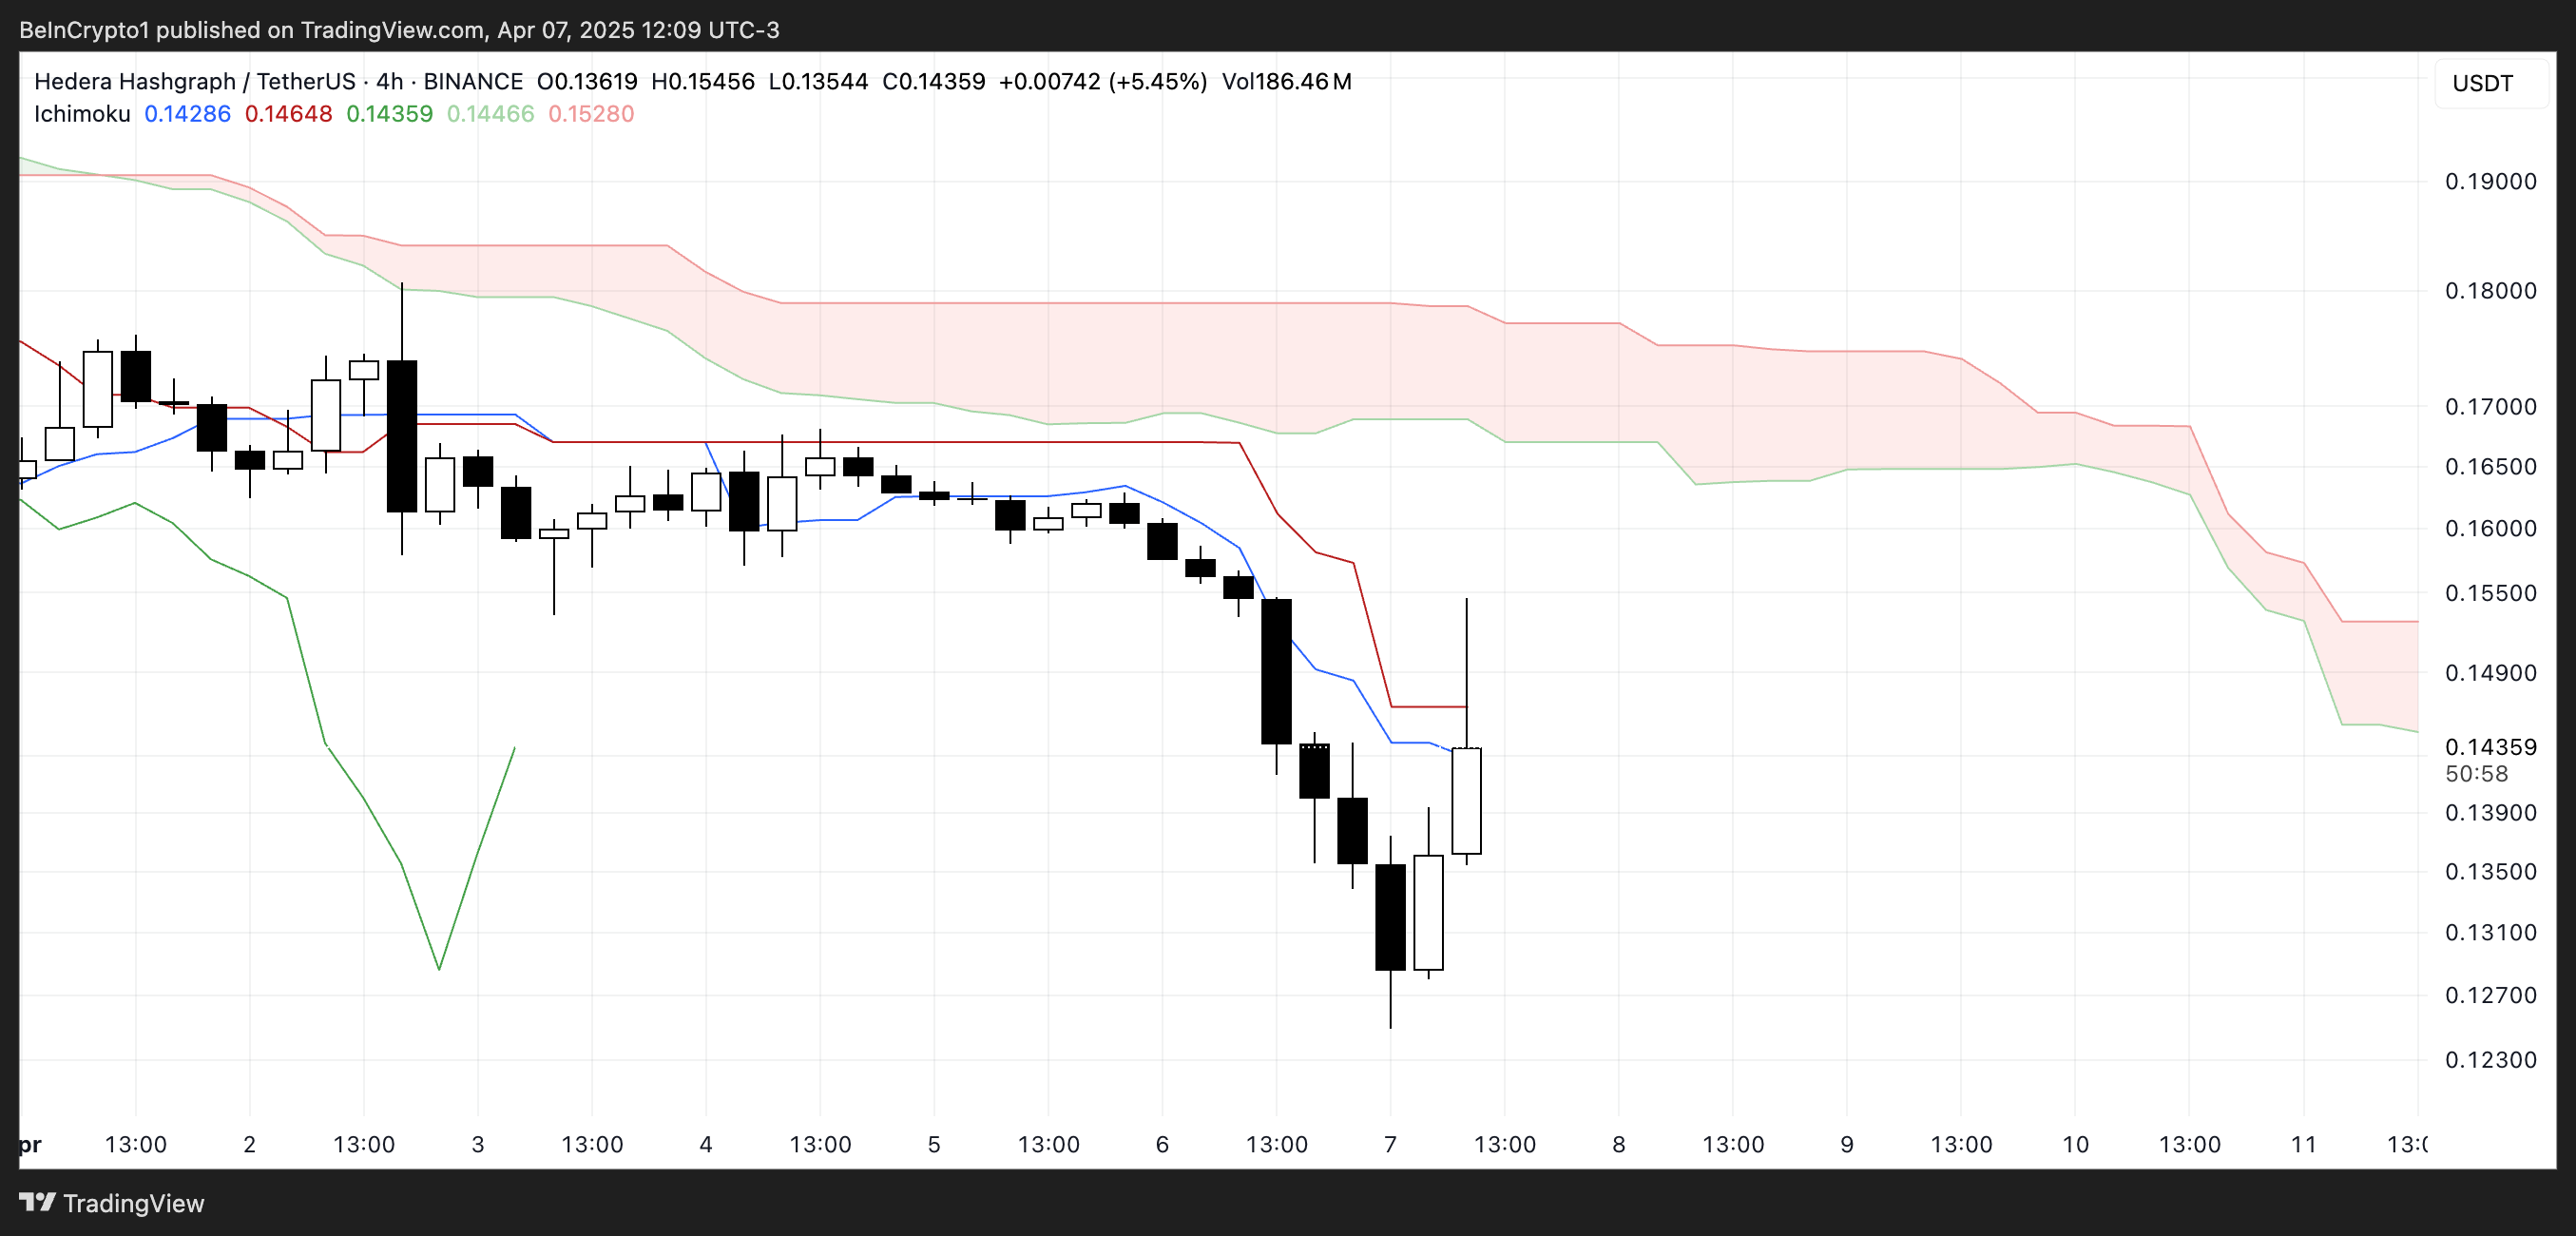
The cloud ahead is thick and red, reinforcing a bearish outlook and signaling that strong resistance lies above the current price action. However, a recent bullish candle pushing toward the Tenkan-sen suggests early signs of a possible relief rally.
For any meaningful trend reversal to occur, HBAR would need to break above both the Tenkan-sen and Kijun-sen, and eventually move into the cloud itself—a challenging task given the current setup.
Overall, the Ichimoku configuration confirms that while some short-term upside is possible, the broader trend remains firmly bearish for now.
Will Hedera Fall To 5-Month Lows?
Hedera’s EMA (Exponential Moving Average) lines continue to signal a bearish trend, with short-term averages positioned below the long-term ones—a classic indication of downward momentum.
As long as this alignment holds, HBAR remains vulnerable to further declines.
If selling pressure resumes, the token could fall to test support at $0.124. A breakdown below that level would mark the first move under $0.12 since November 2024.
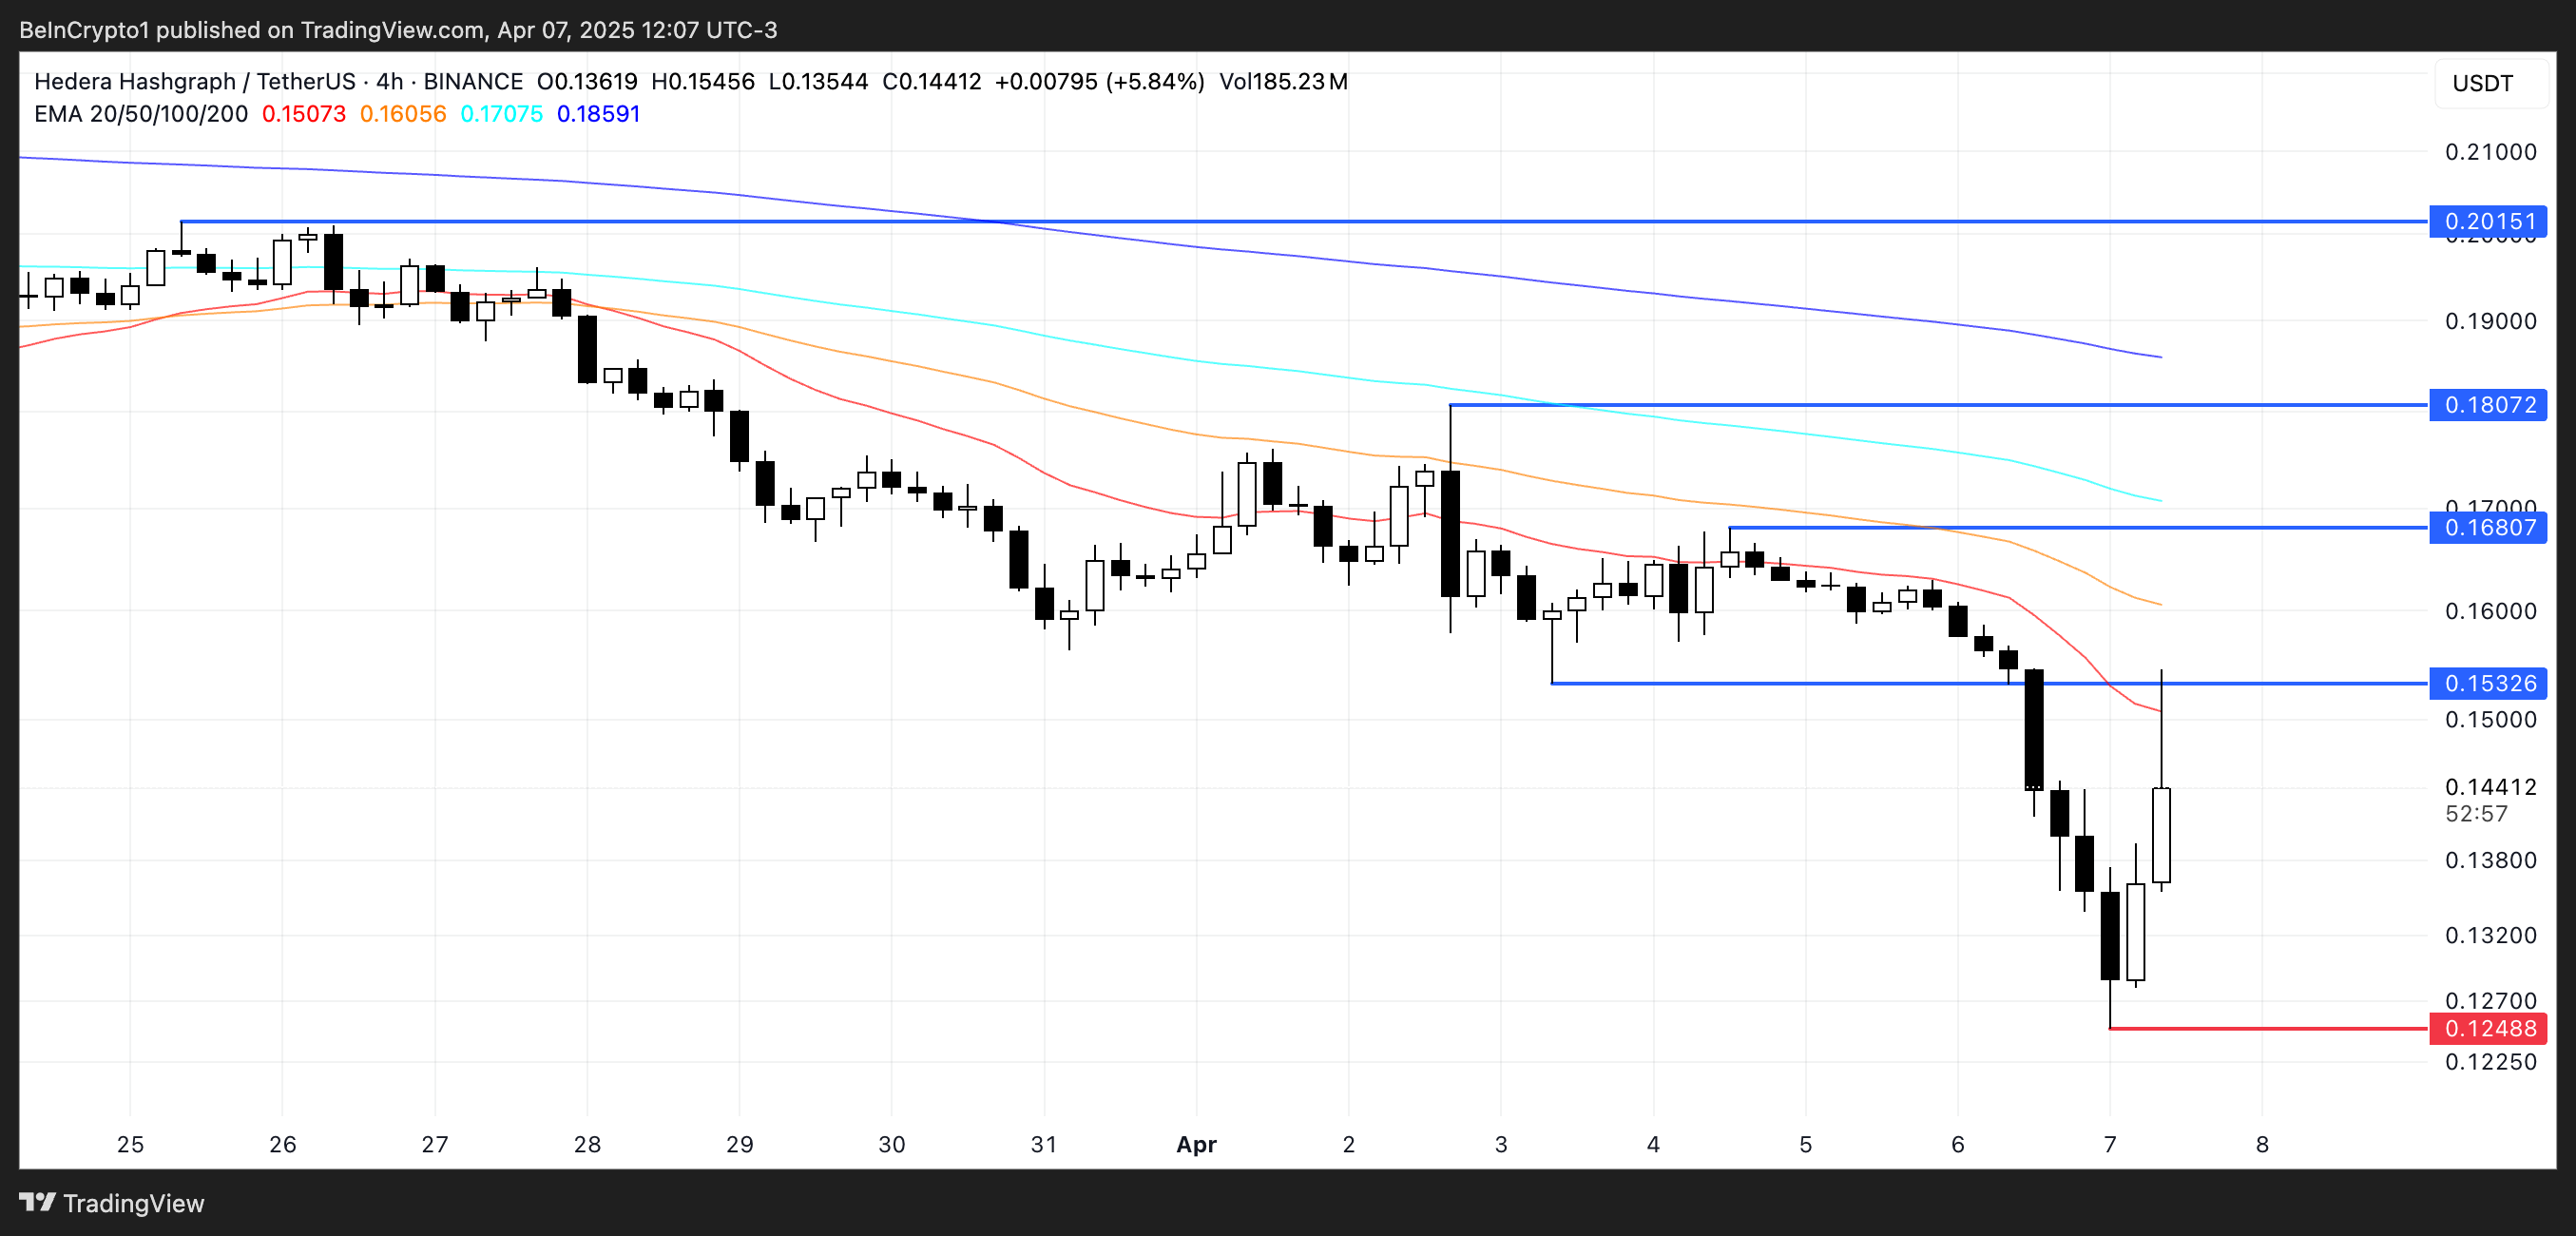
However, if Hedera price manages to reverse its current correction, a recovery could gain traction and push the price toward resistance at $0.155.
A breakout there could pave the way for further gains to $0.168, and if bullish momentum accelerates, HBAR could even attempt a move toward the $0.18 and $0.20 zones.
A crossover of the short-term EMAs above the long-term lines would be a key signal confirming a potential trend reversal.
Disclaimer
In line with the Trust Project guidelines, this price analysis article is for informational purposes only and should not be considered financial or investment advice. BeInCrypto is committed to accurate, unbiased reporting, but market conditions are subject to change without notice. Always conduct your own research and consult with a professional before making any financial decisions. Please note that our Terms and Conditions, Privacy Policy, and Disclaimers have been updated.

XRP Price Recovery Fades—$2 Remains A Tough Nut to Crack

Ethereum Price Rebound Stalls—Can It Reclaim the Lost Support?

Hedera (HBAR) Drops 8% as Market Signals Remain Mixed

RWA Tokenization Takes Center Stage in Hong Kong

Solana’s Fartcoin Jumps 20% Despite Market Selloff

RWA Tokens Outperform Bitcoin During Tariffs


-

 Market21 hours ago
Ethereum Price Tanks Hard—Can It Survive the $1,500 Test?
-

 Market19 hours ago
Bitcoin Price Crashes Hard—Is The Selloff Just Getting Started?
-

 Market14 hours ago
Is $0.415 the Key to Further Gains?
-
 Bitcoin22 hours ago
$1 Billion in Liquidations Over the Weekend
-
 Altcoin16 hours ago
Dogecoin Whale Dumps 300M Coins Amid Market Crash, Can DOGE Price Dip Below $0.1?
-

 Market22 hours ago
Solana (SOL) Price Falls Below $100, Crashes To 14-Month Low
-
 Bitcoin20 hours ago
Will 2025’s Crypto Market Mirror 2020’s Rebound? Analysts Predict
-

 Market20 hours ago
Will ADA Drop to $0.44?
 Arabic
 Chinese (Simplified)
 Dutch
Dutch English
 French
 German
 Italian
 Portuguese
 Russian
 Spanish
 Vietnamese