Market
XRP Price Explosion Above $3 Is A Matter Of When, Not If: Analyst Reveals Timeline
A crypto analyst has made a bold prediction about the XRP price, highlighting that an explosive rise above $3 is not a matter of if but when. While XRP’s slow price growth over the years has tested the patience of many investors, the analyst is confident that the cryptocurrency’s fundamentals and market dynamics are aligning for a significant upward movement.
Timeline For XRP Price Surge Above $3
Popular crypto analyst Javon Marks has expressed optimism about the future outlook of the XRP price, predicting that the prominent cryptocurrency could be on the verge of a significant rally above the $3 mark. In an X (formerly Twitter) post on Tuesday, Marks revealed that the recent XRP price action indicated a “massive bullish breakout” to the upside.
Related Reading
The analyst suggested that this upward momentum could happen very soon, implying that all the conditions and signs were pointing towards a substantial price shift for XRP in the future.
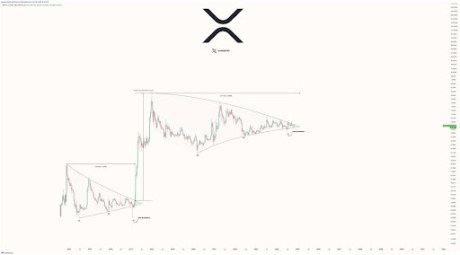
Sharing a detailed chart of XRP’s historical price movements, Marks noted that the cryptocurrency had formed a distinct triangle pattern, starting in 2014 and peaking in 2017. After breaking out of the triangle pattern in 2017, XRP experienced a dramatic price surge, reaching new highs before recording a short dip and then rallying again to its current all-time high of $3.84 in 2018.
Based on Mark’s price chart, XRP has formed another similar triangle pattern, which started around 2018 and is projected to peak in 2025. Marks pointed out that breaking out of this triangle pattern could trigger a massive increase in the XRP price, potentially pushing the cryptocurrency to new highs around $3.6 by 2025.
Price Remains Stagnant While Other Cryptocurrencies Rally
Despite the optimistic price projections for the XRP price, the cryptocurrency has been facing immense downward pressure for the past few months. While other cryptocurrencies like Bitcoin, Ethereum, and most meme coins have been experiencing significant price gains amidst the positive shift in market conditions, XRP price has struggled to build momentum.
Related Reading
Data from CoinMarketCap has revealed that XRP is currently trading at around $0.5, recording significant declines, much to the frustration of long-time XRP holders and investors. While Bitcoin has skyrocketed to $72,000, Ethereum to $2,670, and Shiba Inu to $0.0000188, XRP has declined by 0.37% in the last 24 hours and decreased by 18.61% over the past month.
Currently, XRP is being cited as one of the worst-performing assets in the crypto space, as its price has failed to break beyond the $1 mark since February 2022. This bearish price trend and slow momentum could be attributed to XRP’s bearish market sentiment and the ongoing legal battles between Ripple Labs and the United States Securities and Exchange Commission (SEC).
Featured image created with Dall.E, chart from Tradingview.com
Market
Pi Network Price Falls To Record New Low Amid Weak Inflows

Pi Network (PI) has experienced a significant downtrend recently, with price declines that have left many holders facing losses.
The altcoin has failed to break free from this negative momentum, and the market conditions continue to worsen. As a result, investors are losing confidence, and the price may continue to drop further.
Pi Network Continues To Suffer
The Chaikin Money Flow (CMF) continues to show bearish signs, remaining well below the zero line. This indicates that the network is suffering from outflows, meaning that investors are moving their funds out of Pi Network. Despite a bullish start, Pi failed to sustain interest, leading many holders to sell off their positions.
The outflow trend is concerning for investors, as the lack of positive momentum suggests a prolonged downtrend. The market sentiment remains bearish, with sellers outweighing buyers. As the CMF stays in the negative zone, it signals that Pi Network’s price could struggle to find stability in the short term.

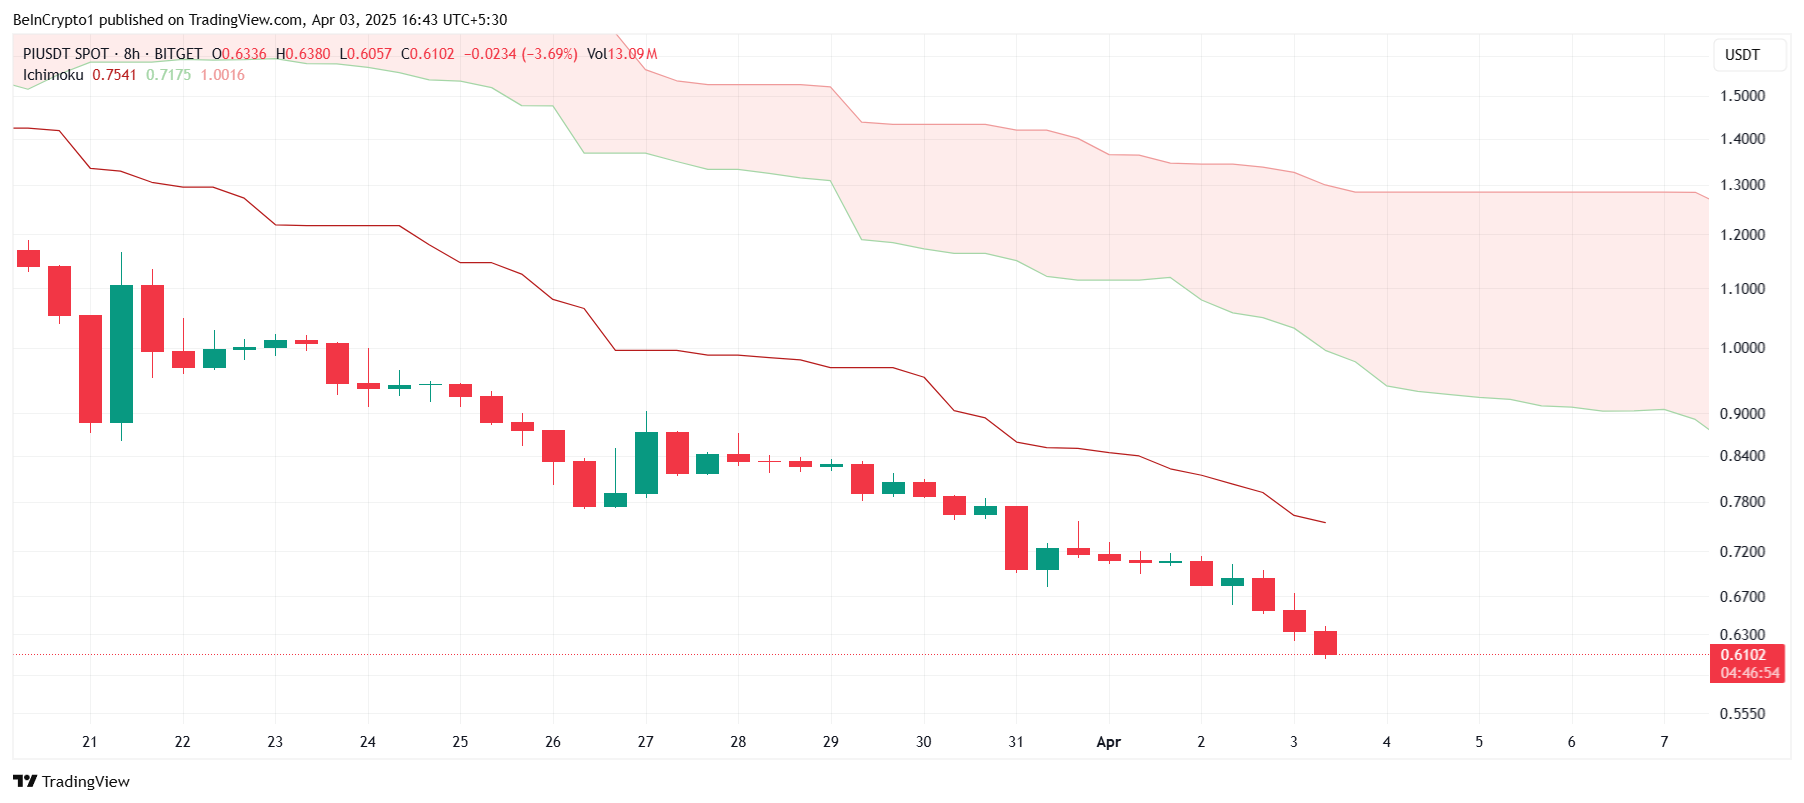
The Ichimoku Cloud, a widely used technical indicator, is hovering well above the candlesticks, signaling that the bearish trend is gaining strength. This indicates that there is little upward momentum in the market, and Pi Network is likely to face more downward pressure.
Additionally, broader market conditions are still negative, which suggests that Pi Network may fail to recover in the immediate future. With bearish technical indicators and a lack of support from investors, the outlook for Pi Network remains grim for now.
PI Price Hits A New Low
Pi Network is currently priced at $0.61, having formed a new all-time low of $0.60 after dropping by nearly 14% over the last 24 hours. The altcoin continues to struggle under the weight of negative sentiment and is not showing signs of reversal in the near term.
Based on the ongoing outflows and bearish technical indicators, Pi Network will likely continue its decline. It could fall further to $0.50, potentially forming new all-time lows. The current market conditions suggest that recovery is unlikely without a significant shift in sentiment.
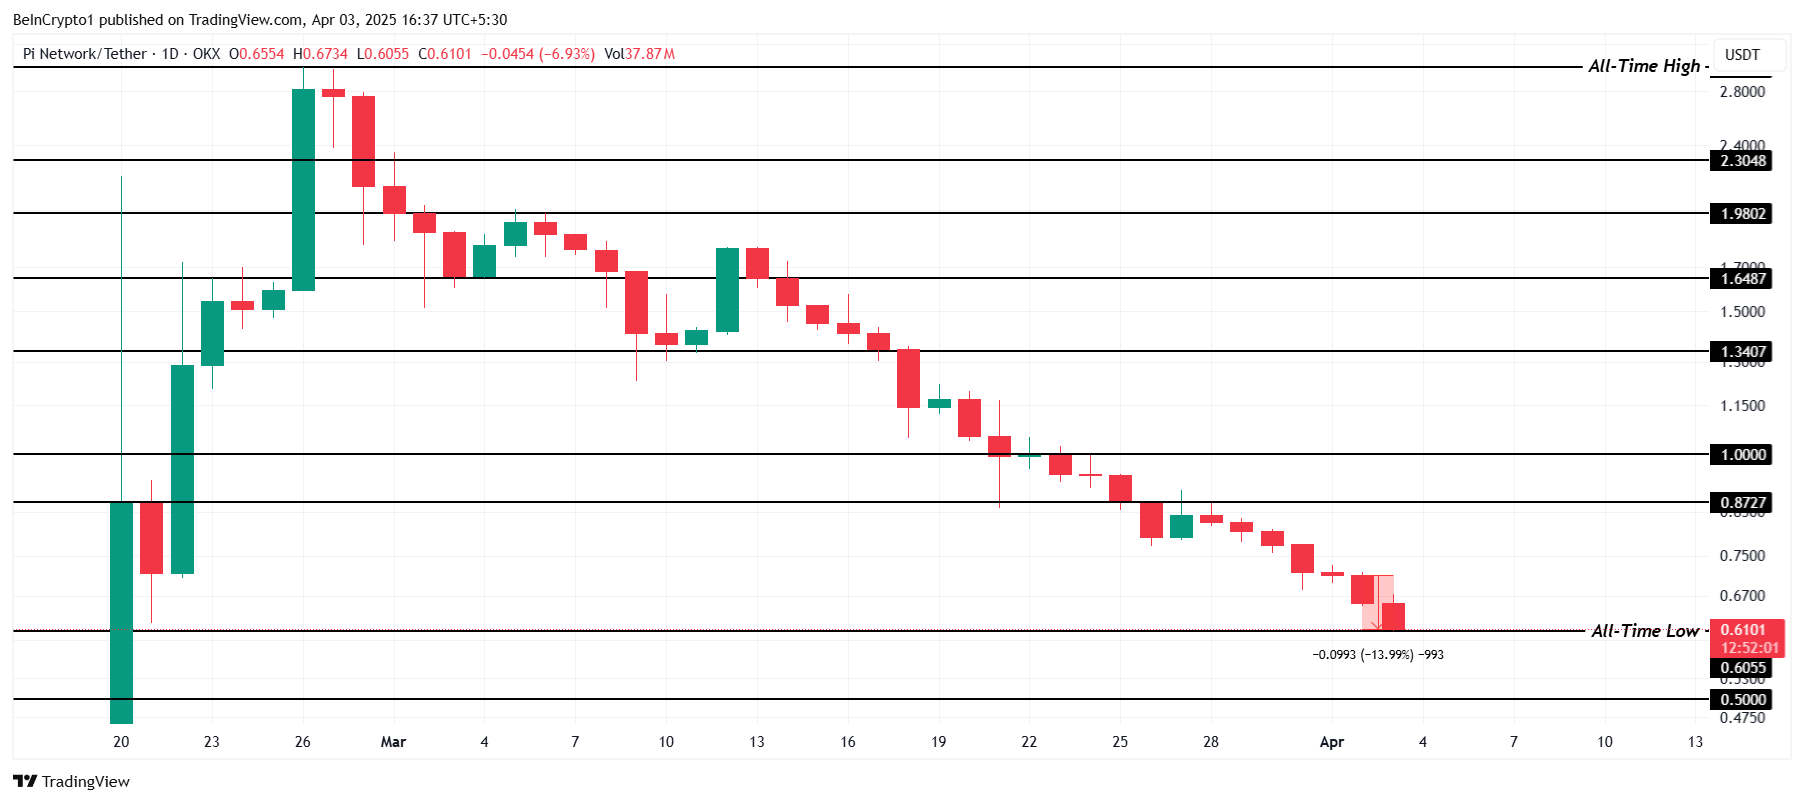
However, if Pi Network can bounce off the $0.60 level, it might regain some support and climb back to $0.87. This would help recover some of the recent losses and potentially give the altcoin another chance at a bullish move. But, without a strong catalyst, it may struggle to break through the resistance levels.
Disclaimer
In line with the Trust Project guidelines, this price analysis article is for informational purposes only and should not be considered financial or investment advice. BeInCrypto is committed to accurate, unbiased reporting, but market conditions are subject to change without notice. Always conduct your own research and consult with a professional before making any financial decisions. Please note that our Terms and Conditions, Privacy Policy, and Disclaimers have been updated.
Market
TRUMP Token Hits Record Low Due To Liberation Day Tariffs

TRUMP token has faced a significant downturn, failing to recover after a recent decline. The altcoin’s price has been further pressured by the announcement of US President Donald Trump’s Liberation Day Tariffs.
As a result, bearish sentiment has grown, leading traders to capitalize on the negative market conditions.
Trump’s Announcement Took A Toll
The funding rate for TRUMP turned negative over the last 24 hours, signaling increased bearish activity. Traders are shifting to short contracts, betting that the price will decline further. This shift in sentiment follows the announcement of the tariffs, which, despite being a policy move, had a negative impact on TRUMP’s price.
This negative market reaction highlights traders’ skepticism about the future prospects of TRUMP. While the tariff announcement was meant to stimulate market reactions, it instead spurred fear, driving a wave of sell-offs.

Looking at the broader momentum, technical indicators such as the Relative Strength Index (RSI) reveal that TRUMP is far from recovering its recent losses. The RSI remains firmly in the bearish zone, well below the neutral 50.0 mark. With no signs of reversal or bullish momentum, the token is likely to continue facing declines in the short term.
The oversold conditions are not yet reached either, indicating there is still room for further declines. With the RSI not showing any substantial recovery signals, the current downtrend could persist until market sentiment shifts or a new catalyst sparks renewed interest in the token.

TRUMP Price Suffers
TRUMP’s price hit a new all-time low of $8.97 before recovering slightly to $9.29. Over the last 24 hours, the token has seen a 10% decline. This drop has added to its month-long 45% slide, as the token lost crucial support levels, including $12.57 and $10.29.
The ongoing bearish trend suggests that TRUMP could continue to slide, with the next key support around $8.00. If the broader market conditions remain weak and the bearish sentiment continues to dominate, the price could dip further, reaching new lows before any potential recovery.
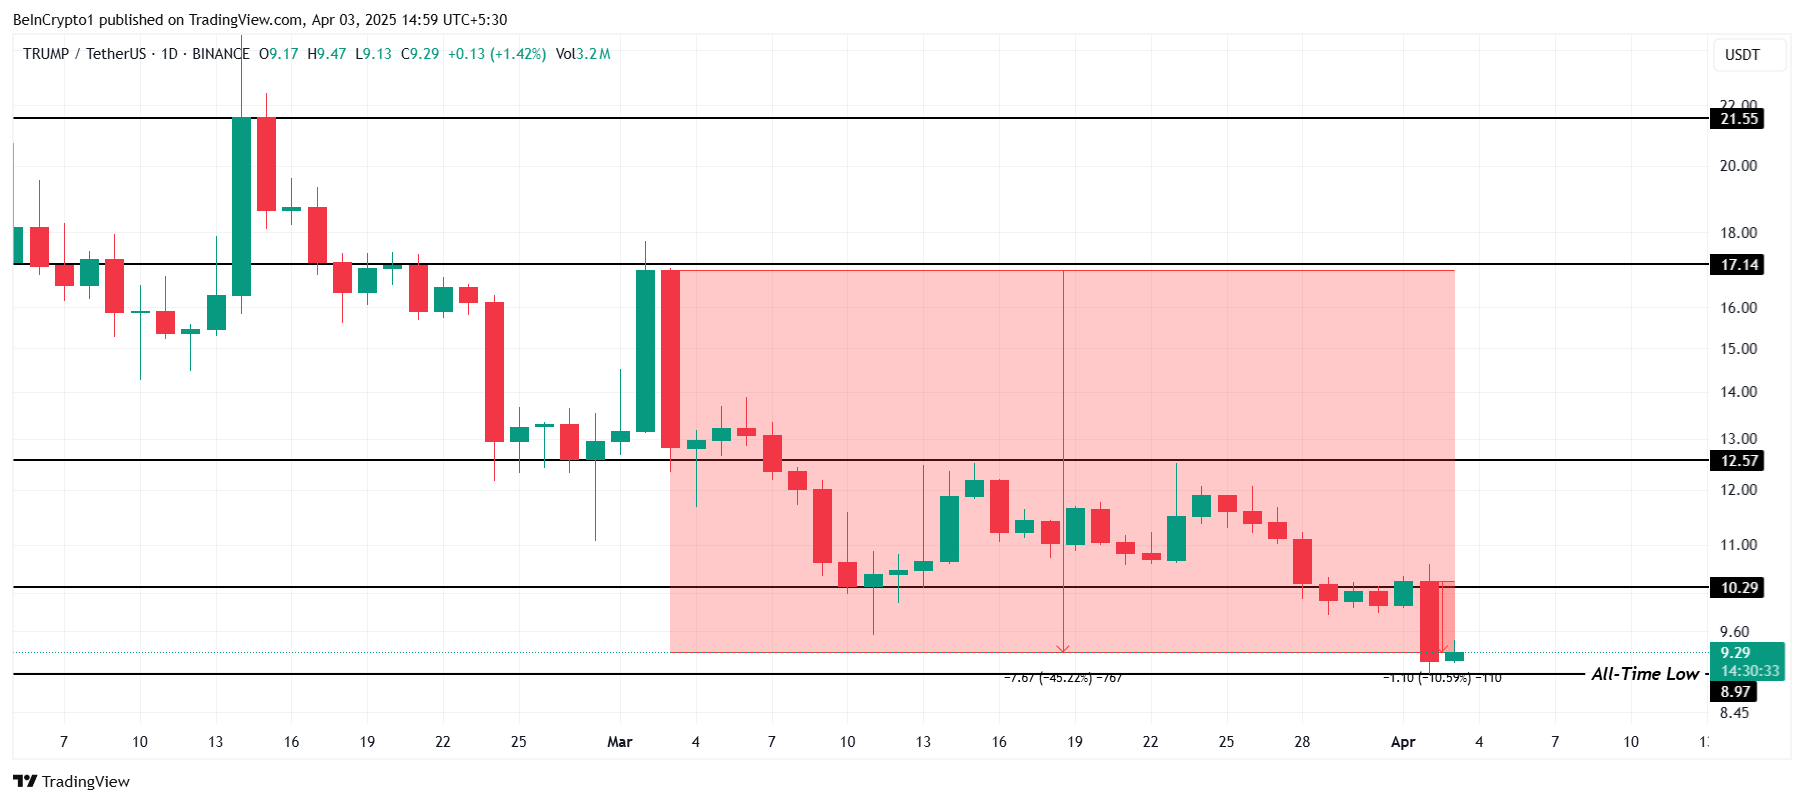
However, if TRUMP manages to reclaim $10.29 as support, it could mark the beginning of a recovery attempt. Successfully breaching $12.57 could invalidate the current bearish outlook and signal a potential rally, but this would require a significant shift in investor sentiment and market conditions.
Disclaimer
In line with the Trust Project guidelines, this price analysis article is for informational purposes only and should not be considered financial or investment advice. BeInCrypto is committed to accurate, unbiased reporting, but market conditions are subject to change without notice. Always conduct your own research and consult with a professional before making any financial decisions. Please note that our Terms and Conditions, Privacy Policy, and Disclaimers have been updated.
Market
Bitcoin’s Future After Trump Tariffs

Welcome to the US Morning Crypto Briefing—your essential rundown of the most important developments in crypto for the day ahead.
Grab a coffee to see how Bitcoin is holding its ground while Wall Street stumbles, why Trump’s tariffs may push the Fed into money-printing mode, and what that could mean for crypto’s next chapter. From Ethereum’s test of resilience to rising odds of a US recession, here’s everything you need to know to stay ahead.
Bitcoin Enters Its Risk-Dynamic Era Amid Tariffs and Turmoil
Bitcoin’s reaction to recent macro shocks—particularly Trump’s sweeping tariffs—has been noticeably calm compared to traditional markets, and that’s turning heads. While Wall Street stumbles harder than expected, crypto has held relatively steady.
Nexo Dispatch Editor Stella Zlatarev told BeInCrypto that this isn’t just resilience—it’s evidence that Bitcoin may be entering a new phase of market maturity.
“A 2–3% drop in crypto is a rounding error compared to past cycles,” she said, emphasizing that this stability amid chaos suggests Bitcoin is no longer just a speculative punt. “Bitcoin’s ability to weather macro turbulence without the wild swings of previous years suggests institutional investors are treating it less as a speculative punt and more as a strategic asset,” Zlatarev said.
Analysts also stressed that Bitcoin’s behavior doesn’t align with traditional asset categories.
“It’s not gold, and it’s not the yen. Instead, Bitcoin is emerging as a risk-dynamic asset – one that doesn’t crumble like high-growth stocks but also doesn’t attract the same flight-to-safety flows as traditional safe havens,” Zlatarev told BeInCrypto.
This concept of a “risk-dynamic” asset positions Bitcoin in a unique role: something that thrives in uncertainty but doesn’t collapse when the market turns.
Zlatarev from Nexo also noted that how Ethereum and other blue-chip altcoins respond next will be key.
“If ETH mirrors BTC’s performance, it strengthens the case that top-tier crypto assets are evolving into a more predictable asset class. If ETH wobbles, it reinforces that, for now, Bitcoin is in a league of its own.”
Meanwhile, the macro backdrop is shifting fast. Trump’s new “Liberation Day” tariffs have spooked global trade partners and have also sent ripple effects through prediction markets. Polymarket now gives almost 50% odds of a US recession this year—a major shift following the announcement.
Also, CME FedWatch tool shows interest rate traders have boosted the probability the US Federal Reserve will make four rate cuts this year. Eventually, this could relief the current macroeconomic pressure on Bitcoin.

Former BitMex CEO Arthur Hayes mentioned that Trump’s current tariff strategy could complicate the US bond market. In other words, pressure is building for the Fed to intervene—possibly by turning on the liquidity spigot once again.
All of this puts Bitcoin in a new spotlight. Its steadiness is no longer being dismissed as a coincidence. It may be the first sign that crypto, or at least its most mature players, is stepping out of the shadows of speculation and into the spotlight of strategic finance.
Chart of the Day

By reducing foreign demand for US Treasuries, Trump’s tariffs may force the Fed to inject more liquidity—potentially weakening the dollar and boosting Bitcoin as an alternative store of value.
Byte-Sized Alpha
– Trump’s “Liberation Day” enforces 10%+ tariffs on all imports, hitting China, the EU, and Israel, triggering market drops and recession fears.
– According to Standard Chartered, Bitcoin may hit $500,000 by Trump’s term end, AVAX could 10x by 2029, and Ethereum’s 2025 target drops to $4,000.
– The STABLE Act of 2025 advances with bipartisan support, aiming to tighten stablecoin rules as competition and regulatory pressure intensify.
– Bitcoin ETFs see $221 million in April inflows led by ARKB, but BTC derivatives cool with falling futures interest and bearish options sentiment.
– DXY hits a 2024 low after “Liberation Day” tariffs, fueling short-term Bitcoin surge hopes amid global tensions and policy uncertainty.
– Bitcoin struggles below $85,000 amid weak sentiment, but long-term holders stay firm, keeping capitulation fears at bay.
– Polymarket sees almost 50% chance of US recession as Trump’s tariffs spark market fears and trade tensions.
Disclaimer
In line with the Trust Project guidelines, this price analysis article is for informational purposes only and should not be considered financial or investment advice. BeInCrypto is committed to accurate, unbiased reporting, but market conditions are subject to change without notice. Always conduct your own research and consult with a professional before making any financial decisions. Please note that our Terms and Conditions, Privacy Policy, and Disclaimers have been updated.
-

 Altcoin23 hours ago
Here’s Why This Analyst Believes XRP Price Could Surge 44x
-

 Altcoin22 hours ago
How Will Elon Musk Leaving DOGE Impact Dogecoin Price?
-

 Ethereum21 hours ago
Why A Massive Drop To $1,400 Could Rock The Underperformer
-

 Ethereum23 hours ago
Whales Dump 760,000 Ethereum in Two Weeks — Is More Selling Ahead?
-

 Altcoin19 hours ago
First Digital Trust Denies Justin Sun’s Allegations, Claims Full Solvency
-

 Altcoin20 hours ago
Will Cardano Price Bounce Back to $0.70 or Crash to $0.60?
-

 Market12 hours ago
XRP Price Under Pressure—New Lows Signal More Trouble Ahead
-

 Altcoin12 hours ago
Analyst Forecasts 250% Dogecoin Price Rally If This Level Holds


