Market
Wintermute Sells ACT Tokens Due To Binance Limit Changes

Market maker Wintermute sold off huge quantities of ACT and other BNB meme coins on April 1, tanking their prices by as much as 50%. Wintermute CEO denied intentionally selling these assets and started re-buying them.
Community sleuths believe that Binance is to blame, quietly lowering the leverage position limit for ACT and other tokens. This incident may cause further mistrust and uncertainty in a shaky meme coin market.
Why Did Wintermute Sell ACT?
A chaotic incident is currently unfolding in the meme coin sector. At the center of the story is Wintermute, a market maker that recently made headlines by interacting with World Liberty’s USD1 stablecoin before the official announcement.
Today, Wintermute has sold off large quantities of BNB meme coins, especially ACT.
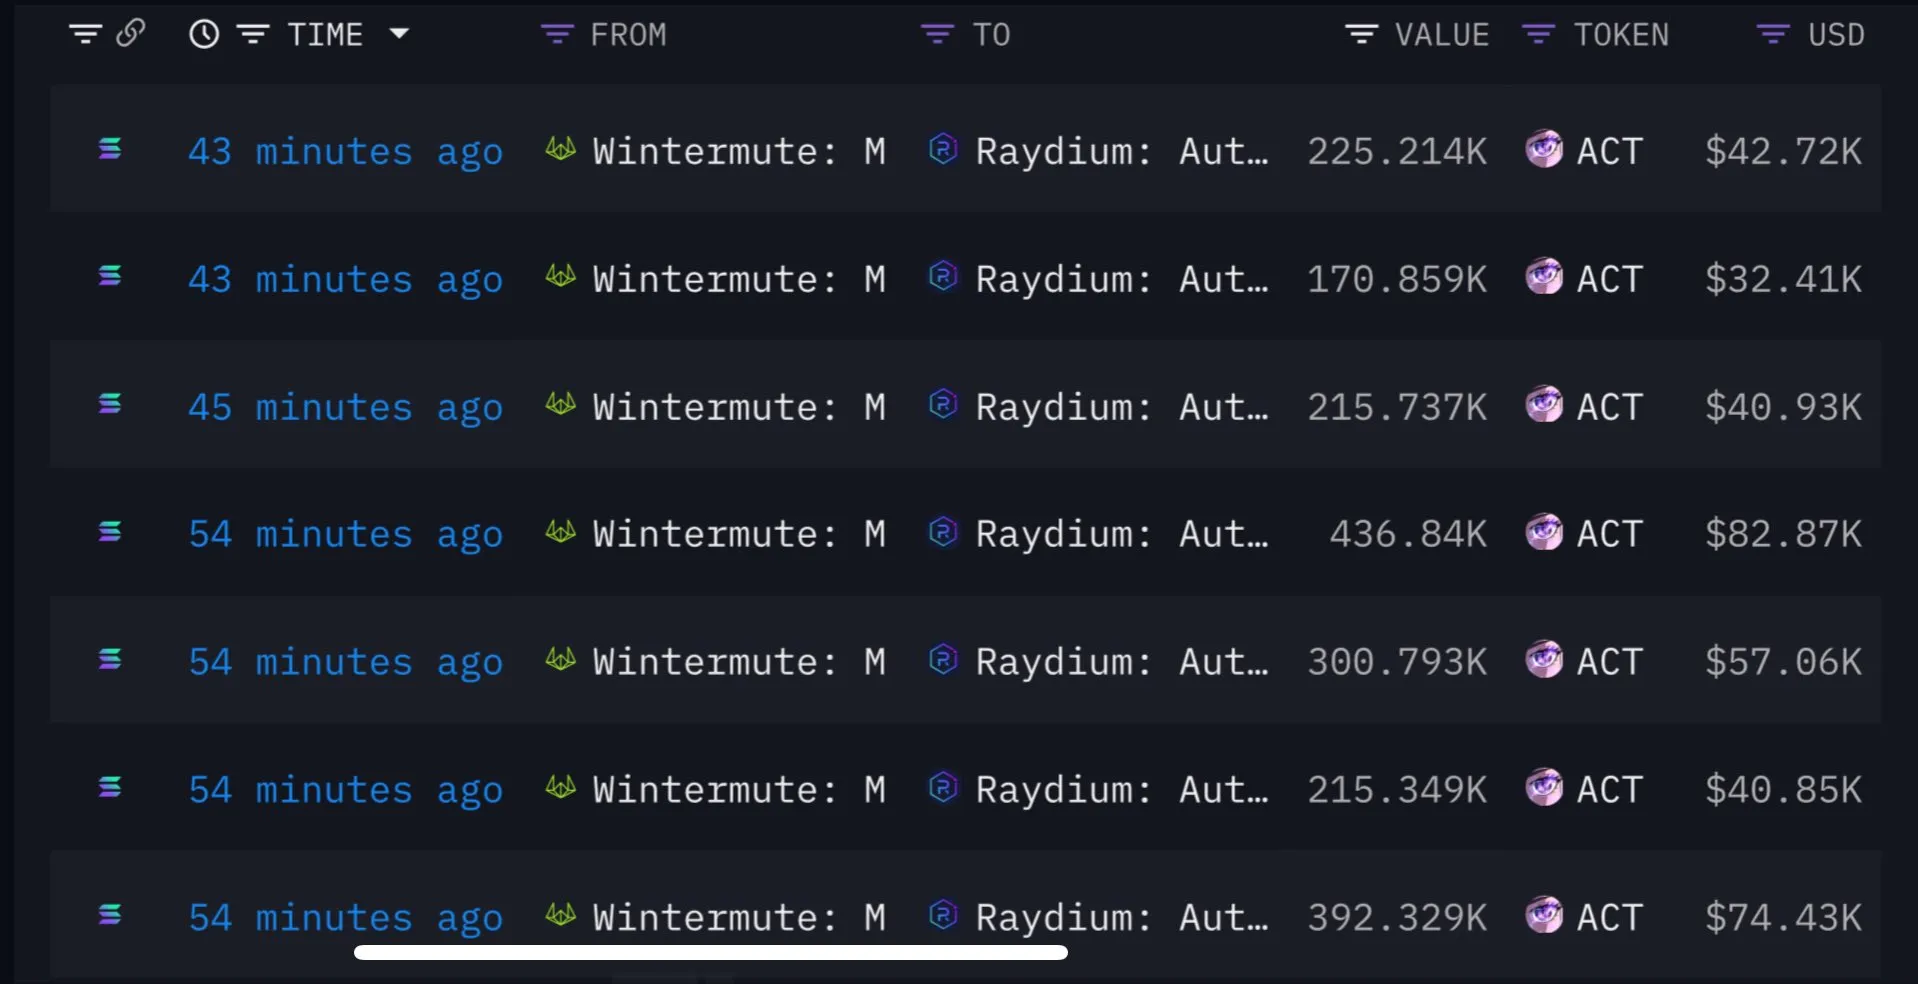
After Wintermute’s massive sell-off, the price of ACT subsequently fell 50%. This caused a stampede in other BNB meme coins, erasing millions of dollars and generating a lot of market chaos.
However, in a strange development, Wintermute’s CEO Evgeny Gaevoy denied deliberately causing the sale.
“Not us, for what it’s worth! [I’m] also curious about that postmortem. If I were to guess, we reacted post move, arbitraged the Automated Market Maker (AMM) Pool,” Gaevoy claimed in a social media thread.
This raised more questions than it answered. If Wintermute didn’t intend to sell off these ACT tokens and other meme coins, what triggered them? The firm even began buying ACT again after the sale. Subsequently, crypto sleuths started suspecting a quiet rule change from Binance, the world’s largest crypto exchange.
Both data from Lookonchain and analysis from 0xwizard, an important community leader for ACT, alleged that Binance was involved in the Wintermute debacle. Specifically, they claimed that the exchange quietly lowered the leverage position limit for ACT. This meant that market makers who held more positions than this limit were automatically liquidated at market price.
Naturally, these allegations caused a lot of outrage. Yi He, co-founder of Binance, responded, claiming that the relevant team is “collecting details and preparing a reply.” She further said that there might be another player involved but didn’t elaborate on this. This is not her first time responding to major criticism about Binance’s meme coin policies.
Ultimately, the dust is far from settled on this issue. Most of the impacted tokens are still substantially down from their positions yesterday, which is unfortunate in this fearful market. Between HyperLiquid’s short squeeze last week and this incident with Wintermute and ACT, overreach from crypto exchanges could damage market confidence.
Disclaimer
In adherence to the Trust Project guidelines, BeInCrypto is committed to unbiased, transparent reporting. This news article aims to provide accurate, timely information. However, readers are advised to verify facts independently and consult with a professional before making any decisions based on this content. Please note that our Terms and Conditions, Privacy Policy, and Disclaimers have been updated.
Market
XRP Battle Heats Up—Can Bulls Turn the Tide?

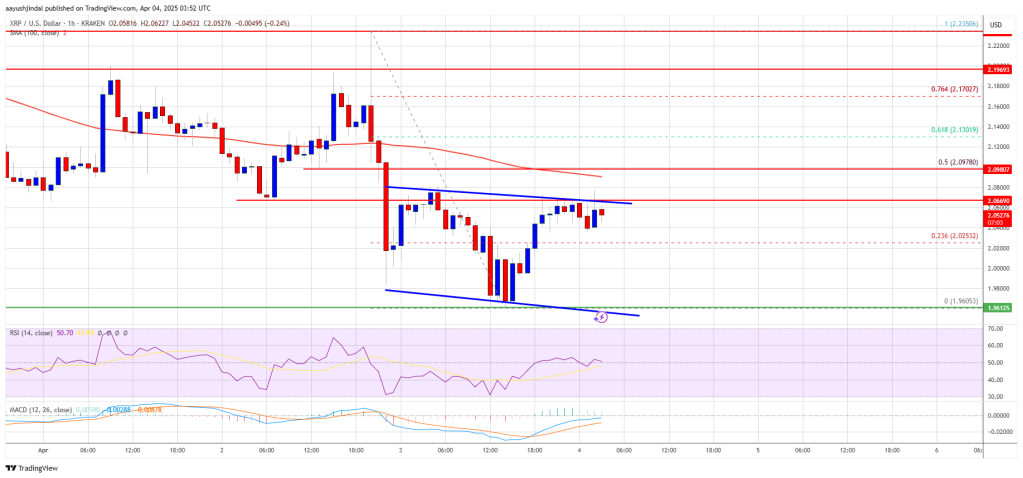
XRP price started a fresh decline below the $2.050 zone. The price is now consolidating and might face hurdles near the $2.10 level.
- XRP price started a fresh decline below the $2.120 and $2.050 levels.
- The price is now trading below $2.10 and the 100-hourly Simple Moving Average.
- There is a short-term declining channel forming with resistance at $2.0680 on the hourly chart of the XRP/USD pair (data source from Kraken).
- The pair might extend losses if it fails to clear the $2.10 resistance zone.
XRP Price Attempts Recovery
XRP price extended losses below the $2.050 support level, like Bitcoin and Ethereum. The price declined below the $2.00 and $1.980 support levels. A low was formed at $1.960 and the price is attempting a recovery wave.
There was a move above the $2.00 and $2.020 levels. The price surpassed the 23.6% Fib retracement level of the downward move from the $2.235 swing high to the $1.960 low. However, the bears are active below the $2.10 resistance zone.
The price is now trading below $2.10 and the 100-hourly Simple Moving Average. On the upside, the price might face resistance near the $2.070 level. There is also a short-term declining channel forming with resistance at $2.0680 on the hourly chart of the XRP/USD pair.
The first major resistance is near the $2.10 level. It is near the 50% Fib retracement level of the downward move from the $2.235 swing high to the $1.960 low. The next resistance is $2.120.
A clear move above the $2.120 resistance might send the price toward the $2.180 resistance. Any more gains might send the price toward the $2.2350 resistance or even $2.40 in the near term. The next major hurdle for the bulls might be $2.50.
Another Decline?
If XRP fails to clear the $2.10 resistance zone, it could start another decline. Initial support on the downside is near the $2.00 level. The next major support is near the $1.960 level.
If there is a downside break and a close below the $1.960 level, the price might continue to decline toward the $1.920 support. The next major support sits near the $1.90 zone.
Technical Indicators
Hourly MACD – The MACD for XRP/USD is now losing pace in the bearish zone.
Hourly RSI (Relative Strength Index) – The RSI for XRP/USD is now above the 50 level.
Major Support Levels – $2.00 and $1.960.
Major Resistance Levels – $2.10 and $2.120.
Market
Ethereum Price Losing Ground—Is a Drop to $1,550 Inevitable?

Reason to trust

Strict editorial policy that focuses on accuracy, relevance, and impartiality
Created by industry experts and meticulously reviewed
The highest standards in reporting and publishing
Strict editorial policy that focuses on accuracy, relevance, and impartiality
Morbi pretium leo et nisl aliquam mollis. Quisque arcu lorem, ultricies quis pellentesque nec, ullamcorper eu odio.
Ethereum price attempted a recovery wave above the $1,820 level but failed. ETH is now consolidating losses and might face resistance near the $1,840 zone.
- Ethereum failed to stay above the $1,850 and $1,840 levels.
- The price is trading below $1,840 and the 100-hourly Simple Moving Average.
- There is a short-term bearish trend line forming with resistance at $1,810 on the hourly chart of ETH/USD (data feed via Kraken).
- The pair must clear the $1,820 and $1,840 resistance levels to start a decent increase.
Ethereum Price Dips Further
Ethereum price failed to stay above the $1,800 support zone and extended losses, like Bitcoin. ETH traded as low as $1,751 and recently corrected some gains. There was a move above the $1,780 and $1,800 resistance levels.
The bulls even pushed the price above the 23.6% Fib retracement level of the downward move from the $1,955 swing high to the $1,751 low. However, the bears are active near the $1,820 zone. The price is now consolidating and facing many hurdles.
Ethereum price is now trading below $1,820 and the 100-hourly Simple Moving Average. On the upside, the price seems to be facing hurdles near the $1,810 level. There is also a short-term bearish trend line forming with resistance at $1,810 on the hourly chart of ETH/USD.
The next key resistance is near the $1,840 level or the 50% Fib retracement level of the downward move from the $1,955 swing high to the $1,751 low at $1,850. The first major resistance is near the $1,880 level.
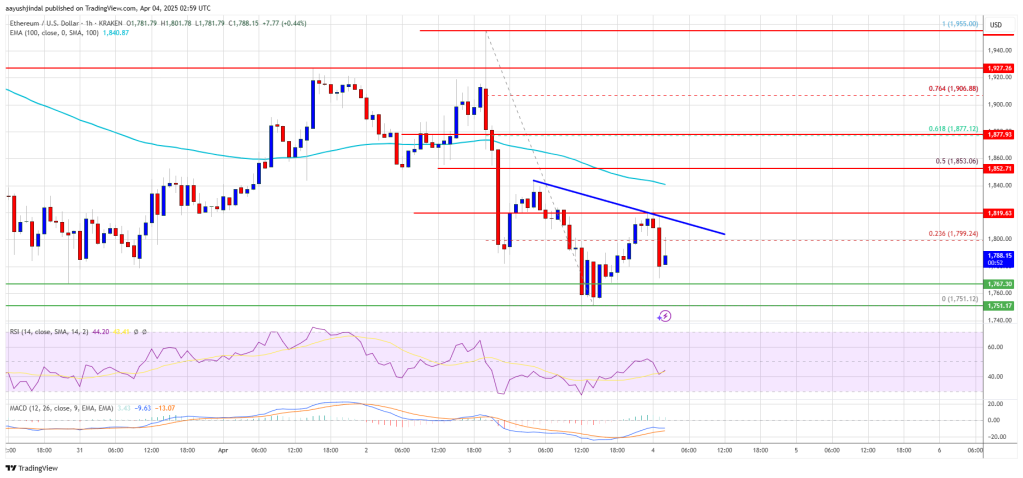
A clear move above the $1,880 resistance might send the price toward the $1,920 resistance. An upside break above the $1,920 resistance might call for more gains in the coming sessions. In the stated case, Ether could rise toward the $2,000 resistance zone or even $2,050 in the near term.
Another Decline In ETH?
If Ethereum fails to clear the $1,850 resistance, it could start another decline. Initial support on the downside is near the $1,765 level. The first major support sits near the $1,750 zone.
A clear move below the $1,750 support might push the price toward the $1,720 support. Any more losses might send the price toward the $1,680 support level in the near term. The next key support sits at $1,620.
Technical Indicators
Hourly MACD – The MACD for ETH/USD is gaining momentum in the bearish zone.
Hourly RSI – The RSI for ETH/USD is now below the 50 zone.
Major Support Level – $1,750
Major Resistance Level – $1,850
Market
Bitcoin Price Still In Trouble—Why Recovery Remains Elusive

Reason to trust

Strict editorial policy that focuses on accuracy, relevance, and impartiality
Created by industry experts and meticulously reviewed
The highest standards in reporting and publishing
Strict editorial policy that focuses on accuracy, relevance, and impartiality
Morbi pretium leo et nisl aliquam mollis. Quisque arcu lorem, ultricies quis pellentesque nec, ullamcorper eu odio.
Bitcoin price started a recovery wave from the $81,200 zone. BTC is consolidating losses and facing hurdles near the $83,500 resistance level.
- Bitcoin started a decent recovery wave above the $82,200 zone.
- The price is trading below $83,200 and the 100 hourly Simple moving average.
- There is a connecting bearish trend line forming with resistance at $83,500 on the hourly chart of the BTC/USD pair (data feed from Kraken).
- The pair could start another increase if it clears the $83,500 zone.
Bitcoin Price Faces Resistance
Bitcoin price extended losses below the $82,500 support zone and tested the $81,200 zone. BTC formed a base and recently started a decent recovery wave above the $82,200 resistance zone.
The bulls were able to push the price above the $82,500 and $83,000 resistance levels. The price even tested the 23.6% Fib retracement level of the recent decline from the $89,042 swing high to the $81,177 low. However, the price is struggling to continue higher.
Bitcoin price is now trading below $83,500 and the 100 hourly Simple moving average. On the upside, immediate resistance is near the $83,200 level. The first key resistance is near the $83,500 level. There is also a connecting bearish trend line forming with resistance at $83,500 on the hourly chart of the BTC/USD pair.
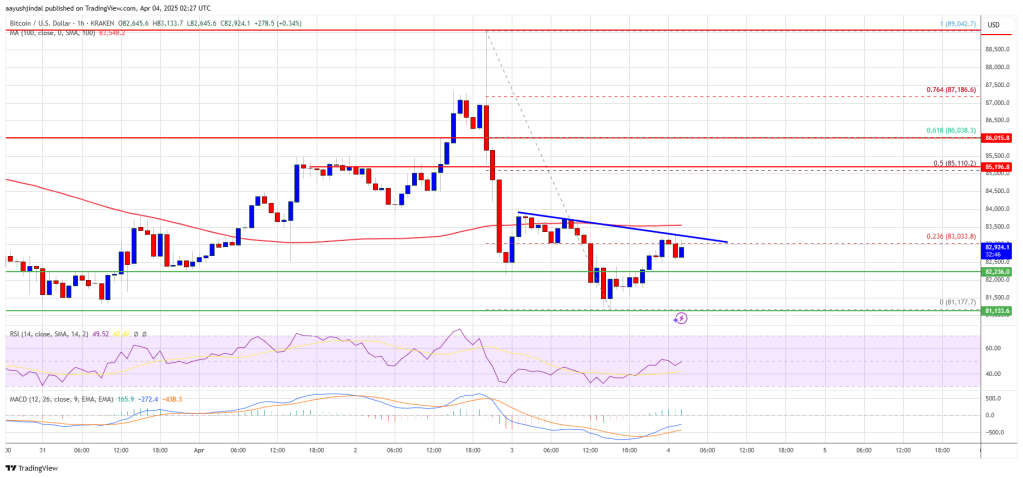
The next key resistance could be $84,500. A close above the $84,500 resistance might send the price further higher. In the stated case, the price could rise and test the $85,500 resistance level. Any more gains might send the price toward the $86,000 level or 61.8% Fib retracement level of the recent decline from the $89,042 swing high to the $81,177 low.
Another Decline In BTC?
If Bitcoin fails to rise above the $83,500 resistance zone, it could start a fresh decline. Immediate support on the downside is near the $82,200 level. The first major support is near the $81,200 level.
The next support is now near the $80,500 zone. Any more losses might send the price toward the $80,000 support in the near term. The main support sits at $78,800.
Technical indicators:
Hourly MACD – The MACD is now losing pace in the bearish zone.
Hourly RSI (Relative Strength Index) – The RSI for BTC/USD is now below the 50 level.
Major Support Levels – $82,200, followed by $81,200.
Major Resistance Levels – $83,500 and $85,000.
-

 Market20 hours ago
IP Token Price Surges, but Weak Demand Hints at Reversal
-

 Market23 hours ago
Ethereum Price Recovery Stalls—Bears Keep Price Below $2K
-

 Altcoin20 hours ago
Movimiento millonario de Solana, SOLX es la mejor opción
-

 Ethereum20 hours ago
Ethereum Trading In ‘No Man’s Land’, Breakout A ‘Matter Of Time’?
-

 Altcoin19 hours ago
John Squire Says XRP Could Spark A Wave of Early Retirements
-

 Altcoin22 hours ago
VanEck Seeks BNB ETF Approval—Big Win For Binance?
-

 Market16 hours ago
Bitcoin’s Future After Trump Tariffs
-

 Altcoin21 hours ago
Binance Issues Key Announcement On StakeStone TGE; Here’s All


