Market
Will Dogecoin (DOGE) Price Surpass $0.22 as Bull Run Returns?

A few weeks ago, the market faced an unexpected downturn that created widespread confusion. During this period, several cryptocurrencies, including Dogecoin (DOGE), saw sharp declines.
DOGE’s price plummeted to $0.083 during the crash. Although the meme coin has since regained value, the question remains: is this recovery here to stay?
Dogecoin Fails to Succumb to Bearish Wishes
According to Santiment, Dogecoin’s recent drop pushed the Market Value to Realized Value (MVRV) Z-Score into negative territory. The MVRV Z-Score measures whether a cryptocurrency is undervalued or overpriced compared to its fair value.
When the score is positive, long-term holders tend to gain more profits than short-term holders, often indicating a bull market. Conversely, a negative score suggests that short-term holders benefit more, signaling a potential bear market.
This pattern last appeared in February. Before that, it occurred in October 2023, when the current bull cycle began, and in June 2022, during a deep bear phase.
Read more: Dogecoin (DOGE) vs Shiba Inu (SHIB): What’s the Difference?

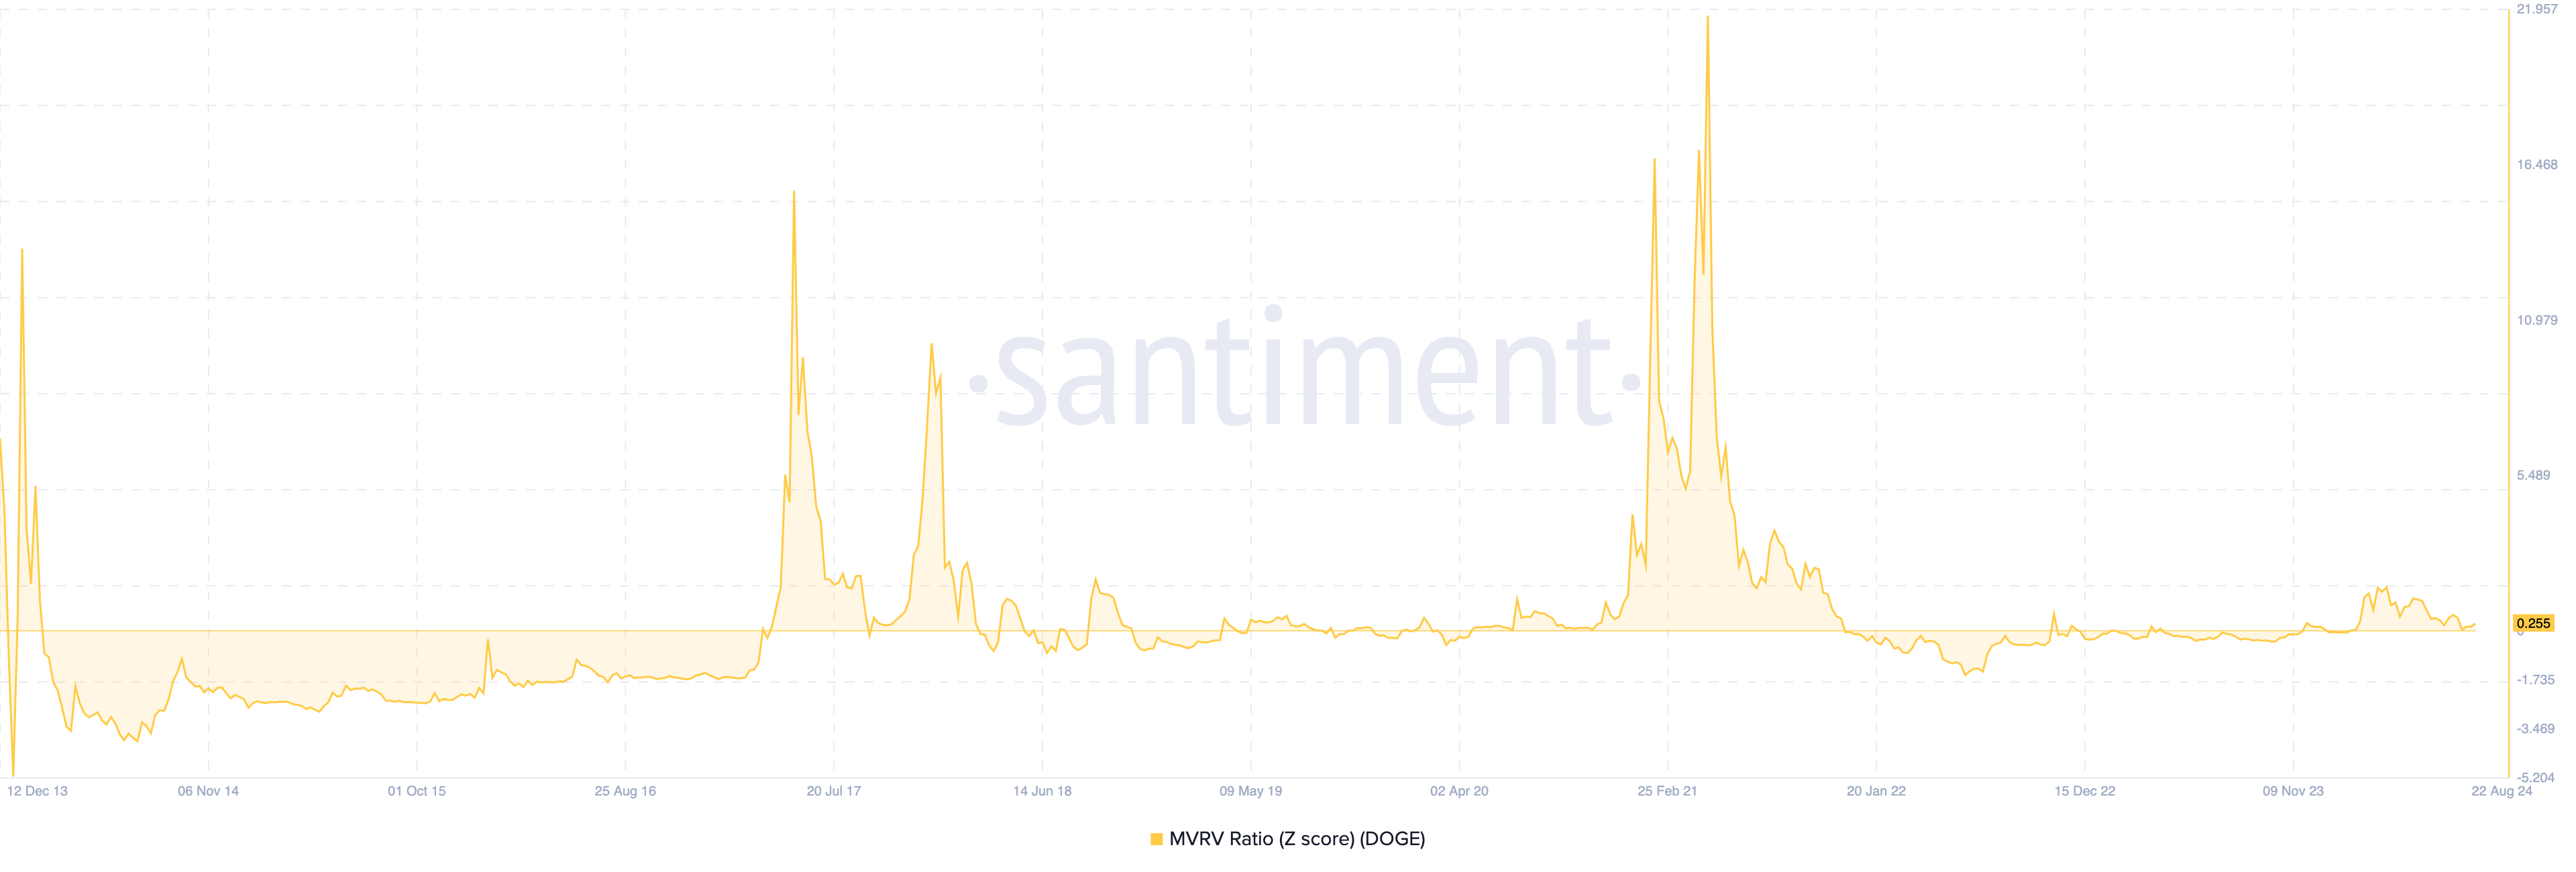
However, at the time of writing, the MVRV Z-Score has returned to negative territory, suggesting that Dogecoin may be primed for another bull run.
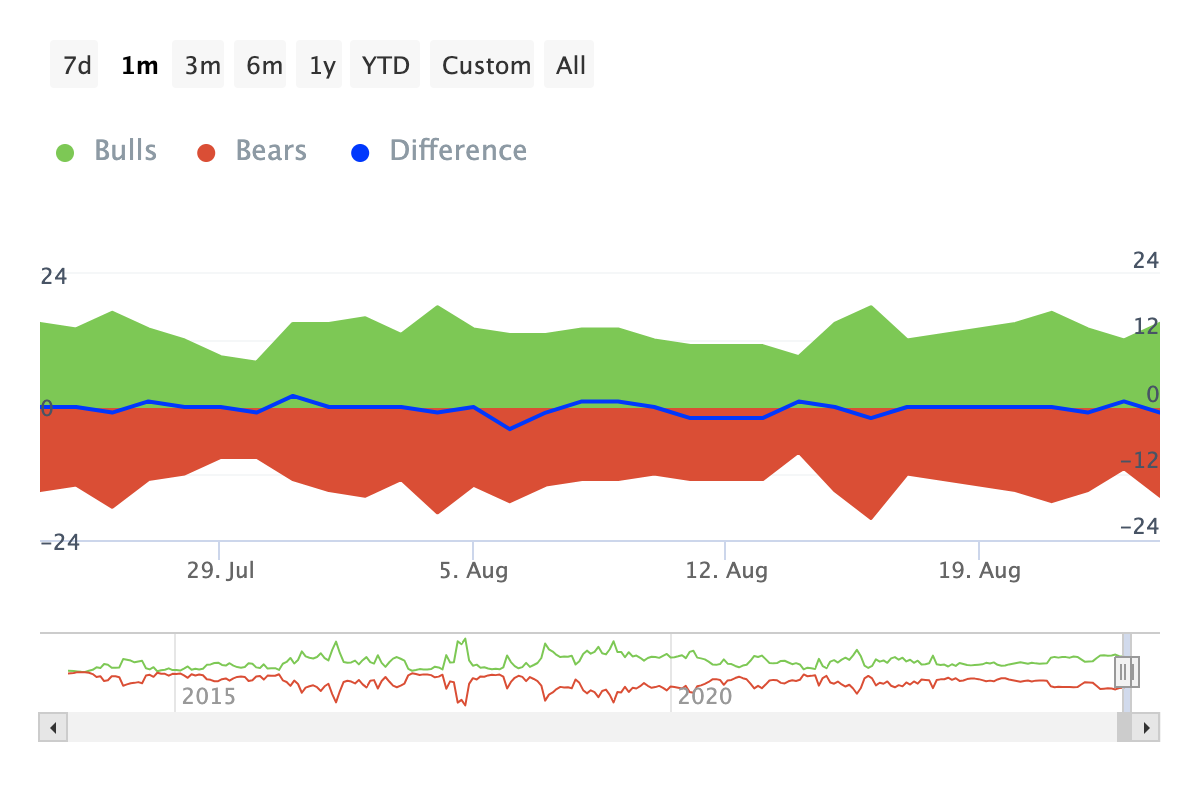
Additionally, data from IntoTheBlock indicates that the Bulls and Bears indicator aligns with this outlook. In this context, bulls are addresses that purchased at least 1% of the trading volume, while bears are those that sold a similar amount.
Currently, on-chain data shows more bulls than bears. If this trend holds, Dogecoin’s price could see a more substantial increase in the near future.

DOGE Price Prediction: Will the Coin Hit $0.22 Again?
On the weekly chart, BeInCrypto observed that Dogecoin is on the brink of breaking above the descending triangle. This triangle is generally considered a bearish pattern formed by a falling upper trendline and a horizontal support level.
Typically, if the price of an asset falls below the support level, the trend is bearish. But for DOGE, it appears to be breaking above the 78.6% Fibonacci retracement level. The Fib levels, as it is commonly called, pinpoint price points that could be support or resistance.
The 78.6% Fib level indicates prices that could precede another target. From the chart below, DOGE’s price could hit $0.16 in the mid-term (the 61.8% golden pocket ratio). If successfully broken above, the coin price might jump toward $0.22 in the long term.
Read more: Dogecoin (DOGE) Price Prediction 2024/2025/2030

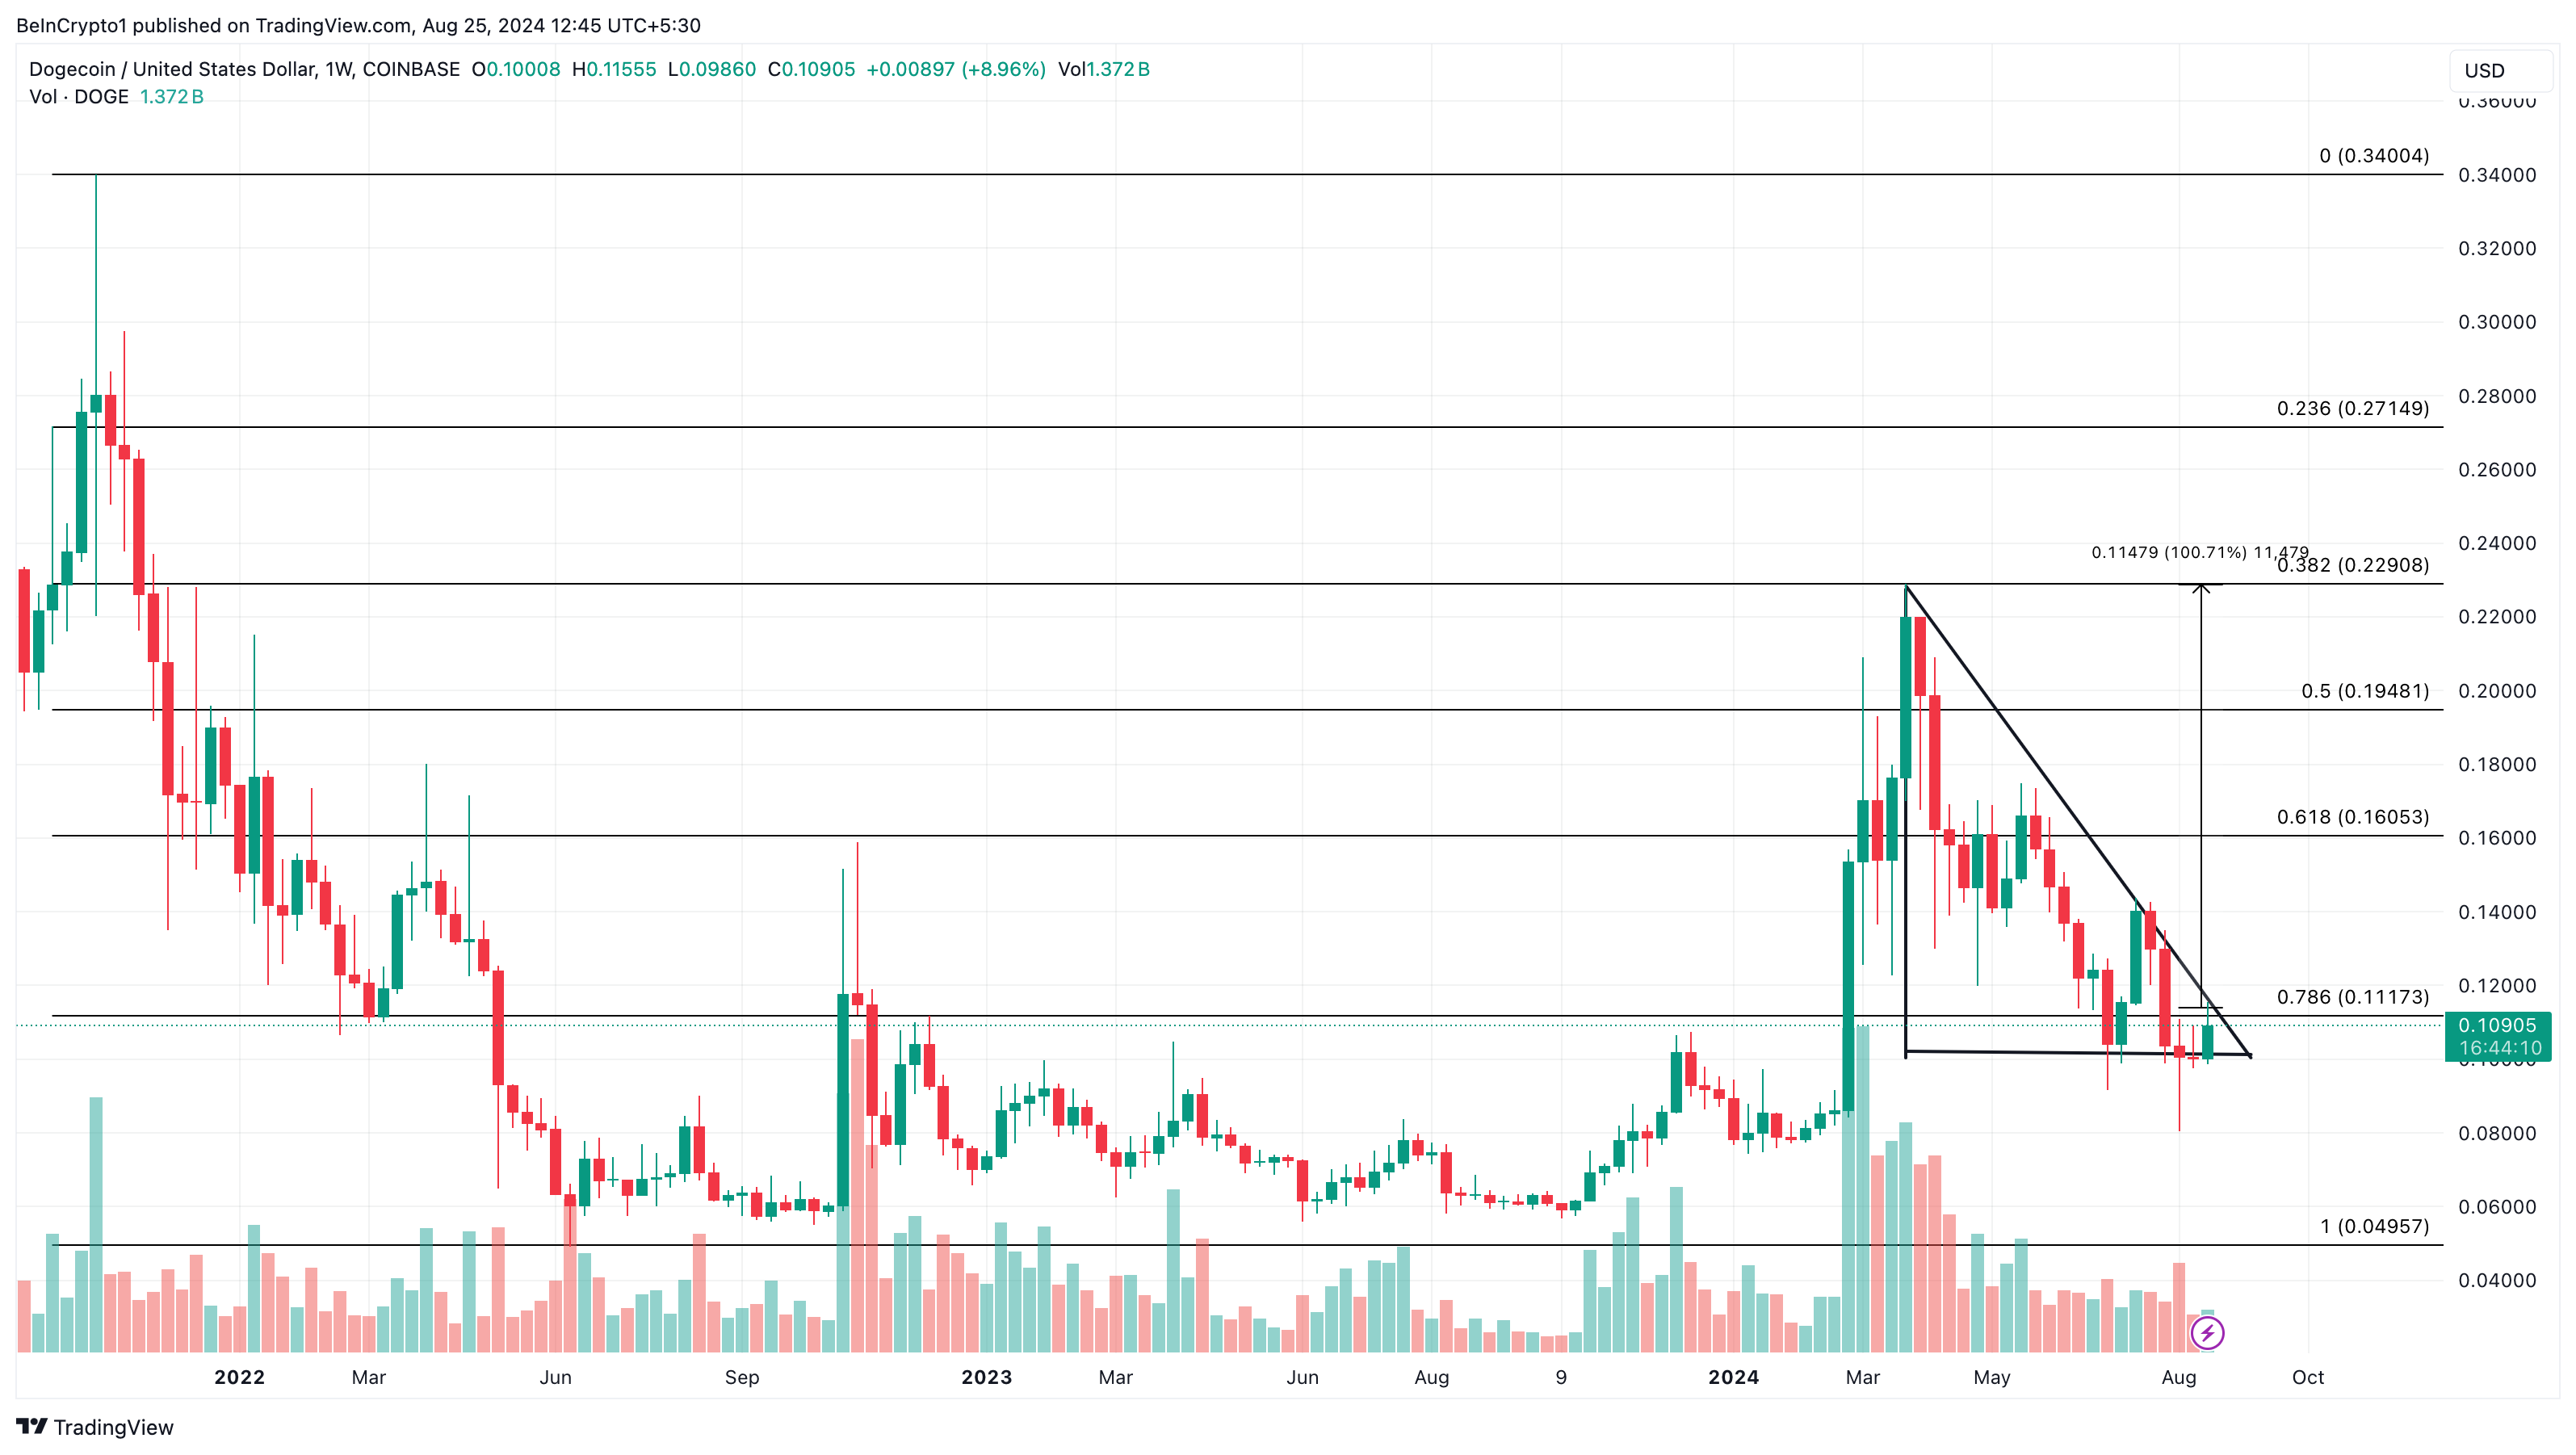
However, this long-term prediction might be invalidated if the broader market collapses into a bear cycle. If this is the case, Dogecoin’s price could slide to $0.049.
Disclaimer
In line with the Trust Project guidelines, this price analysis article is for informational purposes only and should not be considered financial or investment advice. BeInCrypto is committed to accurate, unbiased reporting, but market conditions are subject to change without notice. Always conduct your own research and consult with a professional before making any financial decisions. Please note that our Terms and Conditions, Privacy Policy, and Disclaimers have been updated.