Market
Will Chainlink (LINK) Price Breakout or Remain Range-Bound?

Chainlink (LINK) price quickly returned to $10 on September 4 after the token had initially slipped below the figure a day earlier. This resurgence comes after the decentralized blockchain network confirmed that Sonic Labs had become the latest project to integrate its Cross-Chain Interoperability Protocol (CCIP).
While this could be a positive development, its native token may struggle to rise significantly above its current value. The reasons for this are detailed below.
Chainlink Adoption Continues, But It’s Also a Stalemate
The CCIP integration with Sonic Labs, formerly known as the Fantom Foundation, took place on September 3. Sonic Labs announced that the initiative would enable seamless interaction between Chainlink and its blockchain.
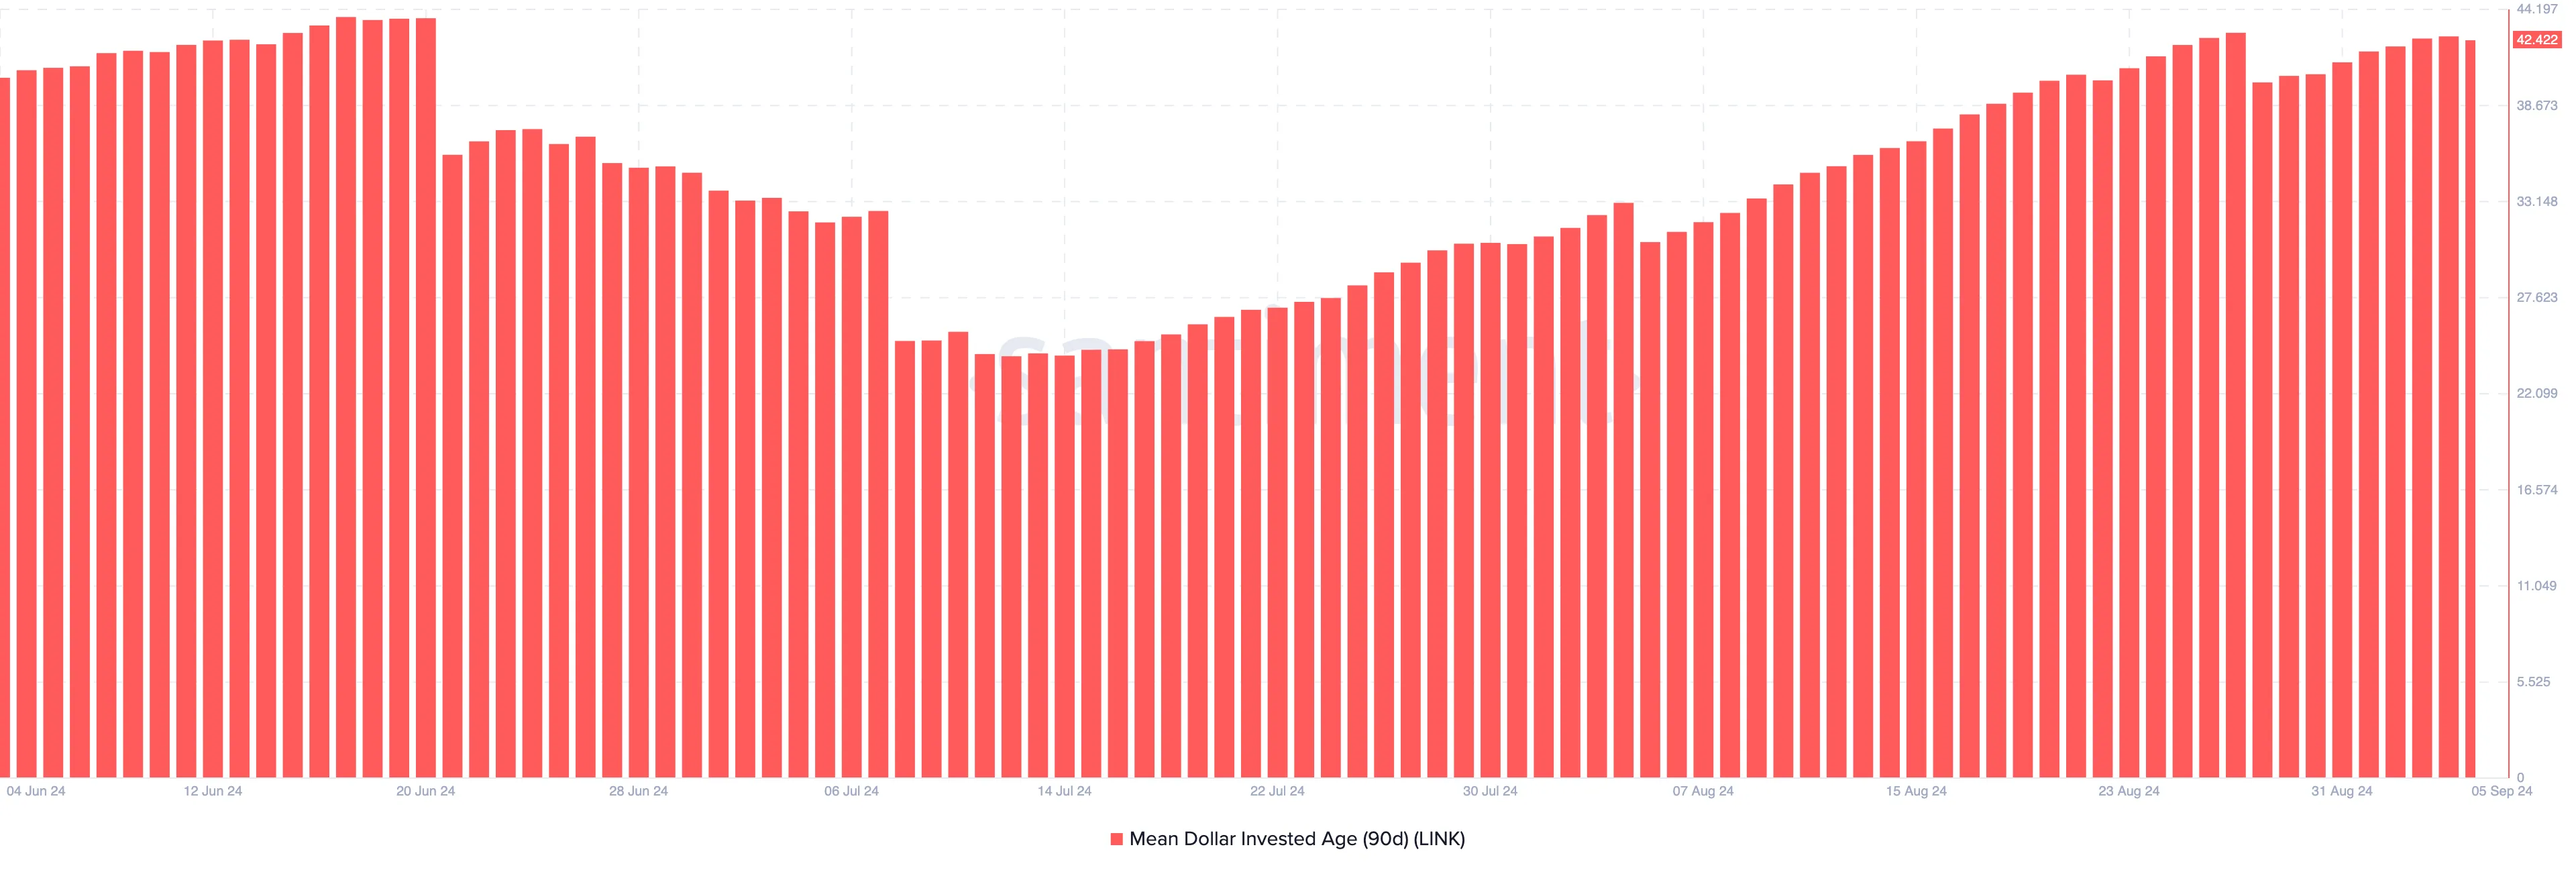
Typically, such developments could have led to a significant surge in LINK’s value. However, Santiment data shows that the 90-day Mean Dollar Investment Age (MDIA) has been rising since August 28.
MDIA measures the average age of tokens on a blockchain, weighted by their purchase price. When this metric increases, it signals that tokens are becoming more dormant, making price growth harder to achieve.
Conversely, a decline in MDIA suggests that dormant tokens are re-entering circulation, potentially driving up prices. With MDIA on the rise, LINK may face price stagnation in the short term.

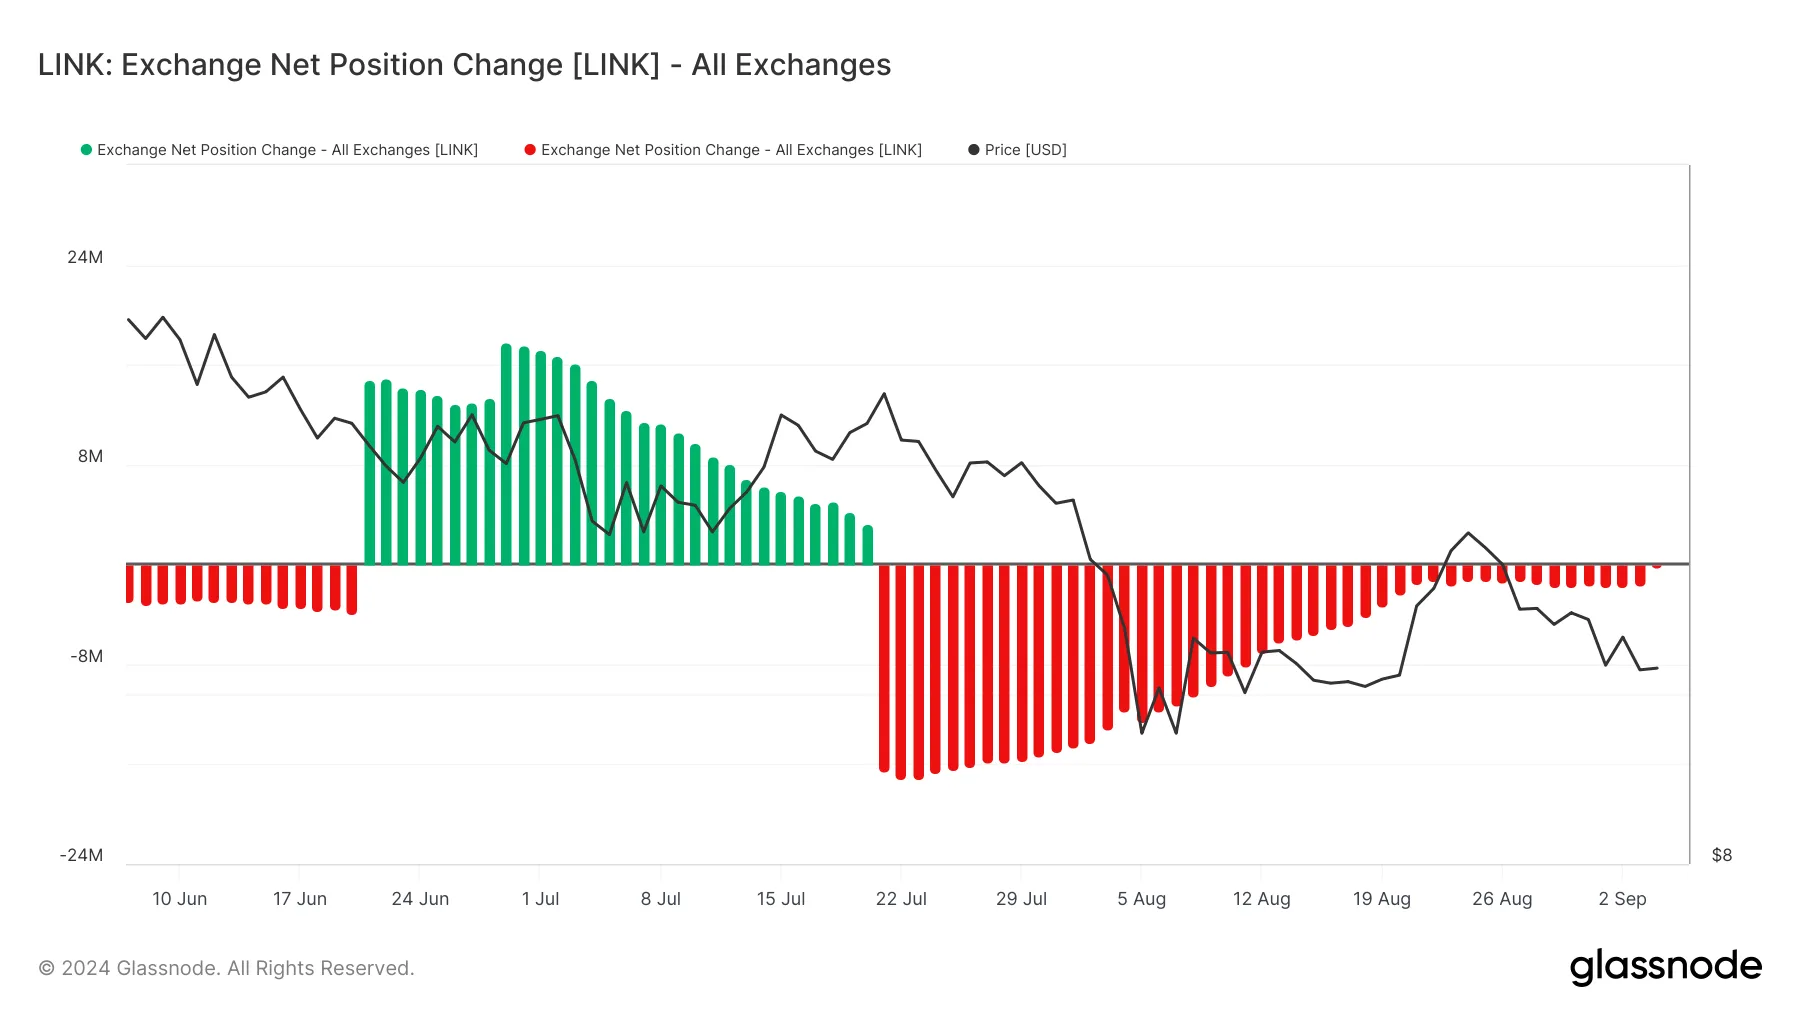
Another metric supporting this view is Chainlink’s Exchange Net Position Change. This metric monitors whether the market is inclined to sell more tokens or hold onto them on a 30-day horizon.
According to Glassnode, the metric has been declining since late July, suggesting that market participants prefer to hold LINK rather than sell. However, the rate at which tokens are being removed from exchanges has slowed compared to previous weeks.
This indicates uncertainty about the cryptocurrency’s short-term potential. If this trend continues, LINK’s price may experience consolidation rather than a significant breakout or breakdown.
Read more: How to Buy Chainlink (LINK) With a Credit Card: A Step-By-Step Guide

LINK Price Prediction: No Major Move Yet
According to the daily chart, LINK’s price continues to converge with the Relative Strength Index (RSI). At press time, the RSI, which measures momentum, is down to 40.22, suggesting that the average gain for the cryptocurrency is smaller than the average loss.
The last time the token experienced a similar movement, the price fell to $9.44. Currently, Chainlink is trading at $10.22. Although the cryptocurrency may not drop below $9 this time, it could continue to move sideways.
As shown in the chart below, LINK could fall to $9.94 if bulls lose their hold on the $10 level. On the upside, the token might rise to the overhead resistance at $10.86. Still, in the short term, Chainlink may face difficulty breaking out of this range-bound movement.
Read more: 13 Best Penny Cryptocurrencies To Invest In September 2024

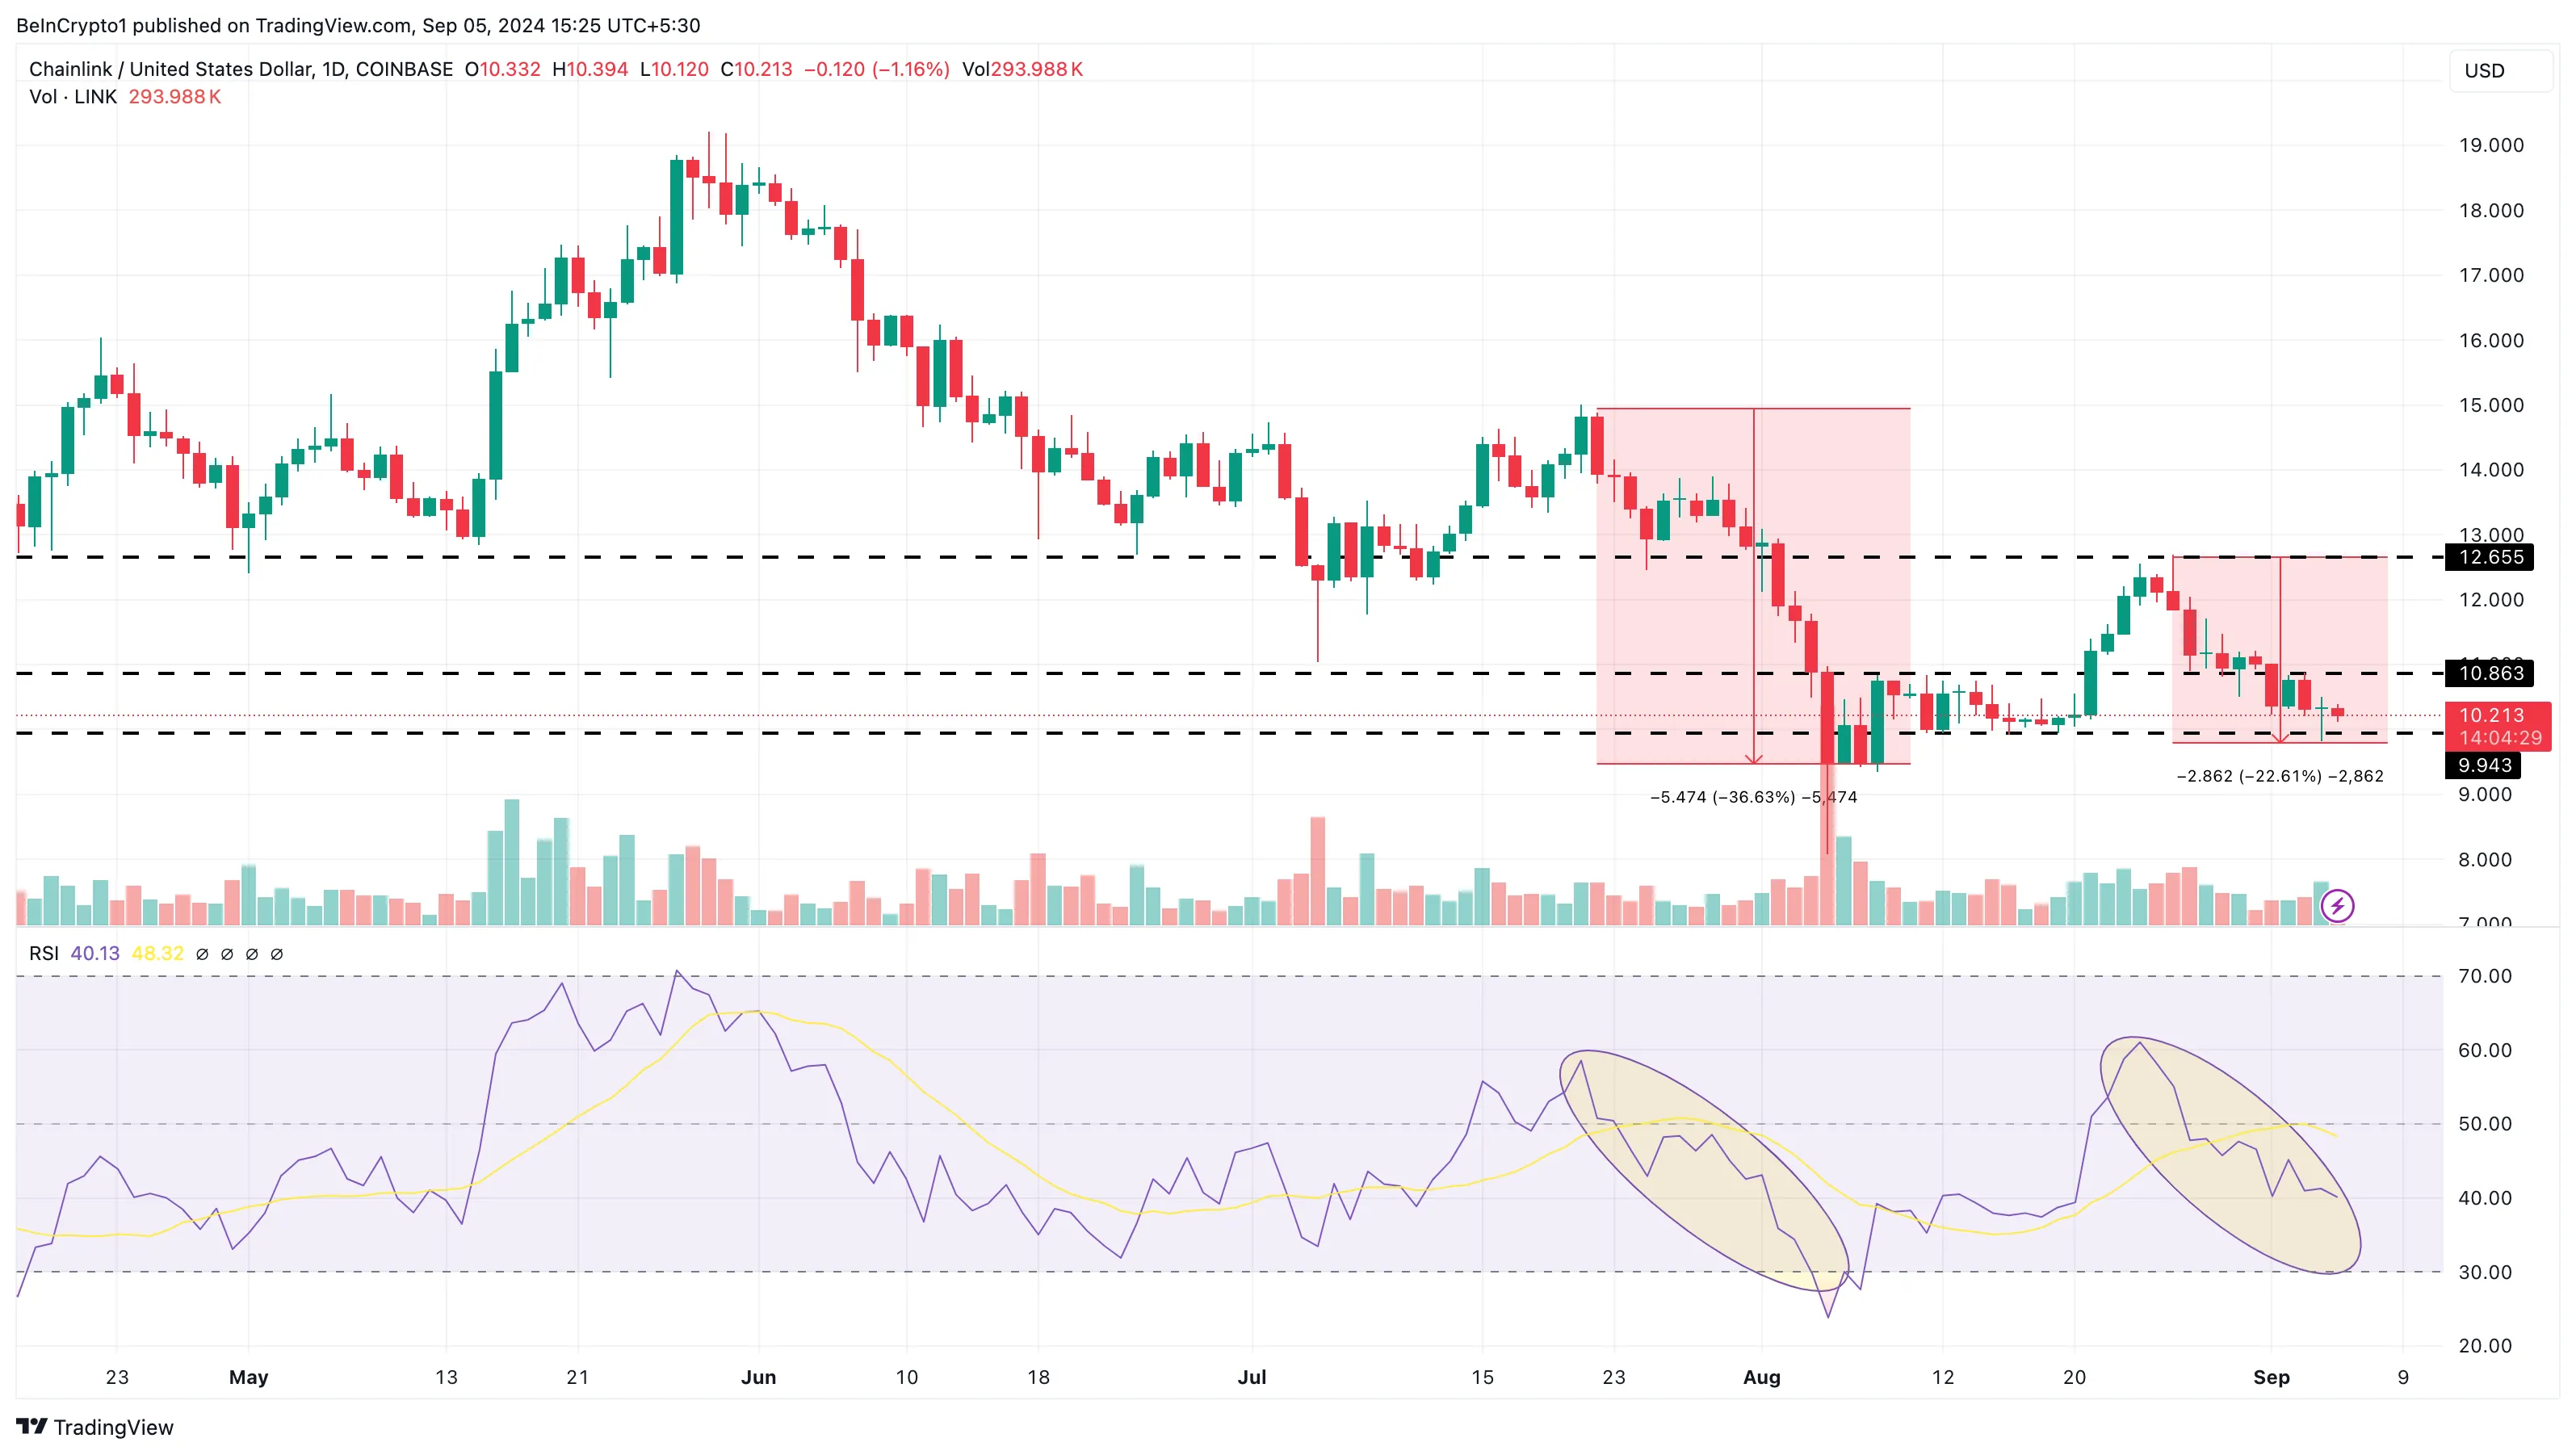
However, if the token surpasses the $10.86 level, this forecast could shift, leading to a breakout that pushes the price to $12.65. Conversely, if it drops below $9.44, the price might fall as low as $8.05.
Disclaimer
In line with the Trust Project guidelines, this price analysis article is for informational purposes only and should not be considered financial or investment advice. BeInCrypto is committed to accurate, unbiased reporting, but market conditions are subject to change without notice. Always conduct your own research and consult with a professional before making any financial decisions. Please note that our Terms and Conditions, Privacy Policy, and Disclaimers have been updated.