
Market
Will Bitcoin Price Rally Above $64,000?
After weeks of caution, Bitcoin (BTC) traders are shaking off their fears and increasing their trading activity. This renewed momentum comes in response to the Federal Reserve’s decision to cut interest rates by 50 basis points (0.50%), reigniting market confidence.
Bitcoin is now trading above $61,000 for the first time in nearly a month, signaling a potential rally on the horizon.
Bitcoin Sees Resurgence in Trading Activity
The Federal Reserve’s 50 basis point rate cut is expected to drive more investment into riskier assets, such as Bitcoin. This trend has already begun, marked by a positive shift in sentiment toward the leading cryptocurrency.
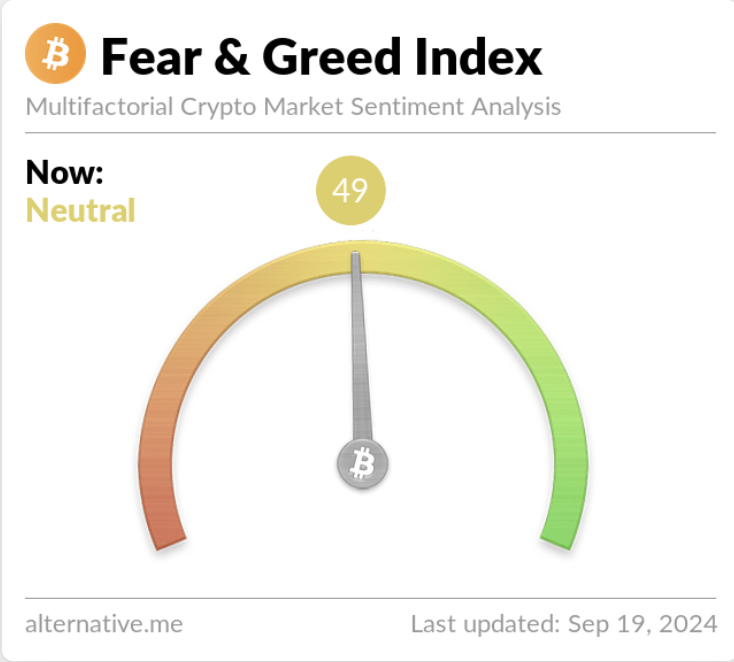
After weeks of fear dominating the market, sentiment shifted to neutral on Wednesday following the rate cut. This shift signals renewed confidence, with Bitcoin holders neither overly pessimistic nor excessively greedy. In such neutral conditions, investors typically re-enter the market gradually, boosting trading volumes and contributing to a steady price increase.
Read more: Bitcoin Halving History: Everything You Need To Know
As of press time, Bitcoin is trading at $61,967. Earlier Thursday morning, BTC briefly reached $62,501 before experiencing a slight pullback. Over the past 24 hours, trading volume surged by 12%, totaling $46 billion.
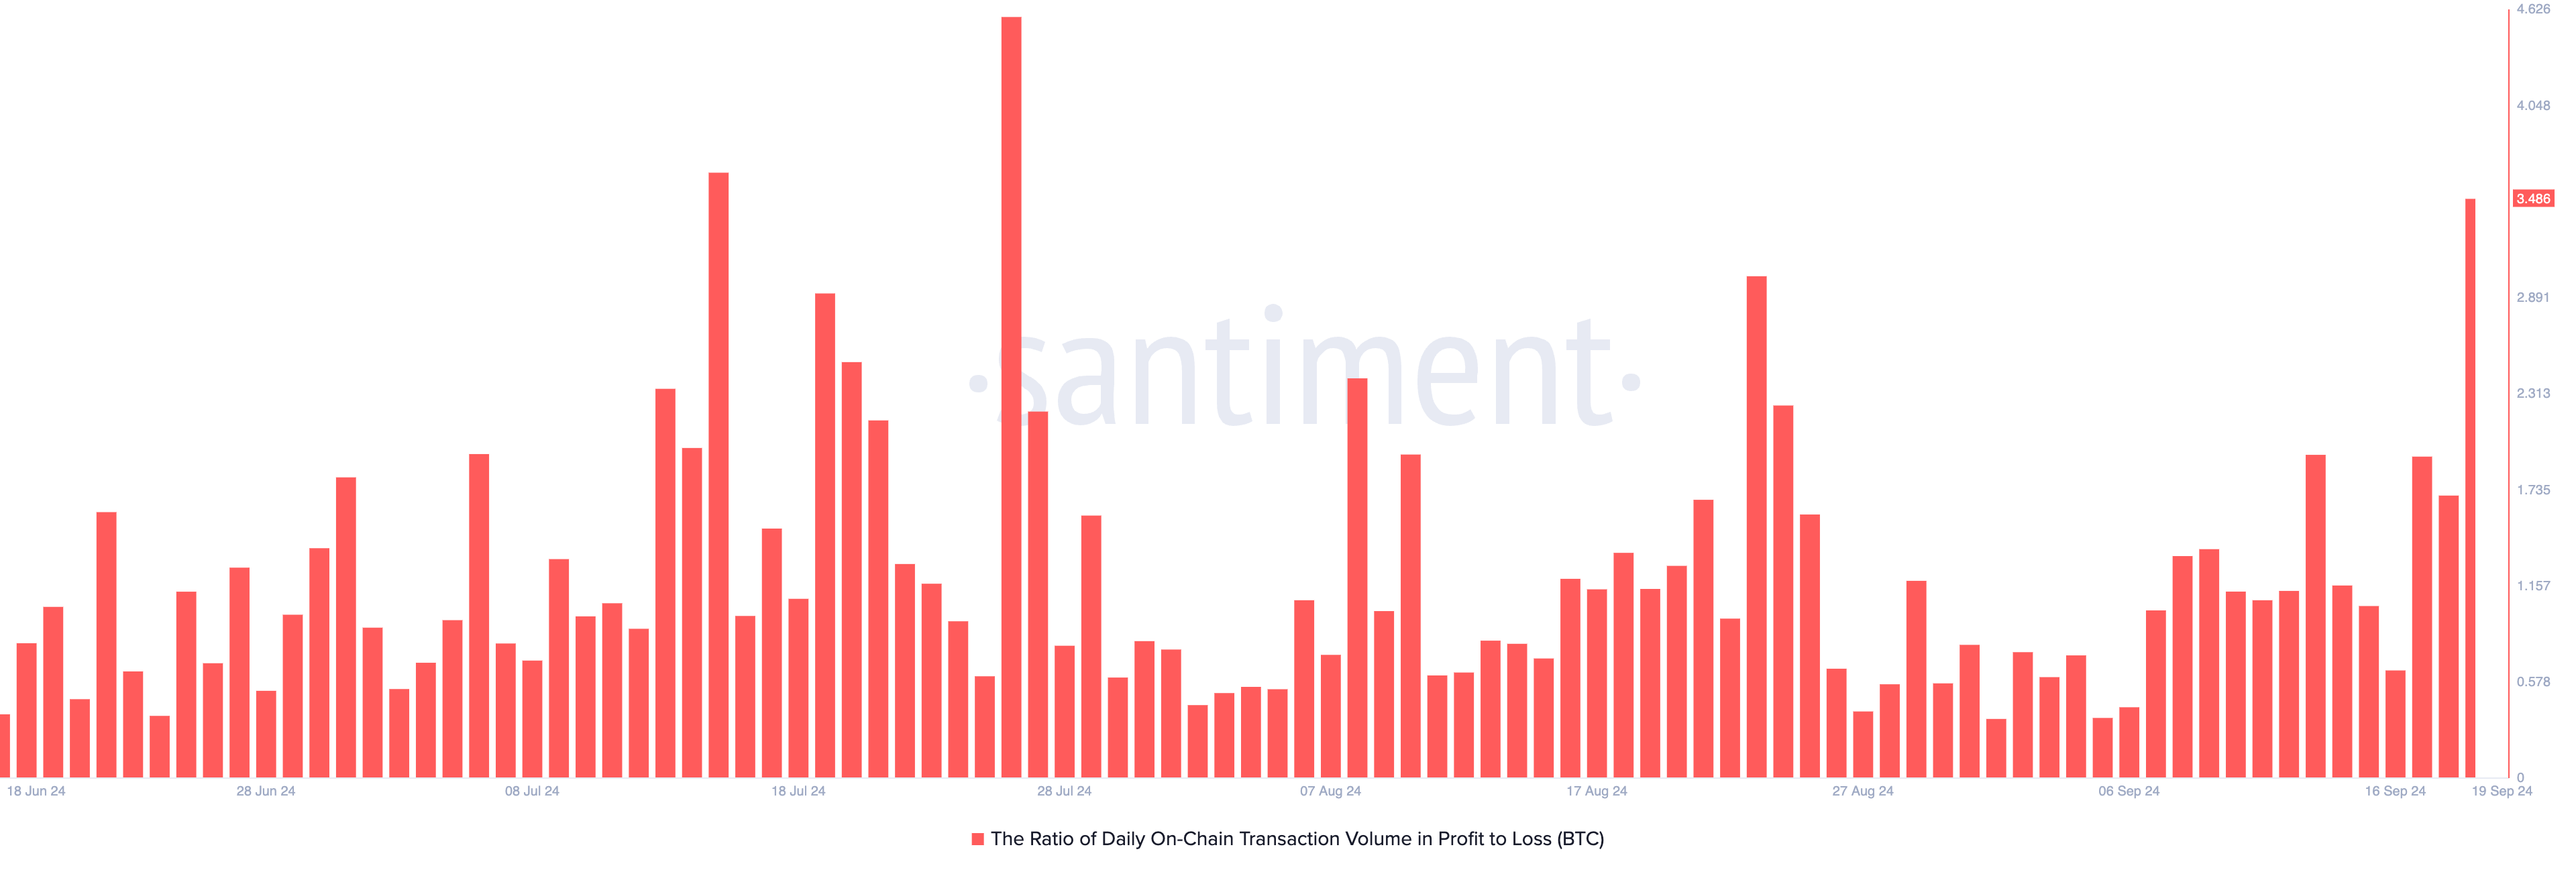
With Bitcoin trading at its highest in nearly a month, the majority of Thursday’s transactions have been profitable. According to BeInCrypto, the ratio of BTC’s transaction volume in profit to loss has reached its highest level since July, standing at 3.48. This means that for every transaction resulting in a loss, 3.48 transactions have turned a profit.
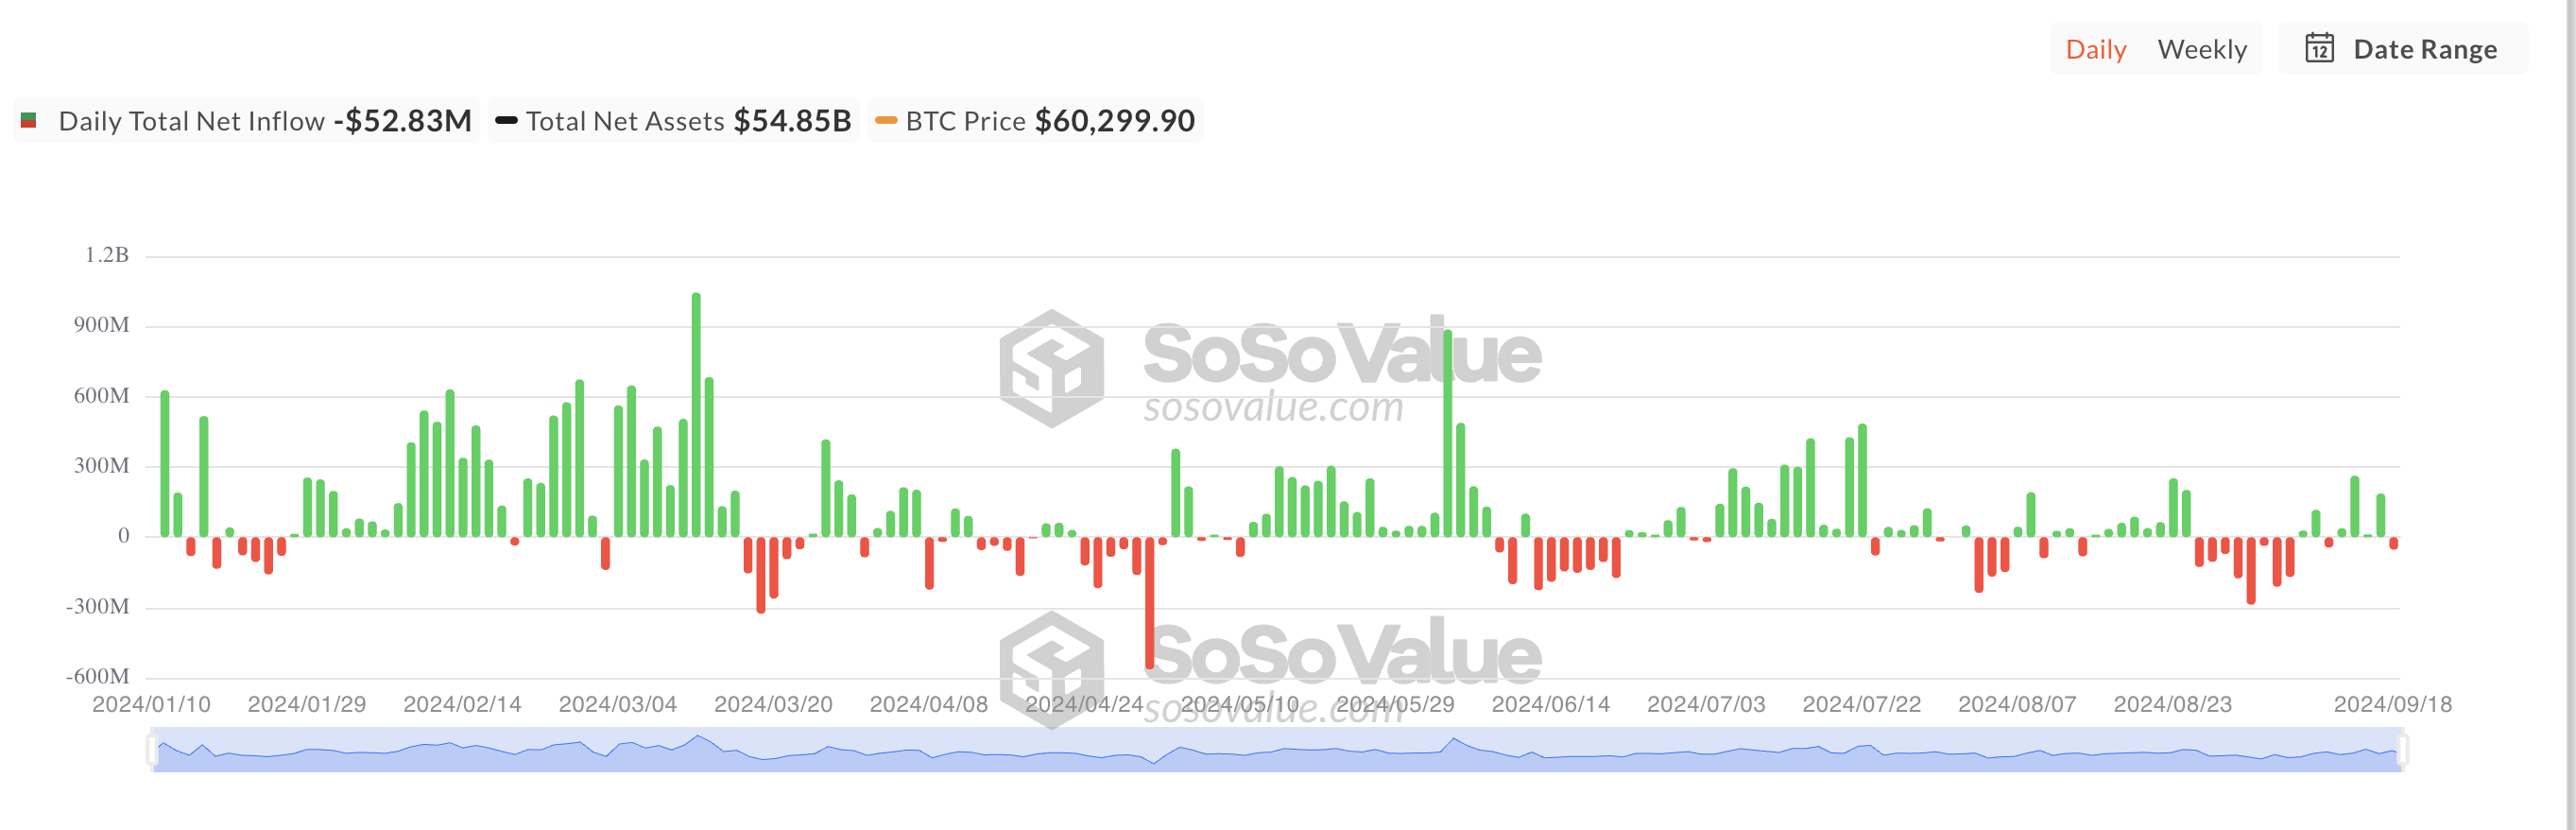
Despite Bitcoin’s positive price movement, Bitcoin spot ETFs saw their first net outflow after four consecutive days of inflows. SoSoValue reports that outflows from these funds totaled $53 million on Wednesday.
BTC Price Prediction: A Succesful Retest May Drive Coin Toward $64,000
Bitcoin’s recent price spike has pushed it above the critical resistance level of $61,388. Additionally, it is now trading above its 20-day exponential moving average (EMA), which indicates that buying pressure is surpassing selling activity.
While this rally is notable, Bitcoin is likely to retest this resistance level. Since the support floor flipped to resistance in early August, BTC has only managed to break through it once. Each rally attempt has faced strong selling pressure, leading to a downtrend. A failed retest could see Bitcoin drop to seek support around $54,302.
Read more: Bitcoin (BTC) Price Prediction 2024/2025/2030
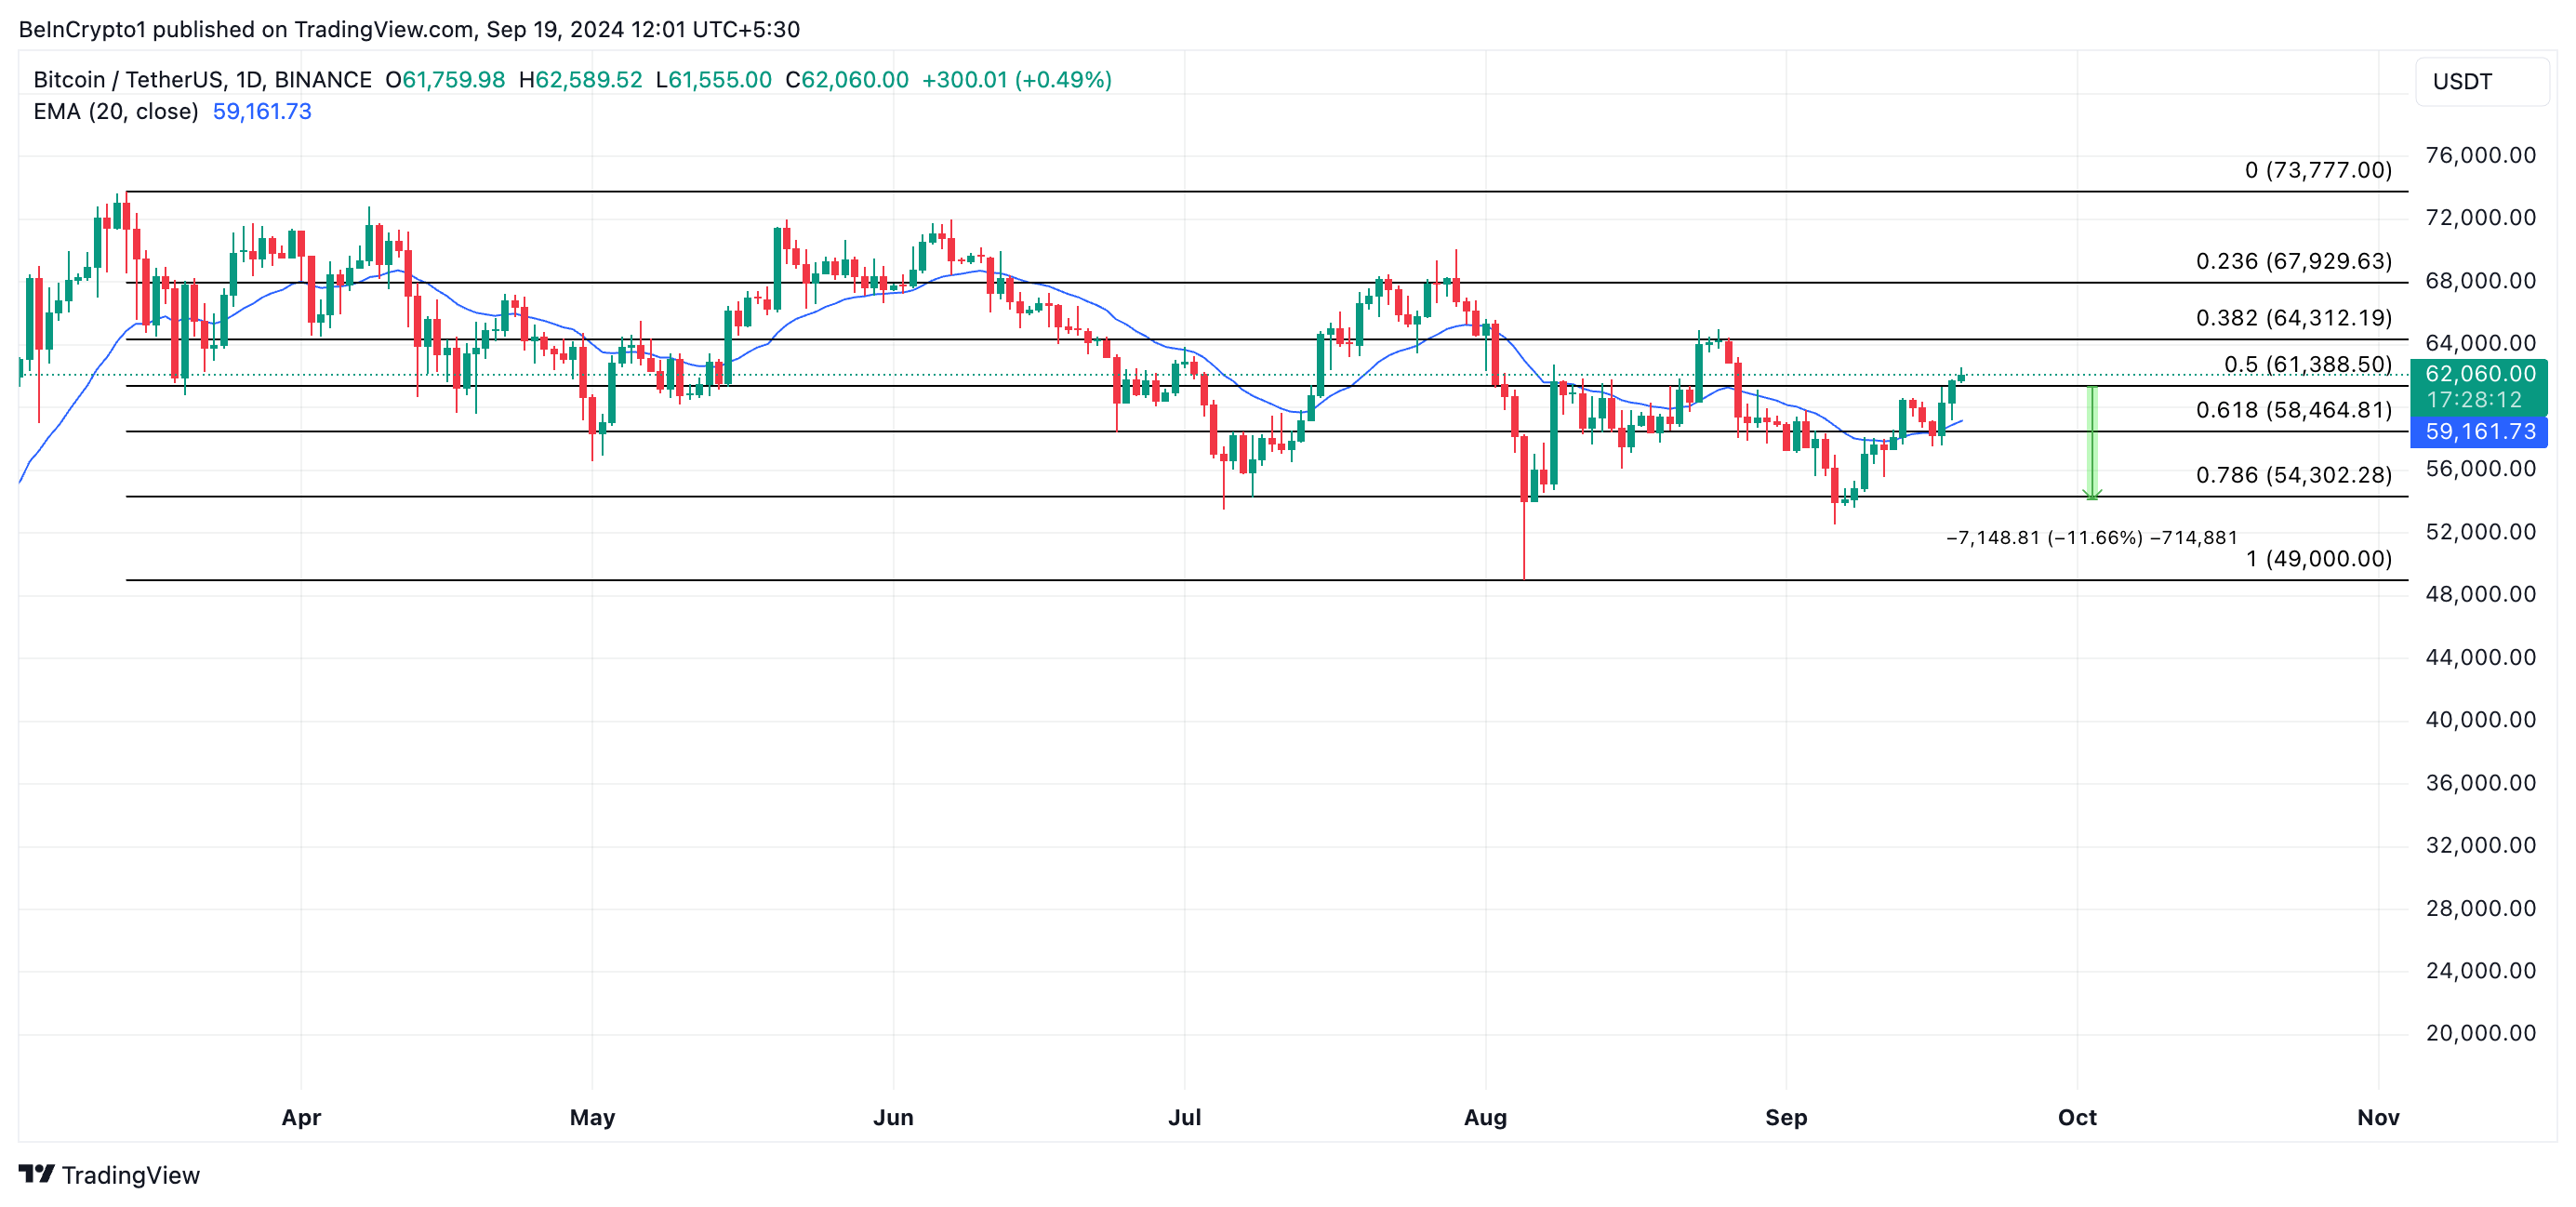
However, if the retest succeeds and BTC breaks above the resistance, the uptrend will be confirmed, with Bitcoin potentially targeting $64,312.
Disclaimer
In line with the Trust Project guidelines, this price analysis article is for informational purposes only and should not be considered financial or investment advice. BeInCrypto is committed to accurate, unbiased reporting, but market conditions are subject to change without notice. Always conduct your own research and consult with a professional before making any financial decisions. Please note that our Terms and Conditions, Privacy Policy, and Disclaimers have been updated.


The SEC and Binance filed a joint motion to pause their lawsuit for 60 days. They requested a prior pause 60 days ago and have “been in productive discussions” since then.
Both parties have asked for more time to finalize an agreement and consider all the relevant policy implications. In the main, however, it’s a substantially similar agreement to the one between the SEC and Ripple yesterday.
Binance and SEC Discussing a Settlement
The SEC has been dropping a lot of its most prominent enforcement actions lately, such as its lawsuit against Ripple. Still, despite this progress, a few outstanding cases remain.
The SEC has been ending lawsuits against prominent exchanges like Coinbase and Kraken, and now it’s preparing to drop one against Binance:
“Pursuant to the Court’s February 13, 2025 Minute Order, Plaintiff Securities and Exchange Commission and Defendants Binance Holdings Limited… and Changpeng Zhao submit this joint status report and jointly move to continue to stay this case for a period of 60 additional days,” a motion filed today read.
Binance is the world’s largest crypto exchange, and it has been engaged in this fight since 2023. The SEC sued Binance in June of that year, alleging that it committed a few serious crimes.
In addition to violating securities laws, the Commission also claims that Binance deliberately lied to regulators. This caused serious problems for its business, prompting a lengthy battle.
The SEC, however, is under new management now. Paul Atkins is the Commission’s new Chair, and he’s prioritized friendly crypto regulation.
Before his confirmation, the SEC, under Acting Chair Mark Uyeda, filed a joint request with Binance to pause the lawsuit 60 days ago, and they’re asking for another extension.
Today’s filing is slightly shorter than the previous one, but it suggests that real progress has been made. It claims that Binance and the SEC “have been in productive discussions” concerning the Crypto Task Force and broader policy implications of a settlement. However, they still need more time to fully consider a resolution.
This agreement is similar to the one filed yesterday. Specifically, the Commission also requested a 60-day pause in a cross-appeal from Ripple, attempting to tie up loose ends without wasting the court’s resources.
There are a few subtle differences, but Binance’s filing with the SEC attempts to meet the same basic goals.
Disclaimer
In adherence to the Trust Project guidelines, BeInCrypto is committed to unbiased, transparent reporting. This news article aims to provide accurate, timely information. However, readers are advised to verify facts independently and consult with a professional before making any decisions based on this content. Please note that our Terms and Conditions, Privacy Policy, and Disclaimers have been updated.

Crypto whales are making bold moves following Donald Trump’s 90-day tariff pause, with Ethereum (ETH), Mantra (OM), and Onyxcoin (XCN) drawing significant accumulation.
ETH whales pushed holdings to their highest level since September 2023, while OM holders are quietly increasing exposure amid the growing real-world asset narrative. XCN, meanwhile, saw a sharp spike in whale activity alongside a 50% price surge in just 24 hours.
Ethereum (ETH)
The broader crypto market rallied after Donald Trump announced a 90-day pause on tariffs—excluding China—boosting investor sentiment across risk assets.
Ethereum followed suit, with on-chain data showing a rise in crypto whales activity; the number of addresses holding between 1,000 and 10,000 ETH climbed from 5,376 to 5,417 between April 9 and 10, reaching its highest level since September 2023.
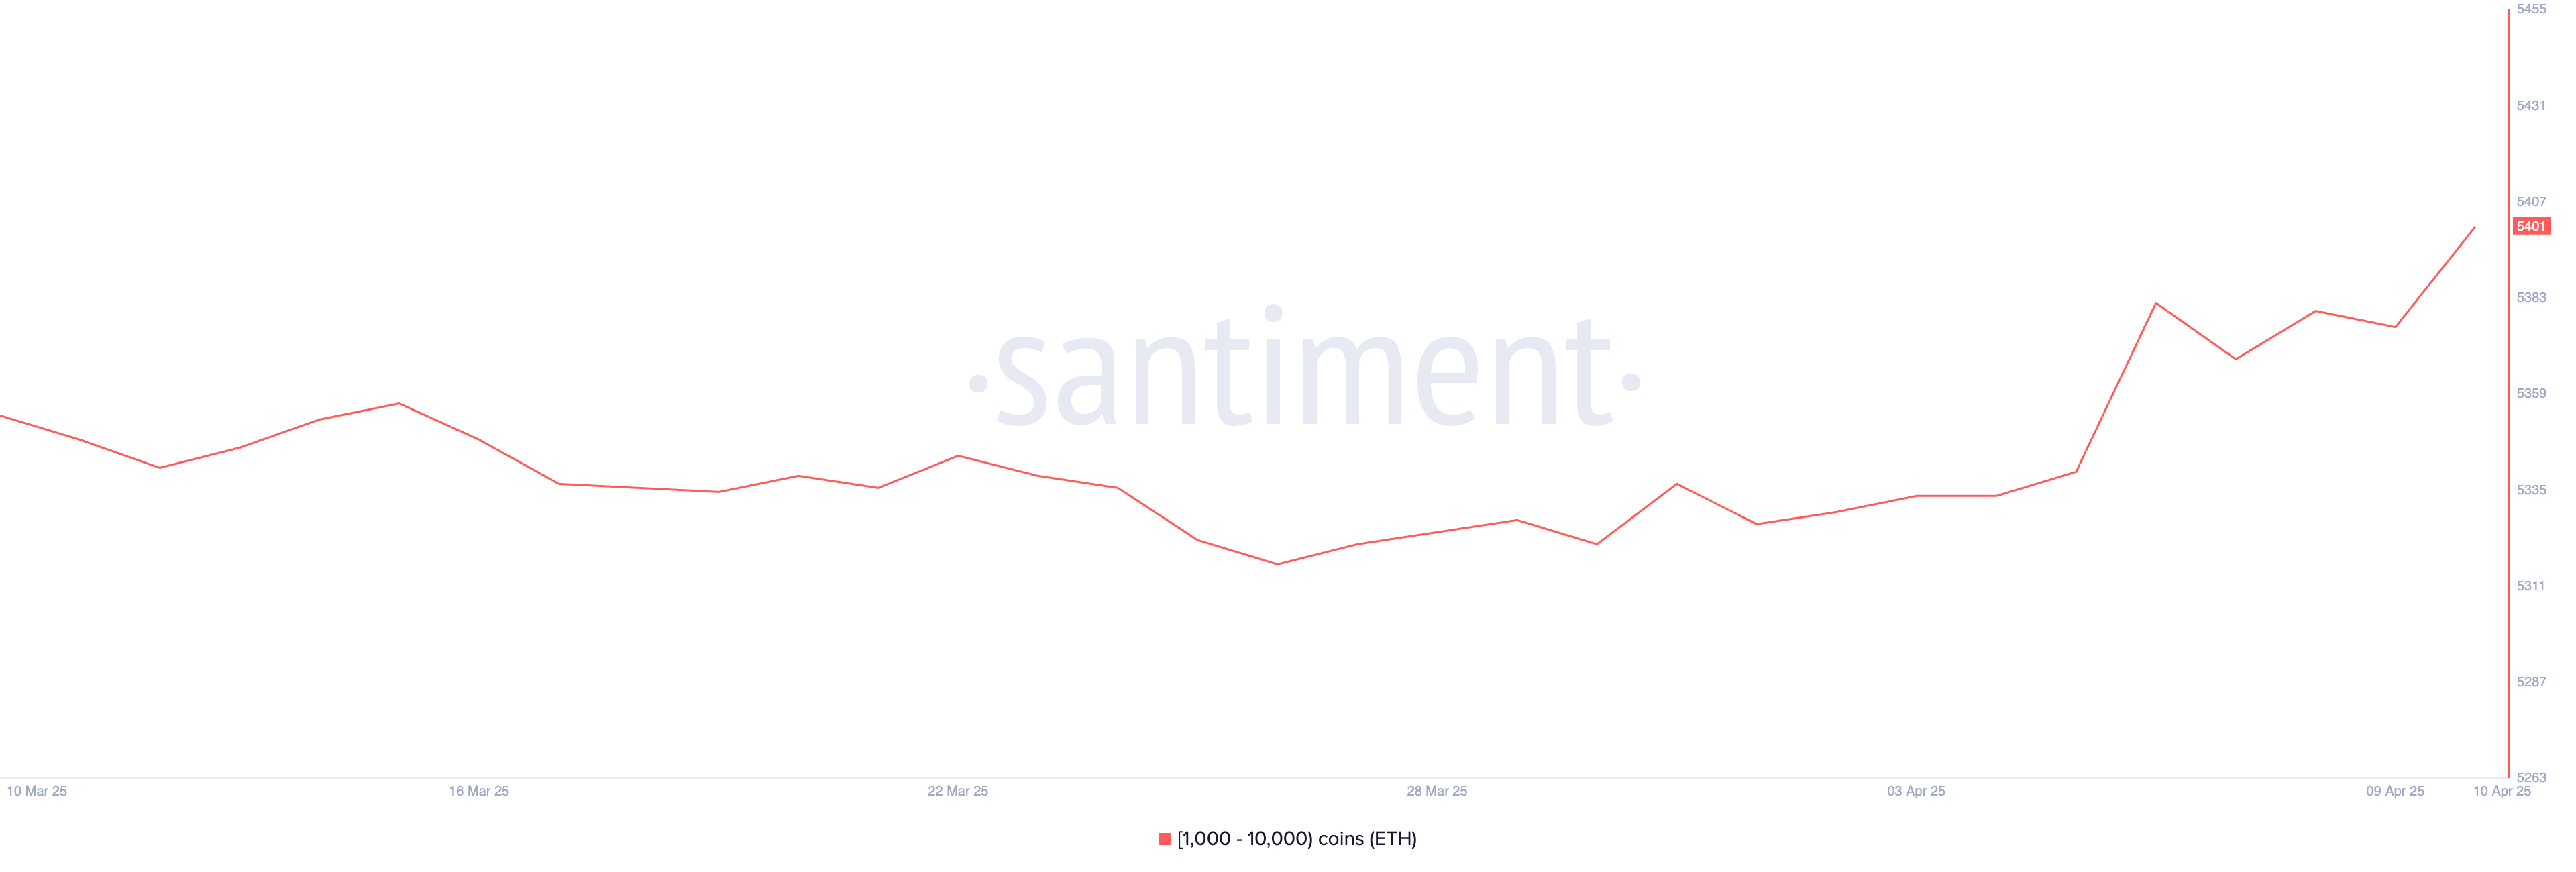
If Ethereum can maintain this renewed momentum, it may test key resistance levels at $1,749 and potentially rally further toward $1,954 and $2,104. However, macroeconomic uncertainty still looms.
A sentiment reversal could see Ethereum price retesting the $1,412 support zone. If that level fails, a deeper decline toward $1,200—or even $1,000—is possible.
Some analysts have gone as far as comparing Ethereum’s decline to Nokia’s historical collapse, warning of long-term structural weakness.
Mantra (OM)
Real-world assets (RWAs) on the blockchain have hit a new all-time high, surpassing $20 billion in total value, reinforcing their growing importance as a crypto narrative and sector.
Binance Research also highlighted that RWA tokens have shown more resilience than Bitcoin during tariff-related volatility, further boosting confidence in the sector.
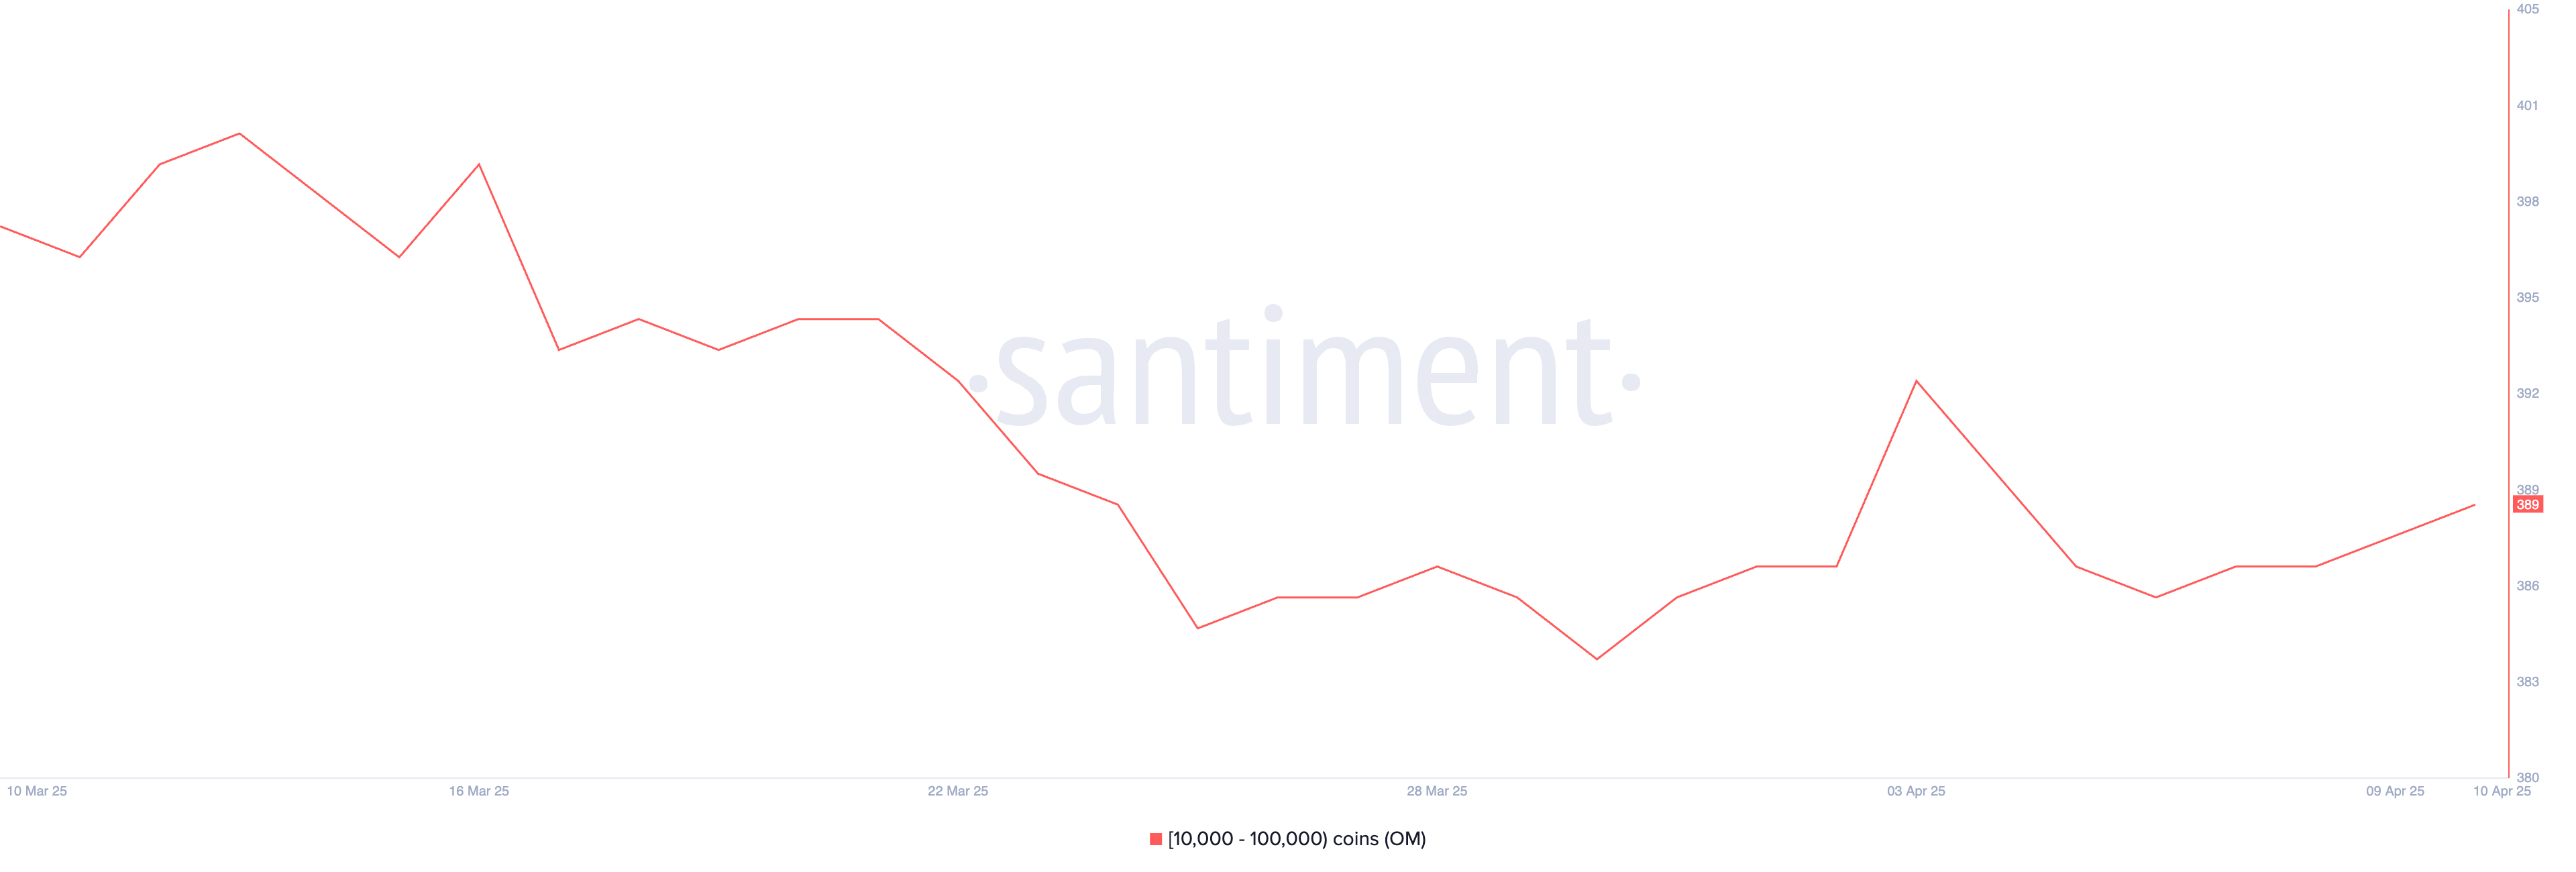
With the RWA narrative gaining traction, OM could see significant upside. Between April 6 and April 10, the number of OM whale addresses holding between 10,000 and 100,000 tokens rose from 386 to 389, signaling quiet accumulation.
If OM breaks past the resistance levels at $6.51 and $6.85, it could climb above $7. However, if the momentum fades, a correction could push the token down to $6.11, with further downside risk toward $5.68.
Onyxcoin (XCN)
Onyxcoin (XCN) has surged over 50% in the past 24 hours, breaking above the $0.02 mark as whale accumulation intensifies.
Between April 7 and April 10, the number of addresses holding between 1 million and 10 million XCN rose from 503 to 532, signaling renewed interest from large holders.
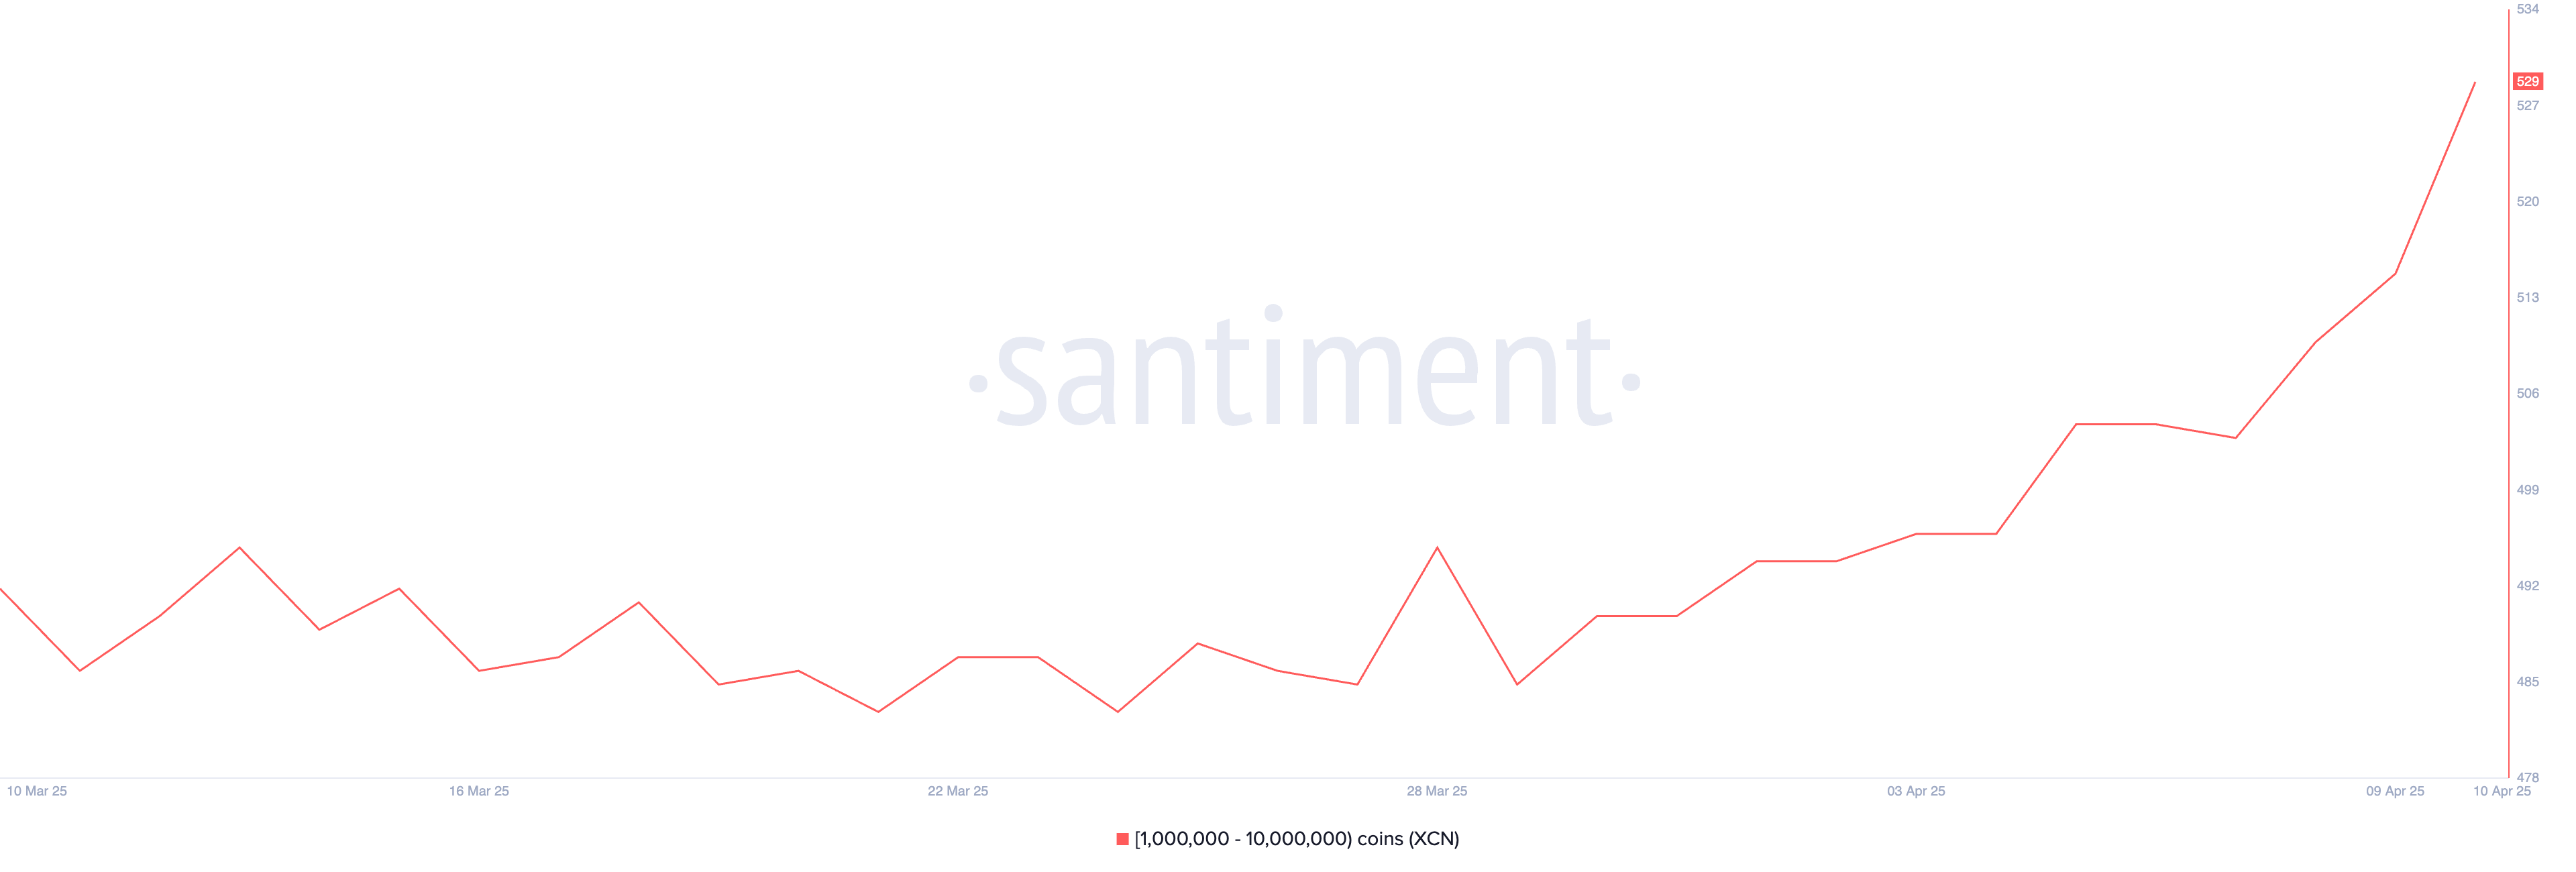
If this strong bullish momentum continues, XCN could rally toward resistance levels at $0.026, $0.033, and even $0.040. However, given the rapid price increase in a short timeframe, a correction may follow.
In that case, XCN could retest support at $0.020, with potential downside extending to $0.014 if selling pressure accelerates.
Disclaimer
In line with the Trust Project guidelines, this price analysis article is for informational purposes only and should not be considered financial or investment advice. BeInCrypto is committed to accurate, unbiased reporting, but market conditions are subject to change without notice. Always conduct your own research and consult with a professional before making any financial decisions. Please note that our Terms and Conditions, Privacy Policy, and Disclaimers have been updated.
Reason to trust
![]()
Strict editorial policy that focuses on accuracy, relevance, and impartiality
Created by industry experts and meticulously reviewed
The highest standards in reporting and publishing
Strict editorial policy that focuses on accuracy, relevance, and impartiality
Morbi pretium leo et nisl aliquam mollis. Quisque arcu lorem, ultricies quis pellentesque nec, ullamcorper eu odio.
The XRP price may be gearing up for a historic breakout as a long-term Symmetric Triangle pattern from 2017 resurfaces on the charts. If history repeats and a similar explosive move follows, a crypto analyst predicts XRP could skyrocket to an eye-popping $30.
XRP Price Triangle Pattern Signals Breakout Above $30
A new technical analysis by Egrag Crypto, a crypto analyst on X (formerly Twitter), has stirred excitement among XRP supporters, suggesting that the digital asset may be on the brink of a historic price surge and that XRP could jump from its current market value of $2 to reach $30 soon.
Related Reading
While this figure may seem rather ambitious, Egrag Crypto has identified a massive Symmetrical Triangle formation on XRP’s monthly chart. Interestingly, the analyst has revealed that this pattern is strikingly similar to one that preceded XRP’s legendary 2,600% rally in the 2017 bull market.
In the 2017-2018 bull market, XRP had surged to an all-time high of $3.84 in just months. Now, after years of tightening price action within a giant Symmetrical Triangle, the altcoin appears to be breaking out once again, and this time, the analyst predicts that the upside could be even more explosive.
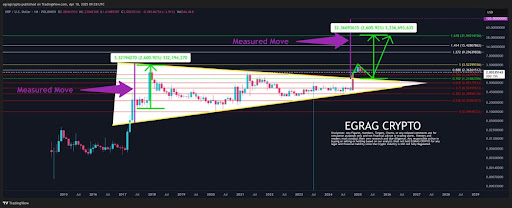
According to Egrag Crypto’s chart, if the asset mirrors its previous 2,600% triangle breakout, it could soar from the breakout zone around $1.20 to as high as $32.36. Notably, XRP’s Symmetrical Triangle formation is a classic consolidation pattern that usually results in a bullish surge in the direction of the prevailing trend.
Currently, XRP’s all-time high is $3.84. A potential surge to $32.36 would represent a whopping 741.6% increase, propelling its price to a level far exceeding its historical peak.
Bullish Pennants Strengthen Symmetrical Triangle Forecast
Egrag Crypto’s bullish forecast for XRP is supported by a textbook diagram comparing bullish pennants and symmetrical triangles, both of which point to double target zones once a breakout occurs. The pattern suggests that once the altcoin escapes its multi-year consolidation, the analyst’s projected rally may play out in three stages: an initial pump, followed by a retracement, and a second explosive move.
Related Reading
The XRP price chart shows a lower target, around $3.52, which aligns with the 1.0 Fibonacci retracement level. This indicates that the token could see a temporary rebound to 3.52, followed by a short-term pullback to the triangle breakout point at $1.20, before ultimately bouncing toward the projected $32.36 target.
Notably, this movement aligns with XRP’s current market structure, where it has maintained long-term support and is now showing signs of upward momentum. While historical price patterns offer insights into potential moves, the predicted rise to $32.36 is uncertain, given the magnitude of such a rise.
Featured image from Adobe Stock, chart from Tradingview.com
US SEC and Binance Agree To Pause Legal Proceedings for 60 More Days

Binance and the SEC File for Pause in Lawsuit

Crypto Whales Are Buying These Altcoins Post Tariffs Pause

XRP Price Flashes Symmetrical Triangle From 2017, A Repeat Could Send It as Flying To $30

Analyst Reveals XRP Price Can Hit $45 If It Follows This 2017 Pattern

This is Why The Federal Reserve Might Not Cutting Interest Rates

2.52 Million Altcoins Are Ruining Crypto’s Future

Animoca Brands Valuation Tanks 75% In Two Years, Here’s Why

Crypto exchange BingX hacked for $43 million

Are The Big Players Losing Interest?

Hong Kong’s Securities Association Tips Authorities On Crypto Self-Regulation

Coinbase cbBTC Set to go Live on Solana
2.52 Million Altcoins Are Ruining Crypto’s Future
Animoca Brands Valuation Tanks 75% In Two Years, Here’s Why
Crypto exchange BingX hacked for $43 million
Are The Big Players Losing Interest?
Hong Kong’s Securities Association Tips Authorities On Crypto Self-Regulation
Coinbase cbBTC Set to go Live on Solana
-
 Altcoin19 hours ago
XRP Price Risks 40% Drop to $1.20 If It Doesn’t Regain This Level
-

 Market19 hours ago
President Trump Signs First-Ever Crypto Bill into Law
-

 Market20 hours ago
Ethereum Price Cools Off—Can Bulls Stay in Control or Is Momentum Fading?
-

 Market18 hours ago
XRP Price Ready to Run? Bulls Eyes Fresh Gains Amid Bullish Setup
-

 Market24 hours ago
How SEC Chair Paul Atkins Will Reset US Crypto Policy
-
 Altcoin17 hours ago
BNB Chain Completes Lorentz Testnet Hardforks; Here’s The Timeline For Mainnet
-

 Market14 hours ago
How Vitalik Buterin Plans to Enhance Ethereum’s Privacy
-
 Altcoin15 hours ago
Which Altcoins Made Grayscale’s Q2 2025 Cut?