Market
Why XRP Price Might Pull Back: 3 Indicators to Watch

Ripple (XRP) attempts to climb toward $0.65 might hit significant roadblocks despite a recent price increase. At press time, XRP hovers around $0.53.
This uptick follows a sharp drop in the cryptocurrency’s value to $0.50 a few days earlier. While the token has previously shown signs of a potential trend reversal, this analysis suggests that higher values may remain out of reach.
Ripple Can’t Keep Up
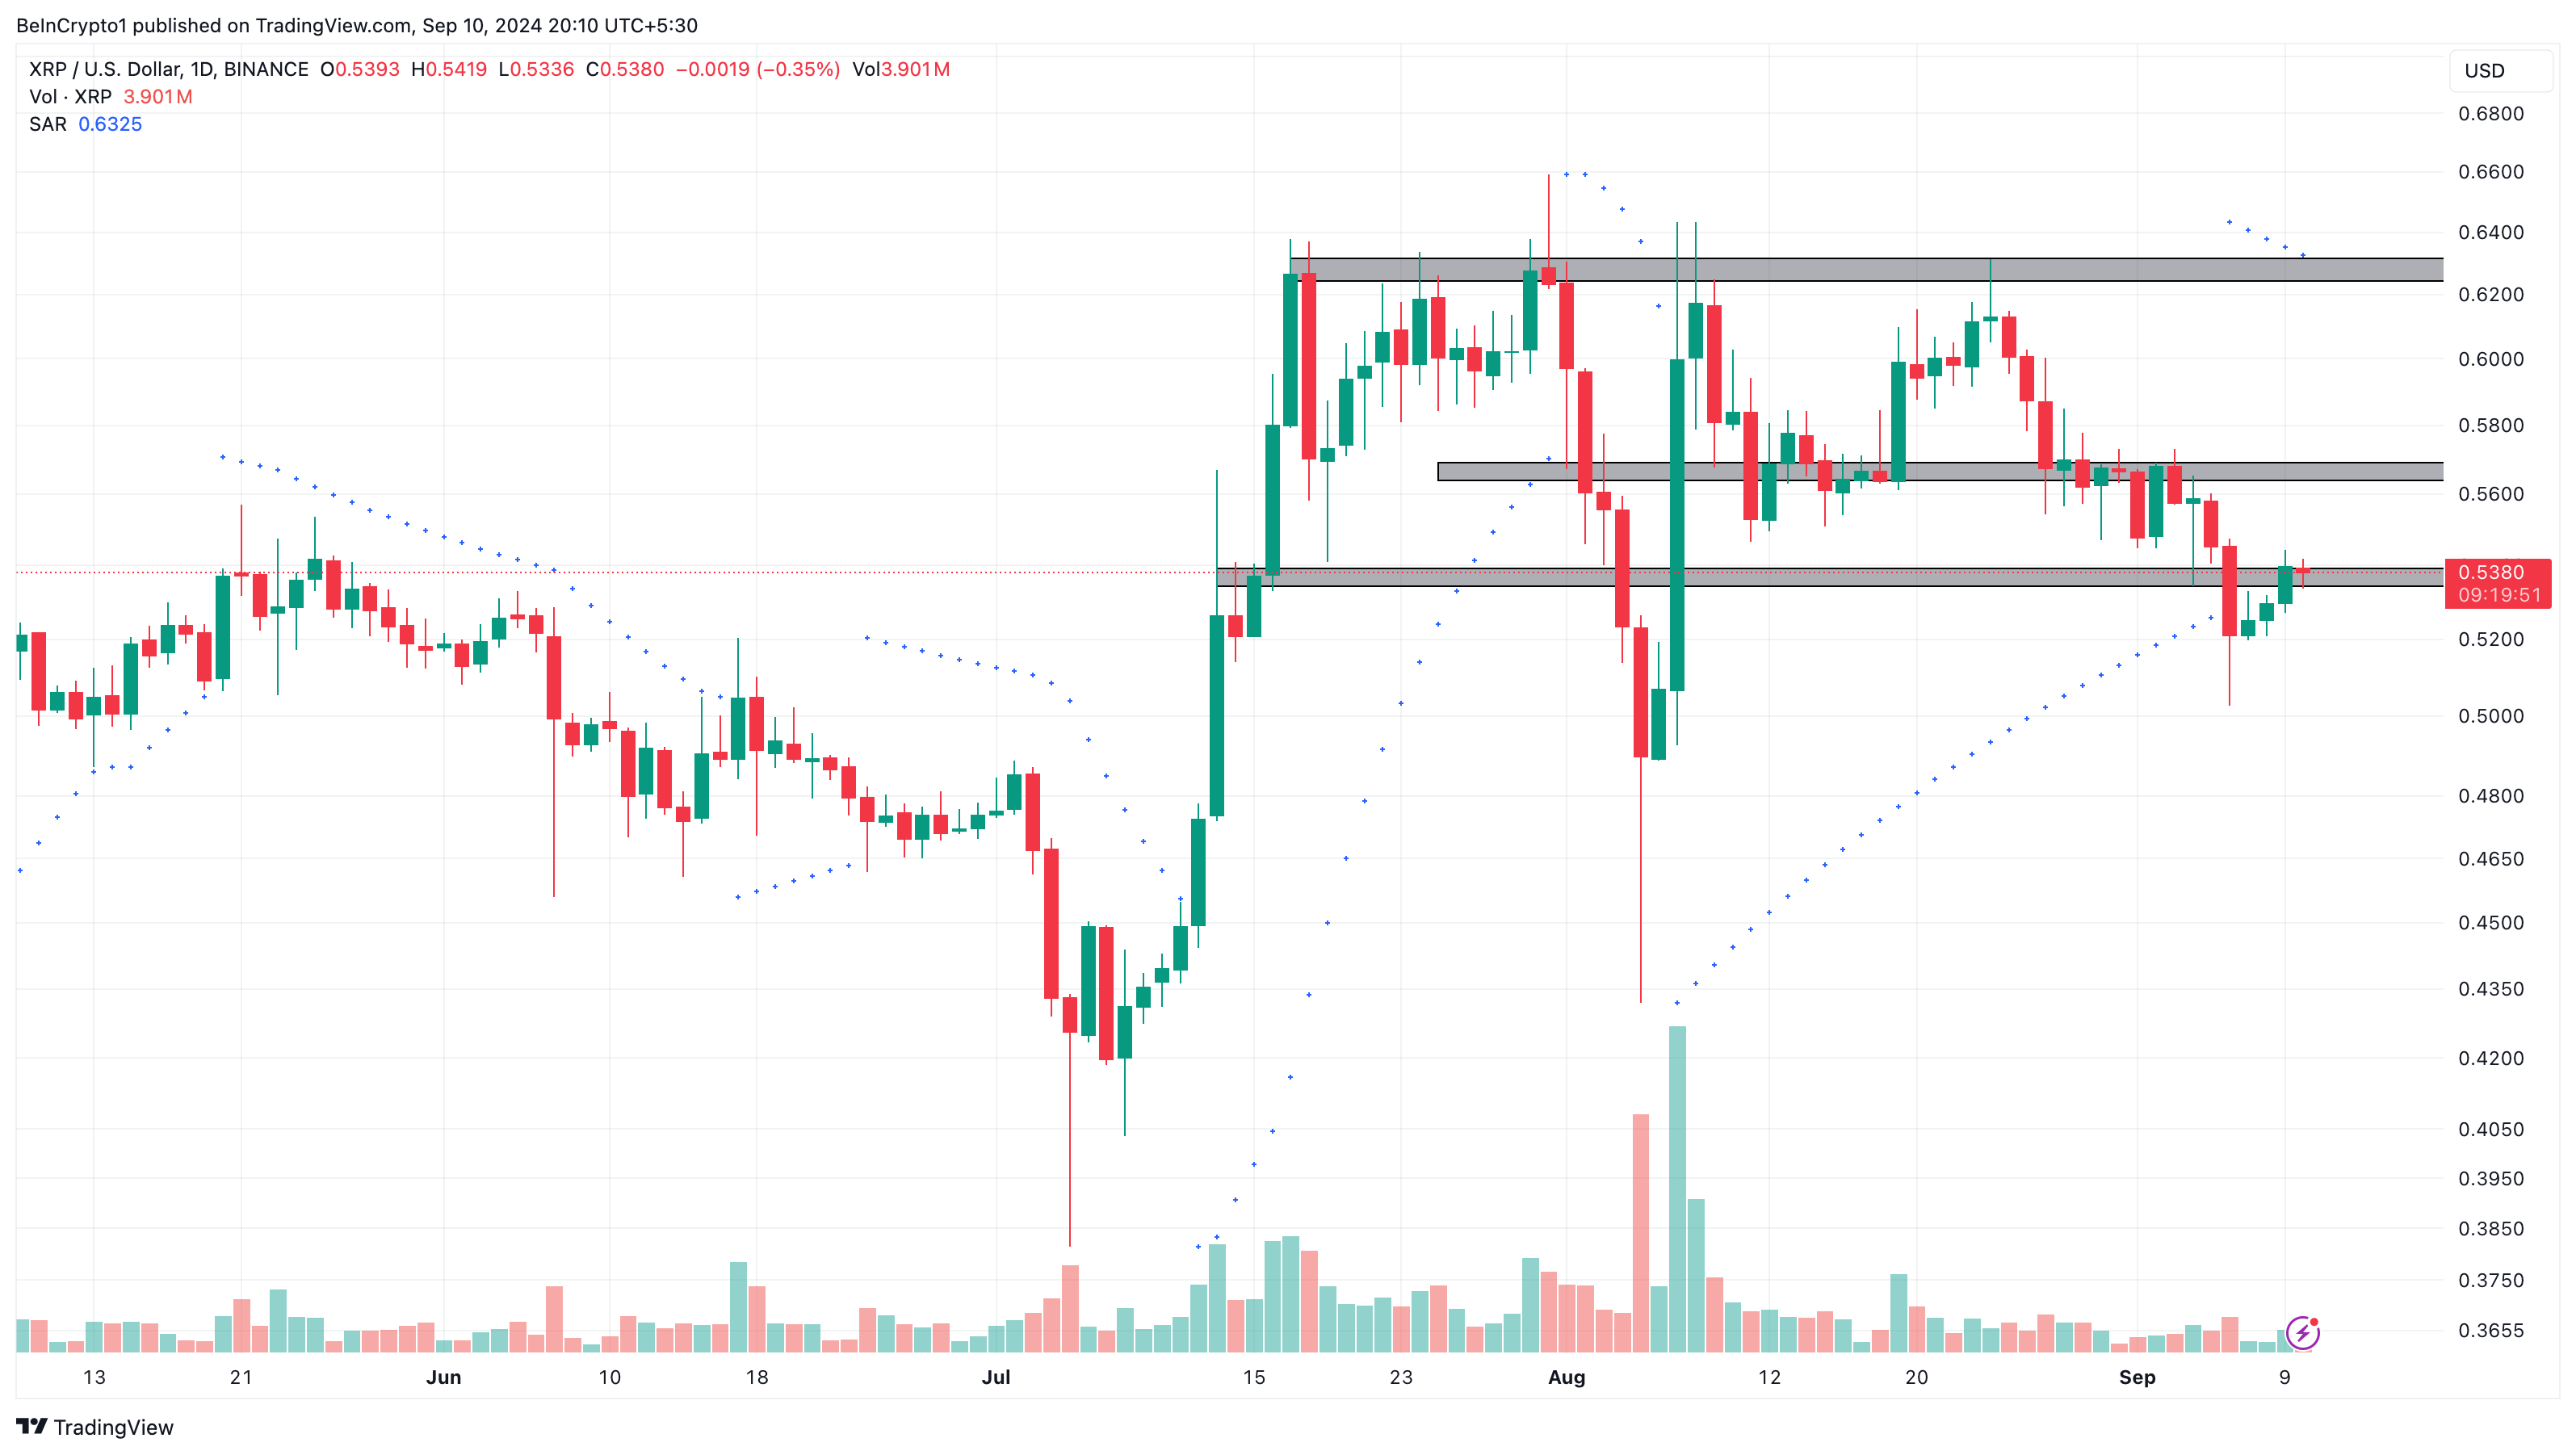
According to the daily chart, there is a supply zone around $0.57, a key level XRP has previously attempted to reach. However, as of now, XRP lacks the necessary buying pressure to retest this region.
The Parabolic Stop-and-Reverse (SAR) indicator supports this outlook. The SAR is a valuable technical tool used to identify trends and reversals. A bullish reversal for XRP typically occurs when the price crosses above the indicator’s dotted lines.On the flip side, a bearish reversal happens when the dotted lines move above the price.
In August, XRP’s price surged to $0.61 after the SAR indicated a bullish reversal. But at the time of writing, the dotted lines have positioned above the altcoin’s value, suggesting that it could face resistance between $0.57 and $0.63.
Read more: 10 Best Altcoin Exchanges In 2024

Secondly, Bull Bear Power (BBP), an indicator used to measure the strength of opposing forces in the market, aligns with the bias. When the BBP is positive, bulls have more power, which could help with a notable price increase.
However, in XRP’s situation, the BBP is in the negative region, suggesting that the selling pressure is intense and bears are in control.
XRP Price Prediction: Downtrend to $0.48
A closer analysis of the daily chart reveals the formation of a bearish twin peak on the Awesome Oscillator (AO). This pattern occurs when the green bars on the AO hit two successive peaks, with the second peak being lower than the first, signaling a potential downtrend.
As shown in the chart, XRP has developed this technical setup. This suggests that the token’s attempt to reach $0.55 might be unsuccessful, and it could face a downtrend, potentially falling below $0.48.
Read more: How To Buy XRP and Everything You Need To Know
However, this bearish outlook could be invalidated if XRP manages to break above $0.57. In that case, the cryptocurrency’s value could rise past $0.63, potentially reaching $0.65.
Disclaimer
In line with the Trust Project guidelines, this price analysis article is for informational purposes only and should not be considered financial or investment advice. BeInCrypto is committed to accurate, unbiased reporting, but market conditions are subject to change without notice. Always conduct your own research and consult with a professional before making any financial decisions. Please note that our Terms and Conditions, Privacy Policy, and Disclaimers have been updated.