
Market
Why Worldcoin Price Increase May Not Stop at $3

Worldcoin’s (WLD) price has increased by 10% in the last 24 hours, making it one of the best-performing altcoins in the top 100. This Worldcoin price increase puts the token’s value at $2.90.
However, according to several indicators, this rise might just be the beginning of a sustained rally that takes WLD higher. Here is how.
Worldcoin Rises Past Bearish Dominance, Volume Follow
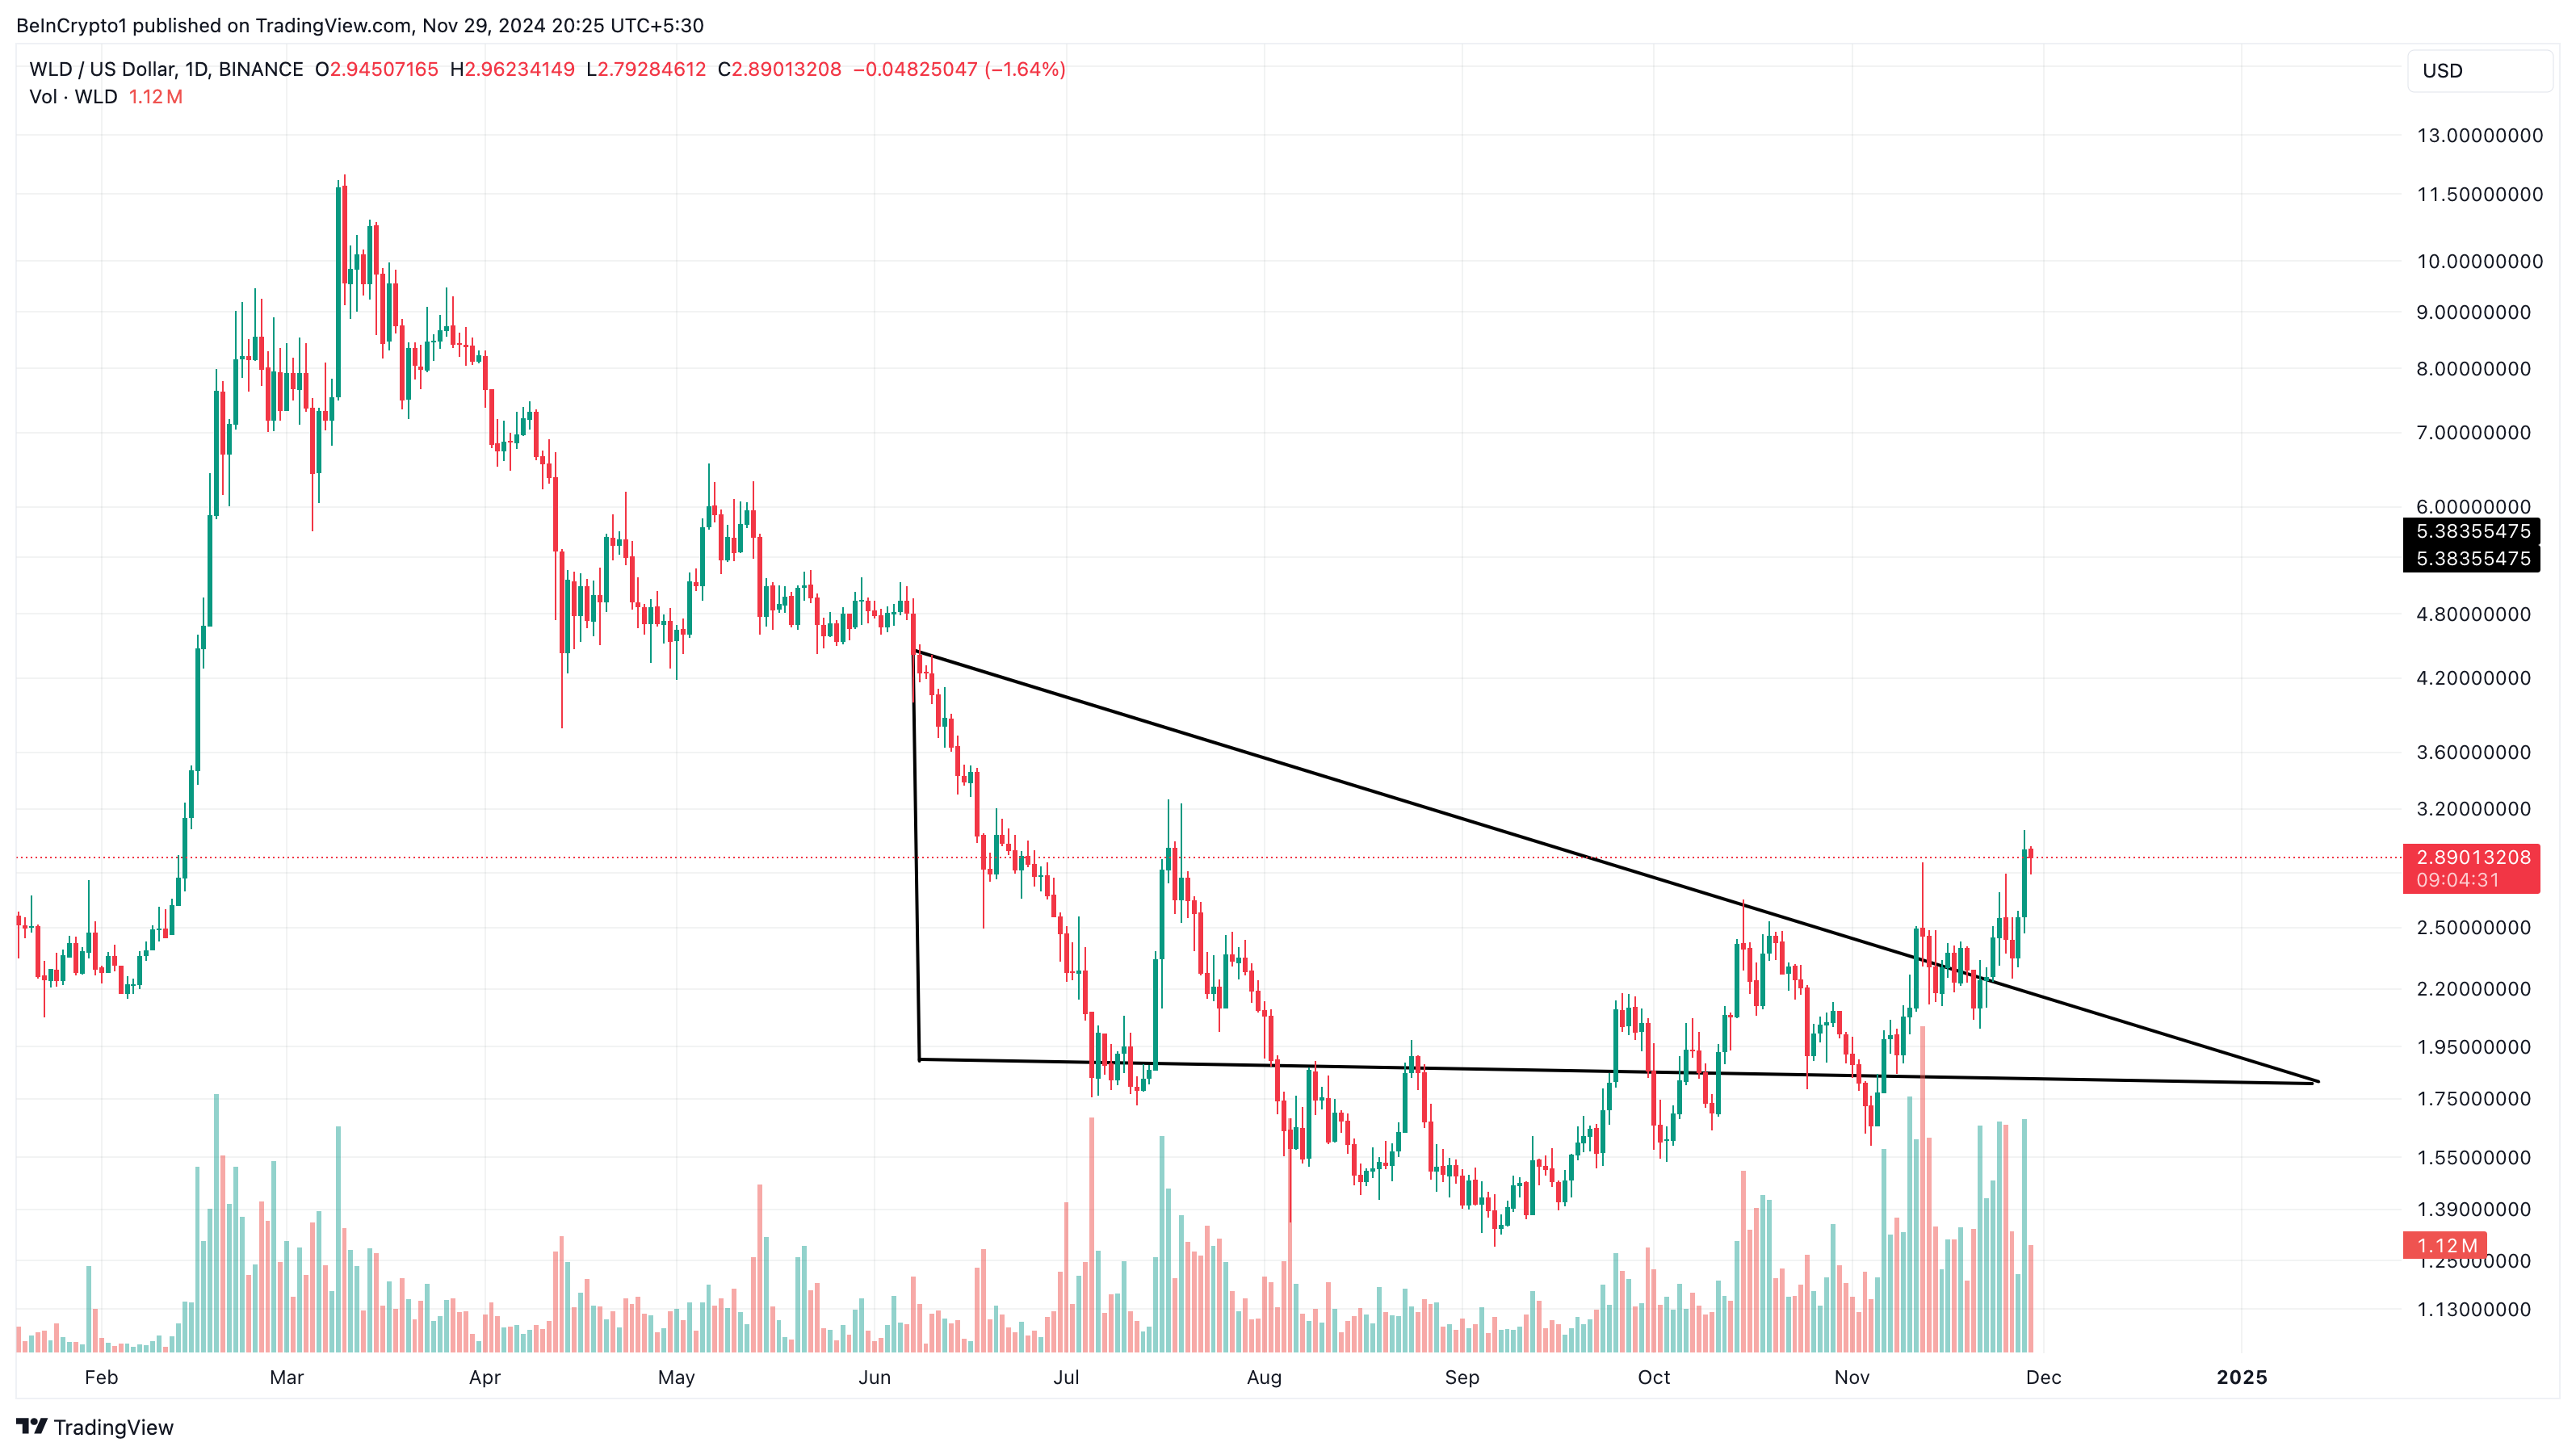
Between June 6 and November 21, WLD traded within a descending triangle. A descending triangle is a bearish chart pattern defined by a downward-sloping upper trendline and a flat, horizontal lower trendline. This formation typically signals potential downward price movement as sellers gain control.
When a cryptocurrency’s price breaks below the horizontal support, it indicates that the downtrend might intensify. But as of this writing, Worldcoin has broken out of it, indicating that the altcoin is on a bullish path.
If sustained, the Worldcoin’s price increase could go higher than $3 in the short term. However, to validate that, one has to assess the position of other metrics.
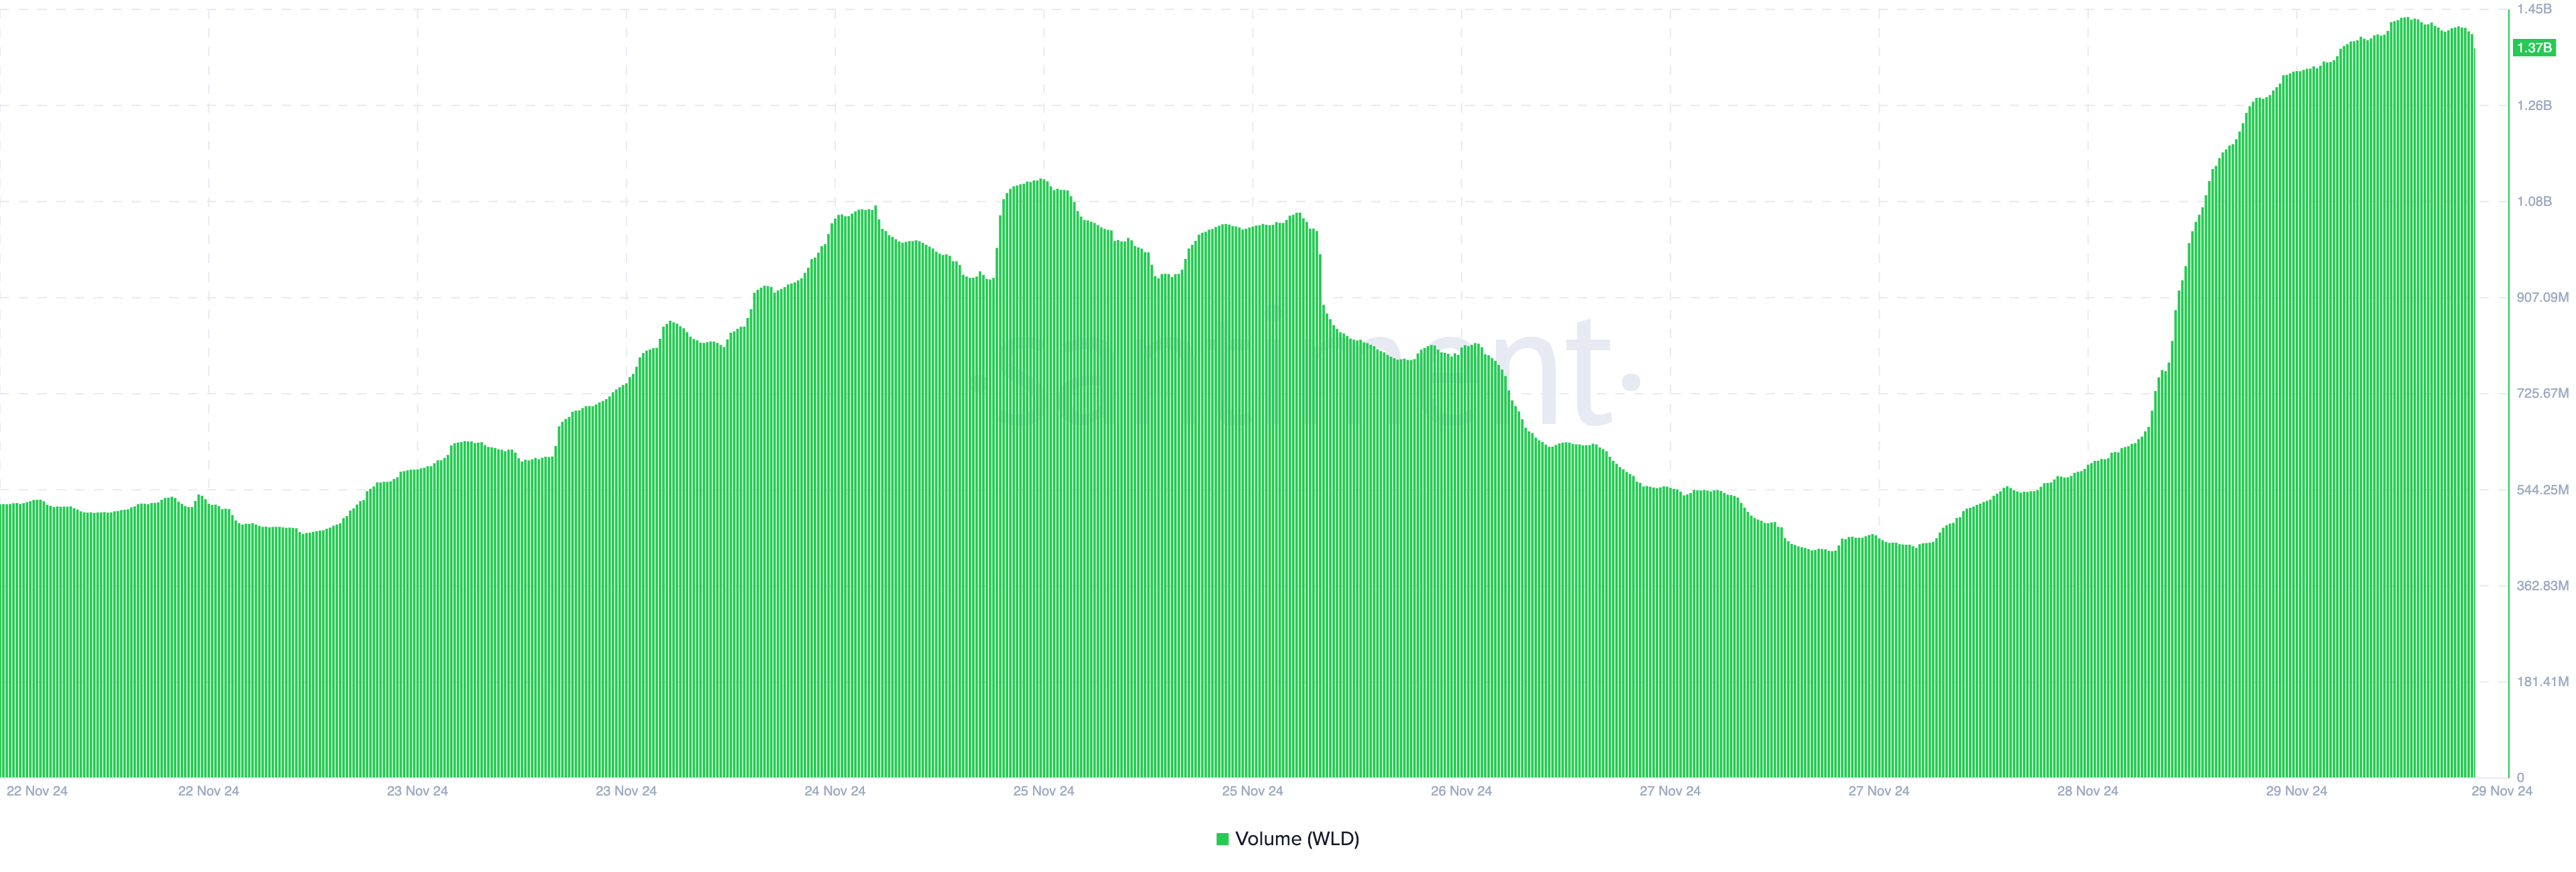
One metric supporting a further hike is WLD’s volume. The volume shows whether the market is actively trading a token. When it increases, more liquidity is flowing into the cryptocurrency.
On the other hand, if the volume drops, the crypto is less liquid. Furthermore, the volume can tell the direction in which the price can move. Typically, when the volume rises alongside the price, it means the trend is bullish.
However, falling volume on rising prices indicates that the uptrend is weak. Since the Worldcoin price increase coincides with a hike in volume, it suggests that the altcoin’s value might continue to rise.
WLD Price Prediction: $4, Then $5 Could Come
On the daily chart, Worldcoin’s price has risen above the 20- and 5-period Exponential Moving Average (EMA), a technical indicator that measures a cryptocurrency’s trend.
When the indicator goes downwards and is above the price, the trend is bearish. On the other hand, if the EMAs are below the price and rising, the trend is bullish. The last time such occurred, WLD price rallied above $11.
Should the pattern rhyme with the historical trend, Worldcoin’s price might rise to $3.92. If bulls sustain the trend, then the altcoin might climb above $4 and possibly to $5.10.
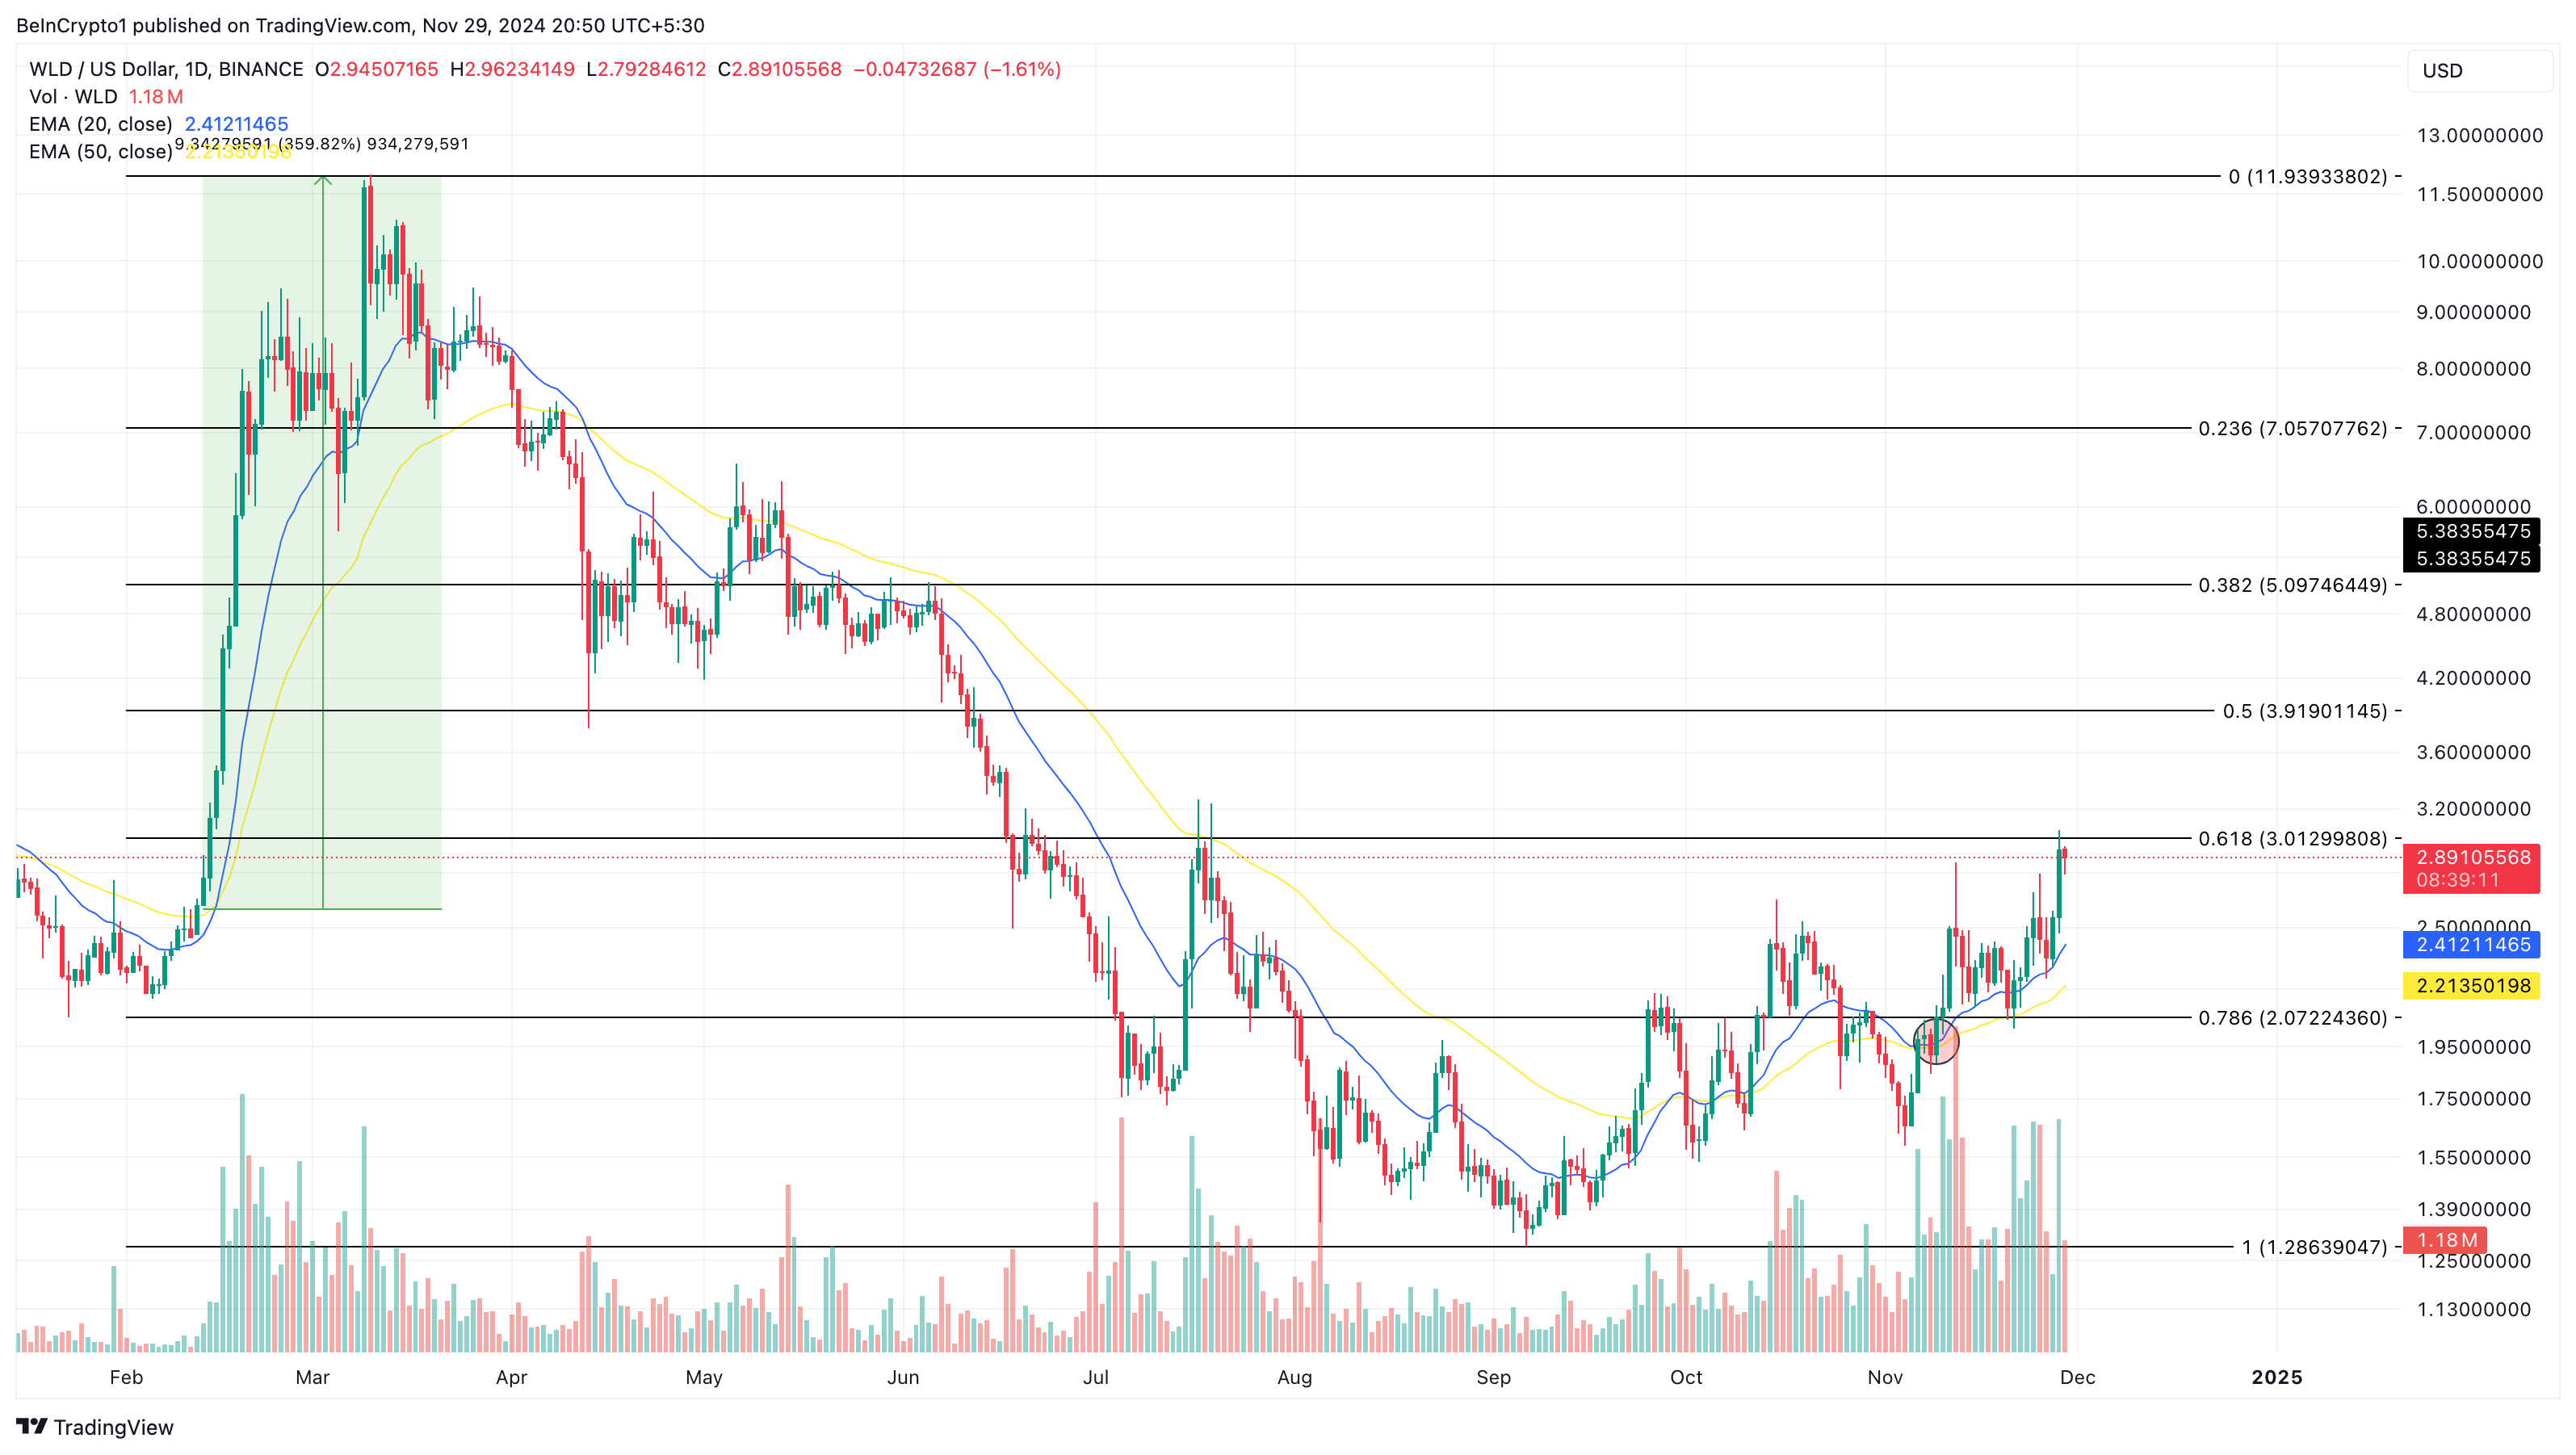
However, should the token drop below the EMA again, the WLD price prediction might not come to pass. Instead, it might decline to $2.07.
Disclaimer
In line with the Trust Project guidelines, this price analysis article is for informational purposes only and should not be considered financial or investment advice. BeInCrypto is committed to accurate, unbiased reporting, but market conditions are subject to change without notice. Always conduct your own research and consult with a professional before making any financial decisions. Please note that our Terms and Conditions, Privacy Policy, and Disclaimers have been updated.


Solana started a fresh decline below the $112 support zone. SOL price is now consolidating and might struggle to stay above the $100 support zone.
- SOL price started a fresh decline below $112 support zone against the US Dollar.
- The price is now trading below $105 and the 100-hourly simple moving average.
- There was a break below a key contracting triangle with support at $118 on the hourly chart of the SOL/USD pair (data source from Kraken).
- The pair could accelerate lower if there is a break below the $100 support zone.
Solana Price Dips Over 15%
Solana price started a fresh decline below the $122 and $115 levels, like Bitcoin and Ethereum. SOL even declined below the $112 support level to enter a bearish zone.
There was a break below a key contracting triangle with support at $118 on the hourly chart of the SOL/USD pair. The price declined over 15% and traded close to the $102 level. A low was formed at $102 and the price recently started a consolidation phase.
The current price action is still very bearish below 23.6% Fib retracement level of the downward move from the $121 swing high to the $102 low. Solana is now trading below $105 and the 100-hourly simple moving average.
On the upside, the price is facing resistance near the $105 level. The next major resistance is near the $112 level or the 50% Fib retracement level of the downward move from the $121 swing high to the $102 low. The main resistance could be $116.

A successful close above the $116 resistance zone could set the pace for another steady increase. The next key resistance is $120. Any more gains might send the price toward the $125 level.
Another Decline in SOL?
If SOL fails to rise above the $105 resistance, it could start another decline. Initial support on the downside is near the $102 zone. The first major support is near the $100 level.
A break below the $100 level might send the price toward the $92 zone. If there is a close below the $92 support, the price could decline toward the $84 support in the near term.
Technical Indicators
Hourly MACD – The MACD for SOL/USD is gaining pace in the bearish zone.
Hourly Hours RSI (Relative Strength Index) – The RSI for SOL/USD is below the 50 level.
Major Support Levels – $102 and $100.
Major Resistance Levels – $105 and $112.

Bitcoin fell below the $80,000 mark on Sunday as investor sentiment weakened across global markets. The move came alongside a spike in daily liquidations, which totaled $590 million.
Heightened anxiety over former President Donald Trump’s proposed tariffs and escalating geopolitical tensions weighed heavily on risk assets.
More Traders are Shorting Bitcoin After the Worst Q1 In a Decade
The long-short ratio for Bitcoin dropped to 0.89, with short positions now accounting for nearly 53% of activity. The shift reflects growing skepticism about Bitcoin’s short-term direction.
Traditional markets also suffered sharp losses. The Nasdaq 100, S&P 500, and Dow Jones all entered correction territory last week, posting their worst weekly performance since 2020.
Bitcoin closed the first quarter with a loss of 11.7%, making it the weakest Q1 since 2014.
The broader crypto market lost 2.45% on Sunday, reducing total market capitalization to $2.59 trillion. Bitcoin remains the dominant asset, holding 62% of the market share. Ethereum follows with 8%.
Sunday’s selloff triggered $252.79 million in crypto derivatives liquidations. Long positions made up the bulk of that figure at $207 million. Ethereum traders accounted for about $72 million in long liquidations alone.
Bitcoin’s price remains closely tied to shifts in global liquidity, often reflecting broader macro trends. With U.S. markets set to open Monday, this weekend’s activity signals continued volatility ahead.
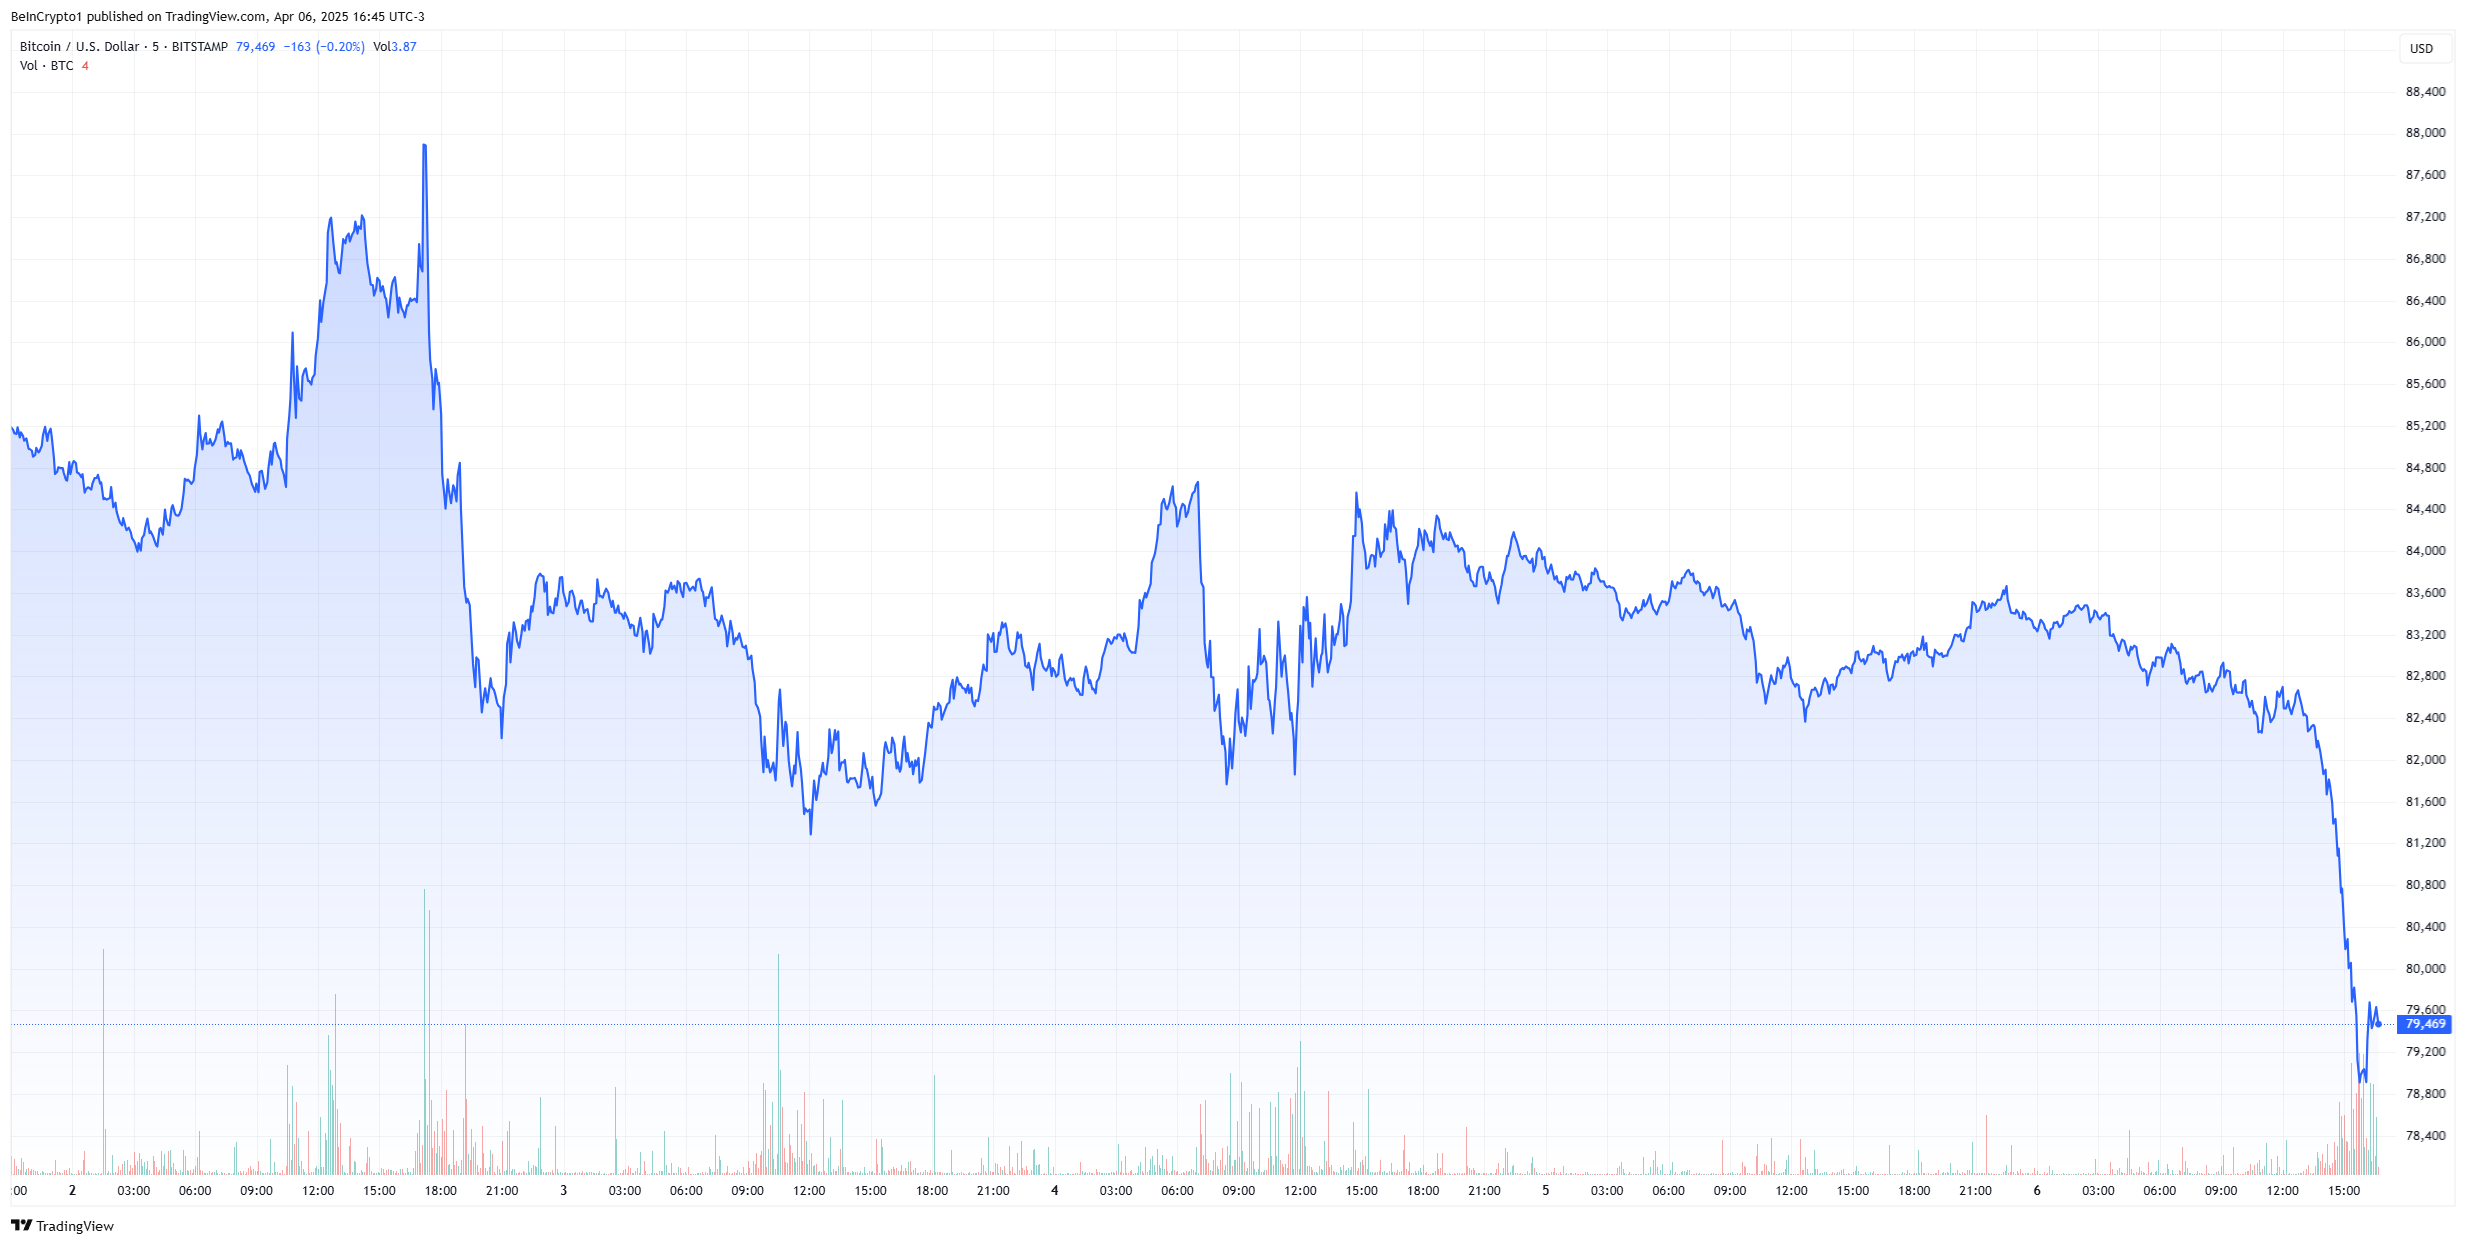
Investors may face more pressure after Federal Reserve Chair Jerome Powell warned that Trump’s tariff plans could push inflation higher while slowing economic growth.
That combination raises the risk of stagflation, a situation where policy tools become less effective. Efforts to stimulate the economy can worsen inflation, while measures to control prices can limit growth.
Disclaimer
In adherence to the Trust Project guidelines, BeInCrypto is committed to unbiased, transparent reporting. This news article aims to provide accurate, timely information. However, readers are advised to verify facts independently and consult with a professional before making any decisions based on this content. Please note that our Terms and Conditions, Privacy Policy, and Disclaimers have been updated.

Avalanche (AVAX) price has been unable to reclaim the $20.00 support level after falling through it in the recent correction. The altcoin is now trading well below that key mark despite a noticeable decline in selling pressure.
However, bullish momentum has not been strong enough to counter prevailing bearish cues.
Avalanche Investors Are Not Selling
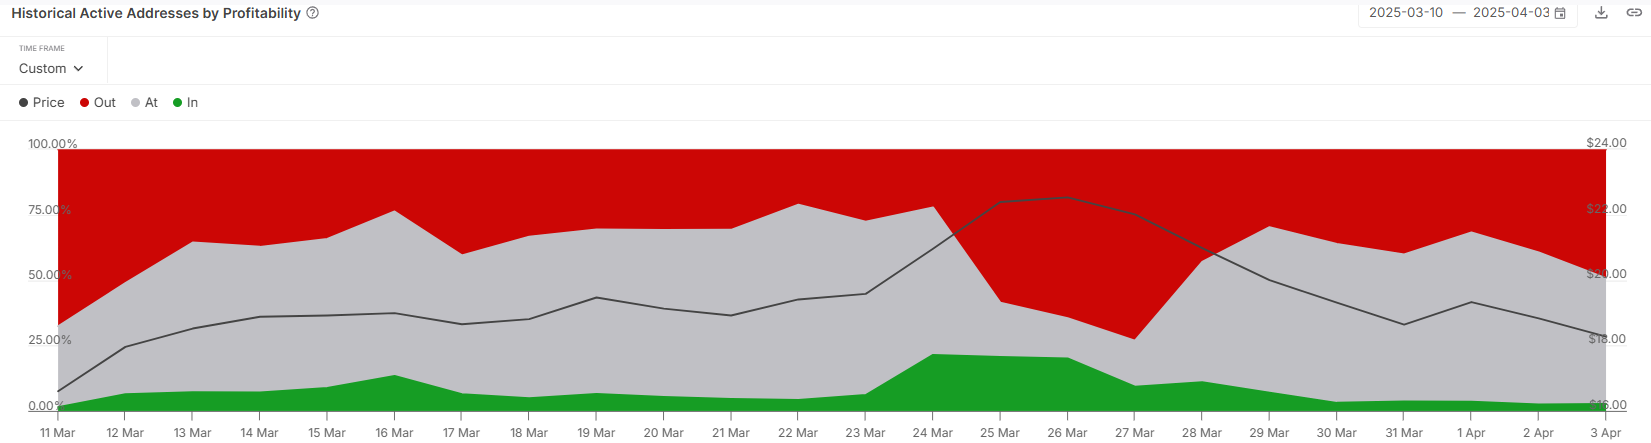
Analyzing the active address profitability reveals that less than 3% of current participants are in profit. This data highlights a crucial detail: most AVAX holders are unwilling to sell at a loss. Instead, they appear to be HODLing in anticipation of a recovery. This lack of selling is a bullish indicator.
The patience shown by investors during this downturn could help Avalanche establish a stronger base once broader market conditions stabilize. As fewer holders are actively selling, downward pressure on AVAX’s price is reduced. Given the right market catalysts, this opens a window for the altcoin to bounce back.
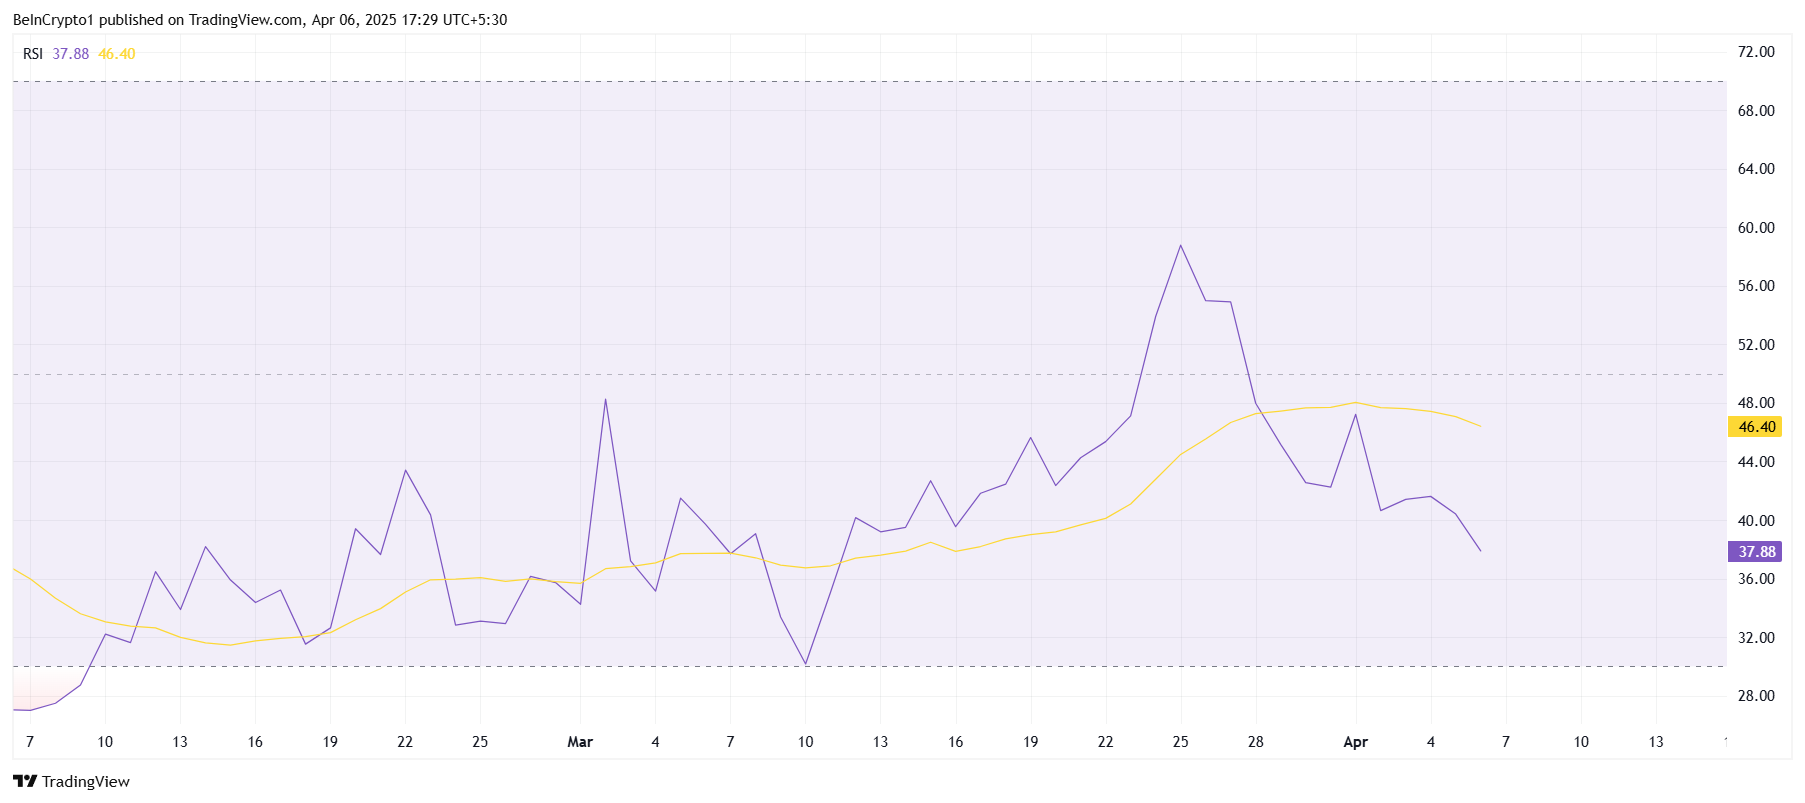
Despite low selling activity, the technical indicators continue to signal weakness. The Relative Strength Index (RSI) has dropped back into the bearish zone after a brief recovery attempt. This suggests a lack of buying pressure and continued uncertainty among investors.
Market support has been lacking for AVAX in recent sessions, preventing a meaningful rebound. The altcoin is facing consistent resistance and has failed to generate strong upward momentum.
The RSI trend reinforces that the macro environment is still leaning bearish, keeping Avalanche subdued.
AVAX Price Is Vulnerable
Avalanche is currently priced at $17.19, marking a 25% decline over the past two weeks. The sharp drop came after AVAX failed to break through the $22.87 resistance level. This rejection led to the current consolidation below $20.00, with bulls unable to reverse the trend.
Given the existing market cues, Avalanche may struggle to reclaim $18.27 as a support level. If the altcoin fails to secure this level, it risks dropping further to $16.25. This would deepen investor losses and delay any chances of recovery.
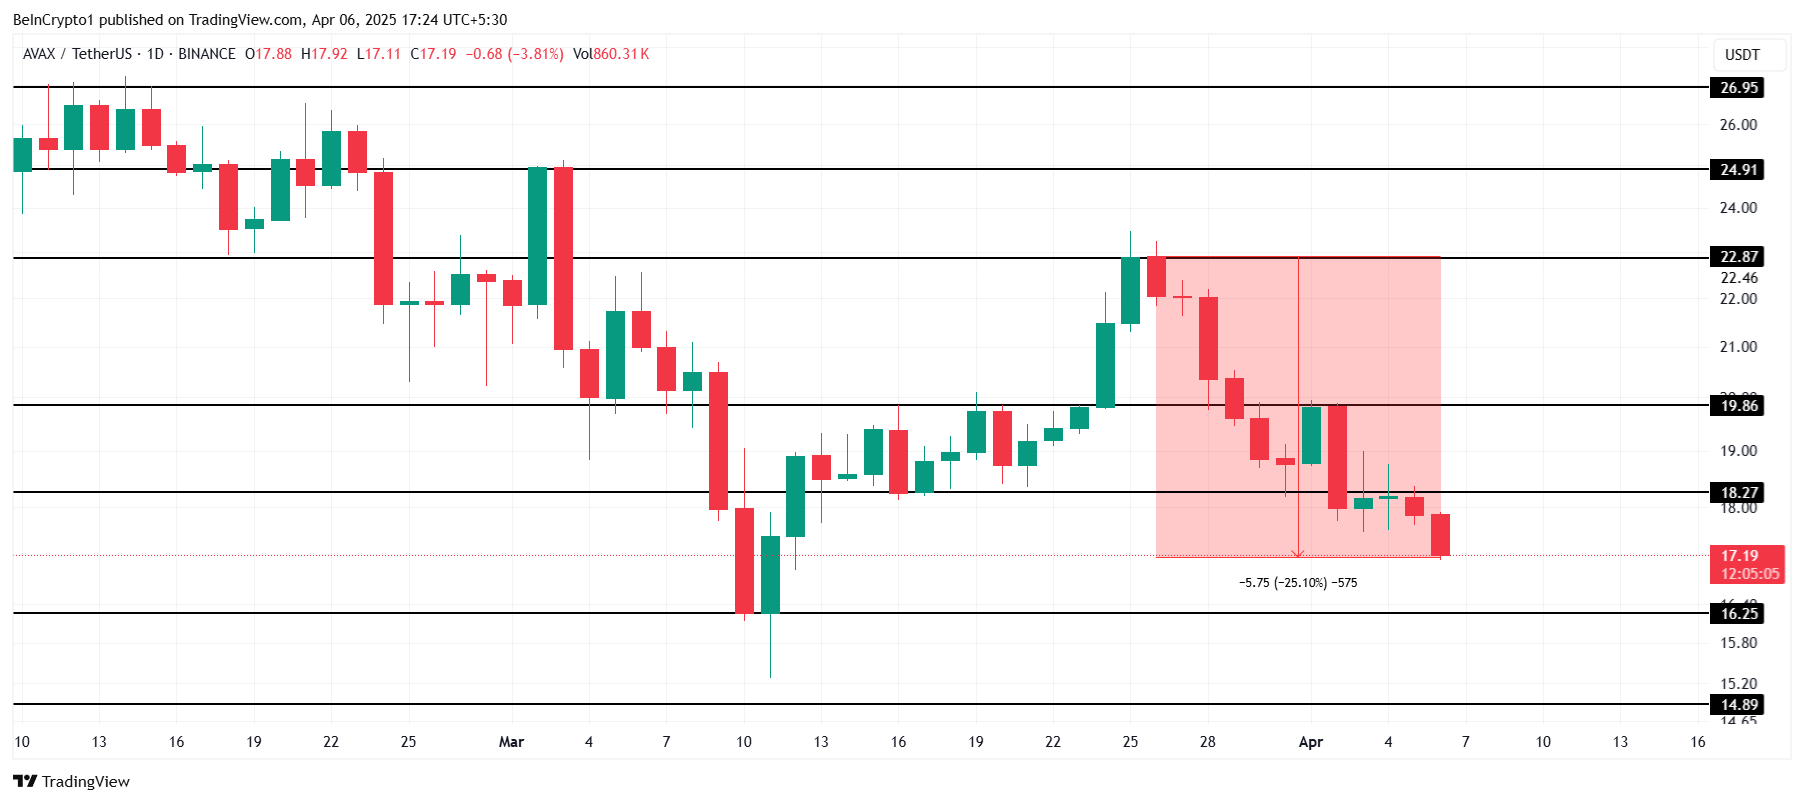
On the upside, a key shift would occur if AVAX can flip $19.86 into support. This would suggest strengthening bullish sentiment and open the door for a rally toward $22.87. Reclaiming this level could allow Avalanche to recover some recent losses and restore investor confidence.
Disclaimer
In line with the Trust Project guidelines, this price analysis article is for informational purposes only and should not be considered financial or investment advice. BeInCrypto is committed to accurate, unbiased reporting, but market conditions are subject to change without notice. Always conduct your own research and consult with a professional before making any financial decisions. Please note that our Terms and Conditions, Privacy Policy, and Disclaimers have been updated.

Solana (SOL) Freefall—Can It Hold Above The $100 Danger Zone?

Ethereum Supply On Exchanges Plummets – Is A Supply Squeeze Coming?

Bitcoin Price Drops Below $80,000 Amid Heavy Weekend Selloff

Expert Reveals Decentralized Strategy To Stabilize Pi Network Price

Avalanche Price Holds Under $20, Low Selling Can’t Lift Price

Justin Sun Claims First Digital Trust Fraud Exceeds Impact of FTX


-
 Altcoin23 hours ago
Bitcoin Holds $83K Despite Macro Heat, What’s Happening?
-

 Ethereum24 hours ago
Ethereum Whales Dump 500,000 ETH In 48 Hours: On-Chain Data
-
 Market19 hours ago
XRP High Stakes Setup: Analyst Warns Of Sharp Move To $17 Or $0.65
-

 Market17 hours ago
HBAR Could Avoid $30 Million Liquidation Thanks to Death Cross
-

 Ethereum22 hours ago
Is Ethereum Price Nearing A Bottom? This Bullish Divergence Suggests So
-

 Altcoin21 hours ago
Has The Dogecoin Price Bottomed Out? Analyst Points Out ‘Critical Decision Zone’
-

 Ethereum20 hours ago
Ethereum Whale Activity Fades Since Late February – Details
-

 Market16 hours ago
Conor McGregor’s Crypto Token REAL Tanks After Launch
 Arabic
 Chinese (Simplified)
 Dutch
Dutch English
 French
 German
 Italian
 Portuguese
 Russian
 Spanish
 Vietnamese