Market
Why the XLM Price Rally May Reach the $0.91 All-Time High

Stellar (XLM) has been steadily gaining momentum in recent days, currently trading at $0.52 — a 127% increase over the past week.
Strengthening buying pressure is pushing XLM closer to reclaiming its all-time high of $0.91, which it last reached in January 2018.
Stellar’s Uptrend Continues To Strengthen
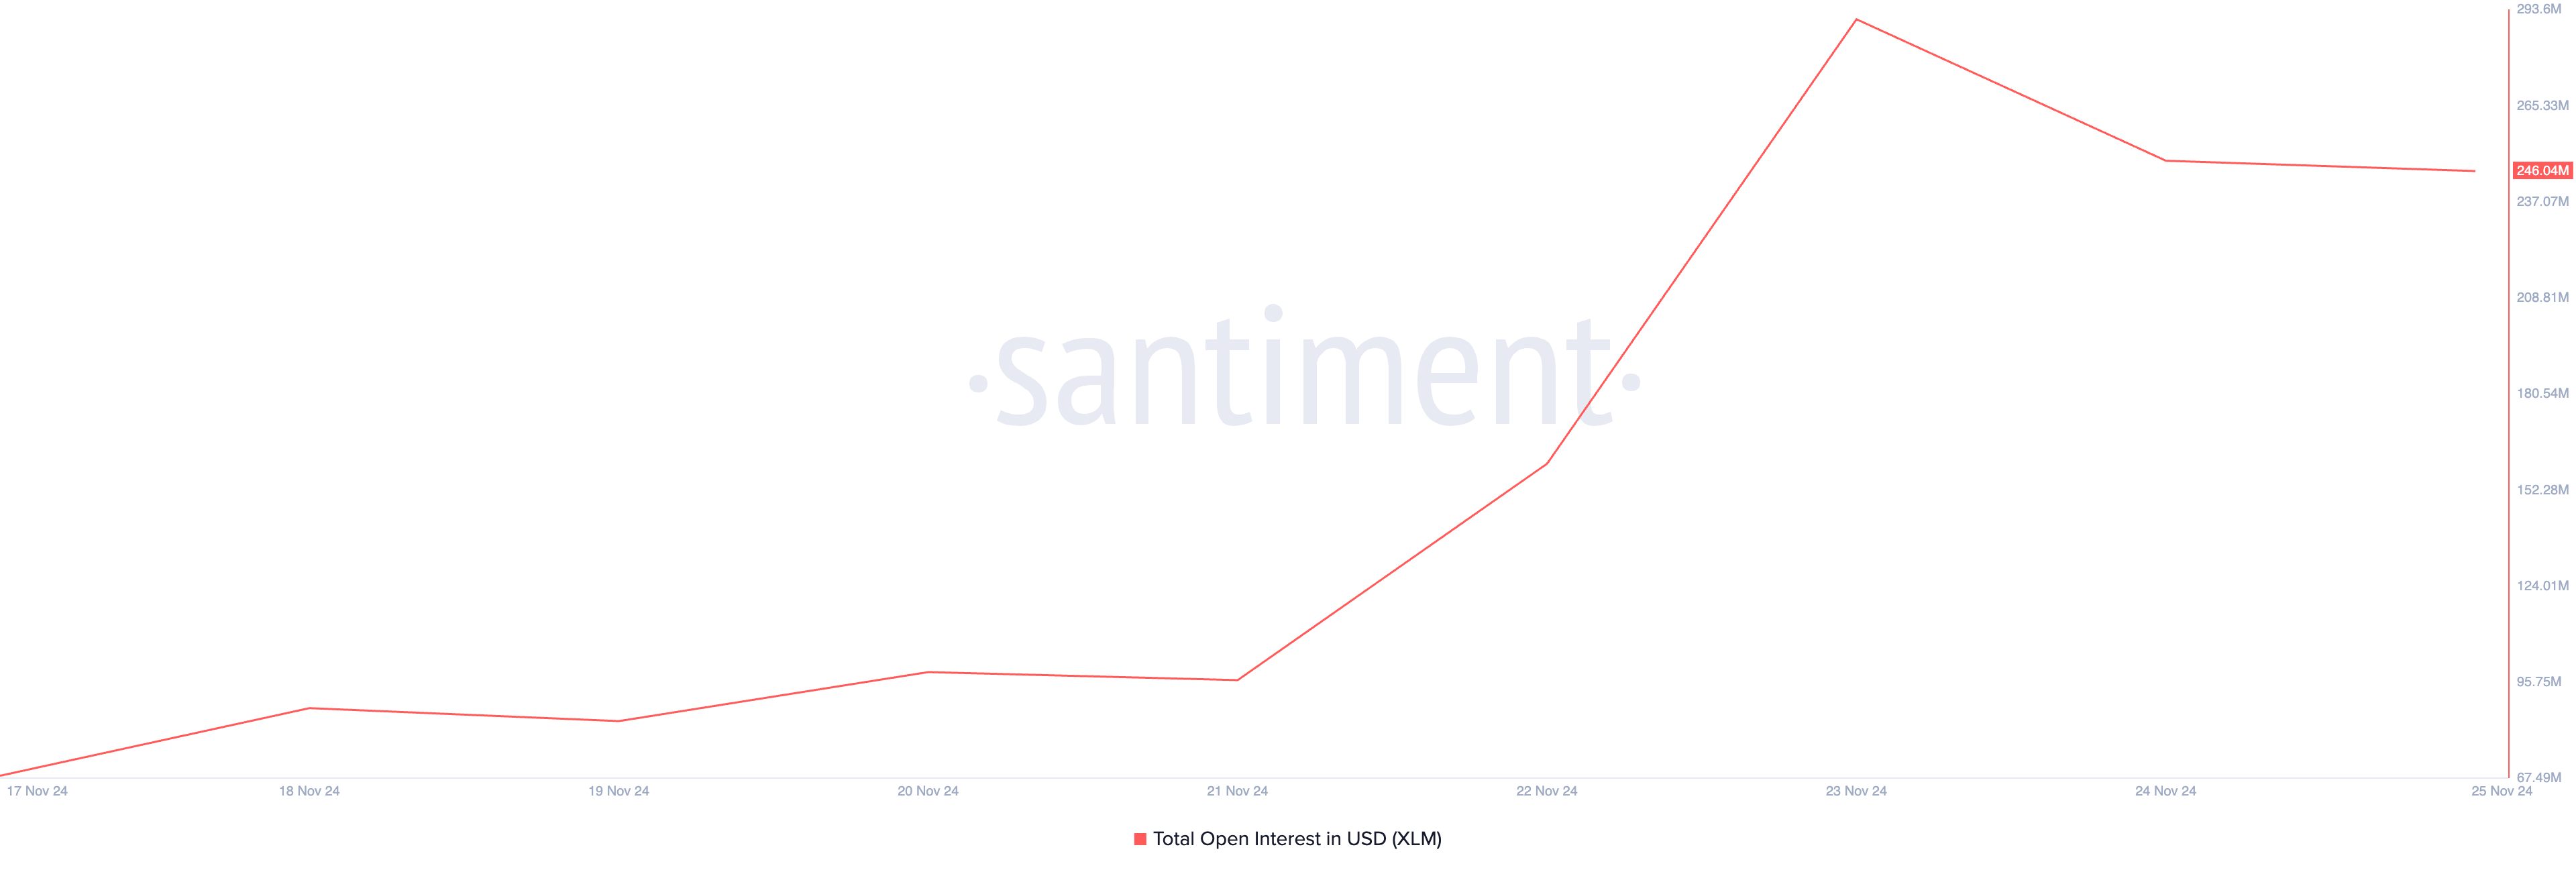
XLM’s rising open interest indicates heightened market activity and confirms strong investor confidence. On Saturday, the token’s open interest climbed to an all-time high of $291 million.
Open interest measures the total number of outstanding contracts in the futures or options market that have not been settled or closed. When it climbs during a price rally, it indicates that new money is entering the market. This reinforces the upward price movement and signals strong market conviction.
This trend in the XLM market suggests that traders are increasingly confident in the sustainability of its rally, which may drive its price higher.
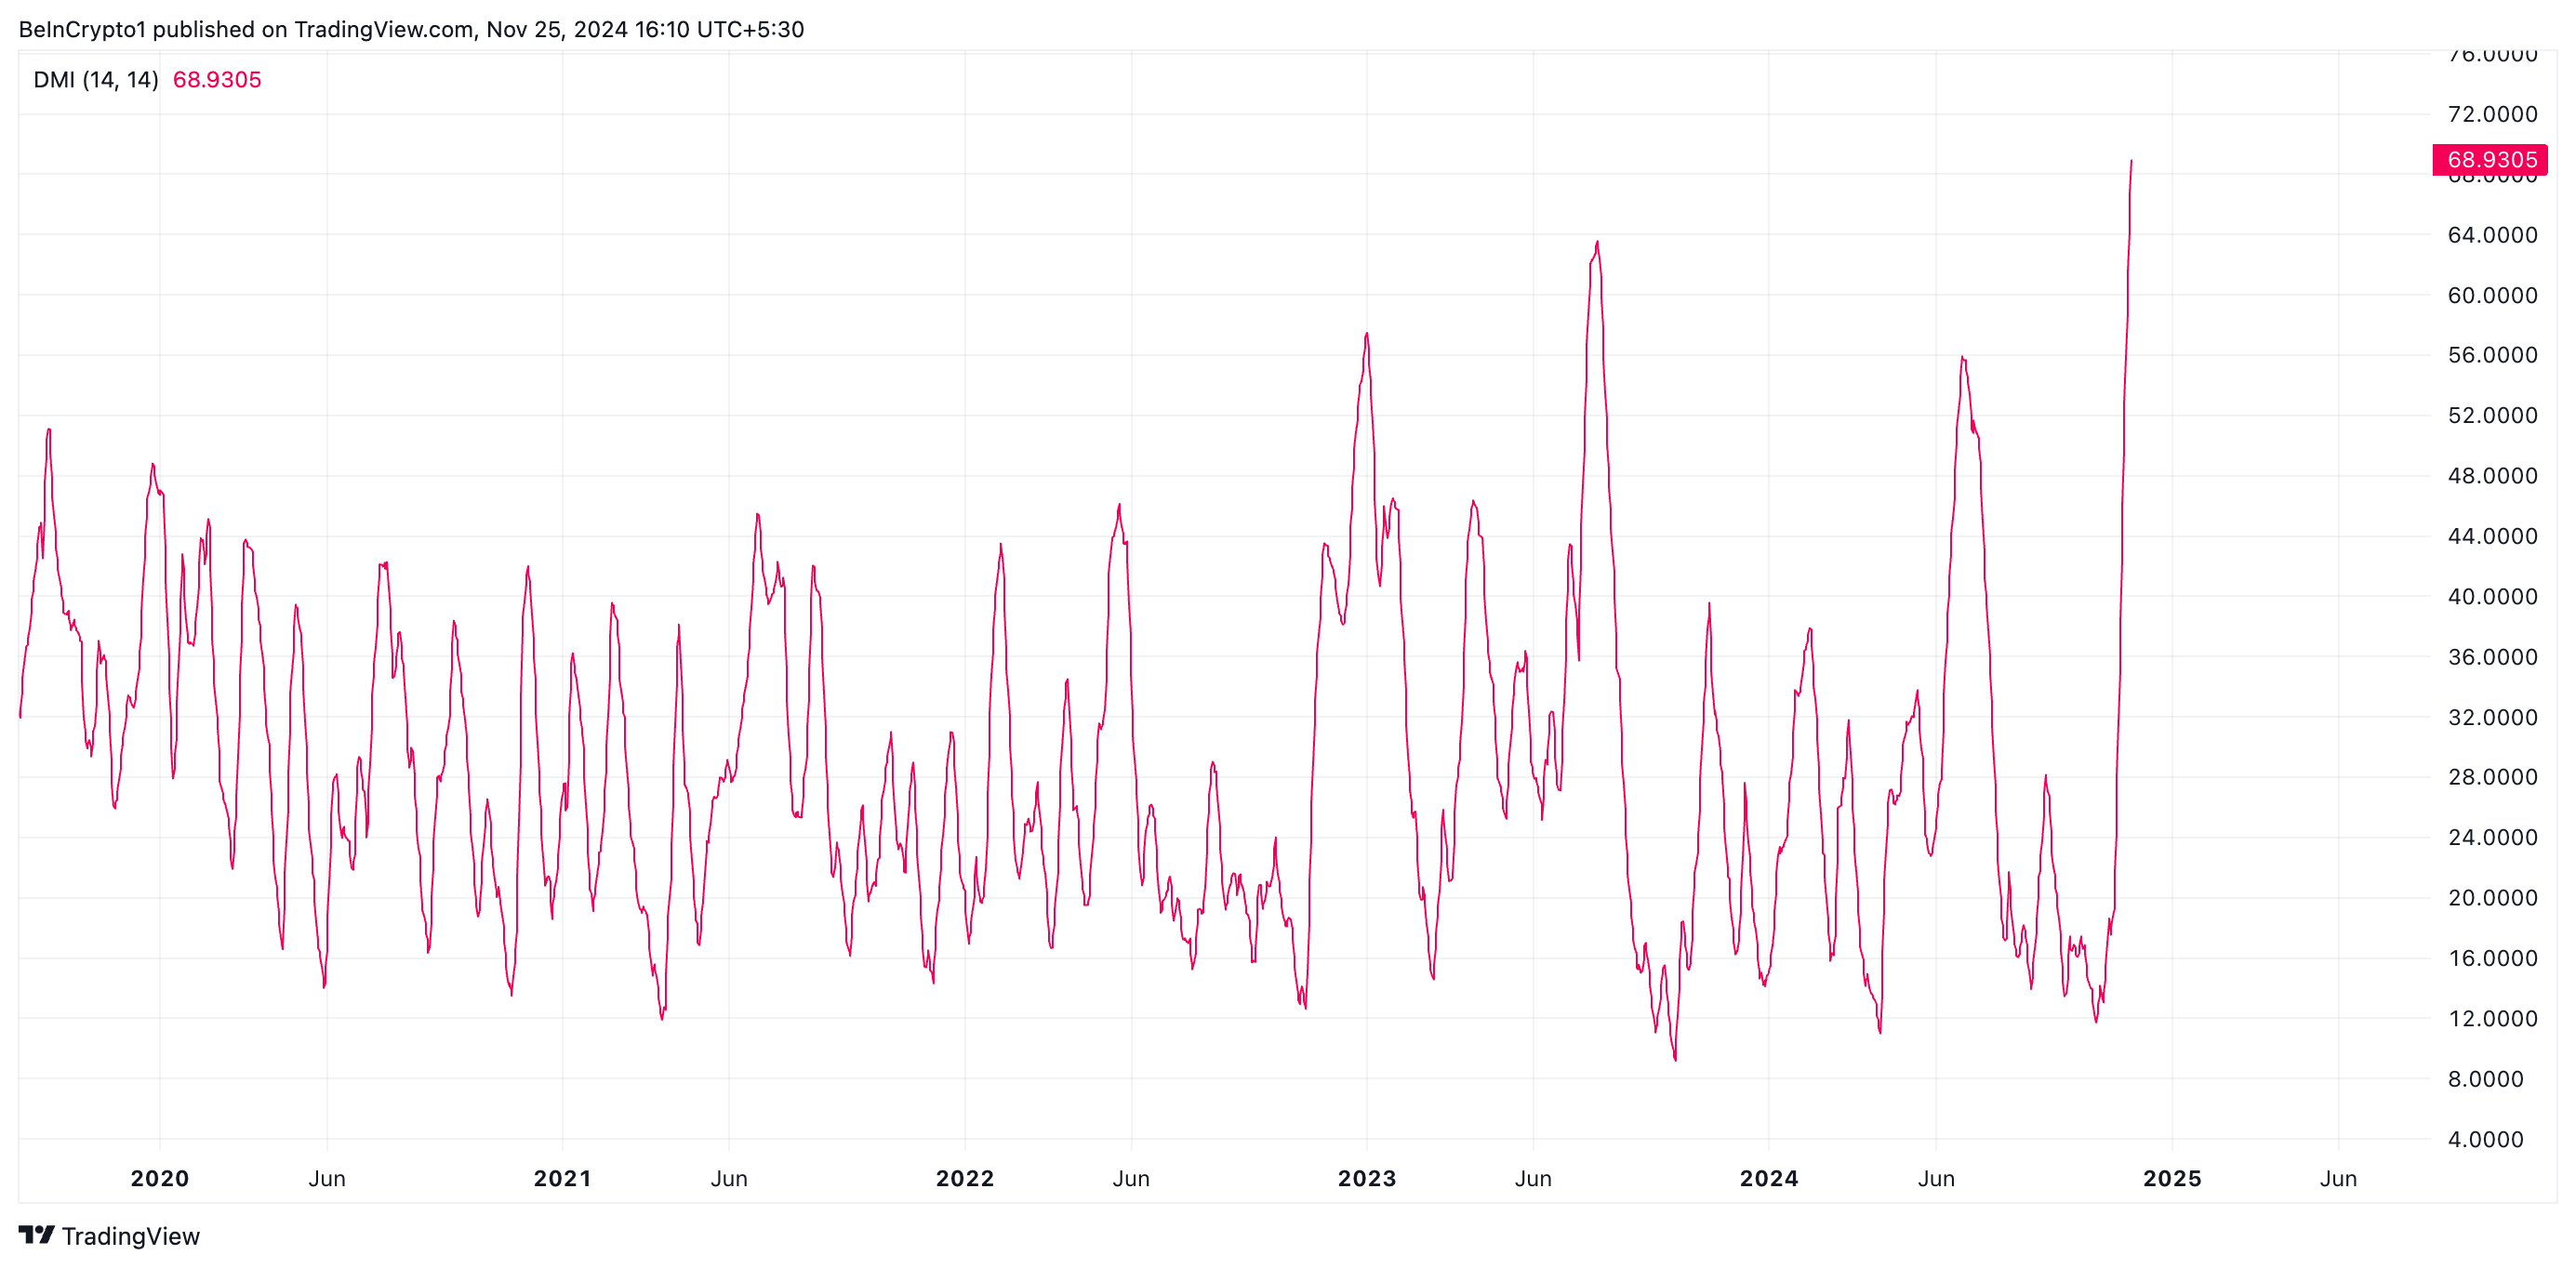
Furthermore, readings from its Average Directional Index (ADX) confirm this bullish outlook. As of this writing, XLM’s ADX is in an upward trend at 68.93.
The ADX measures the strength of a market trend, ranging from 0 to 100. An ADX reading of 68 indicates an extremely strong uptrend. This high value suggests that XLM’s current trend is likely to persist.
XLM Price Prediction: Token May Rally Toward All-Time High
XLM is currently trading just below a key resistance level at $0.58. Breaking through this critical price point could pave the way for a surge to $0.71. Sustained buying momentum at this level may position XLM to reclaim its all-time high of $0.91.
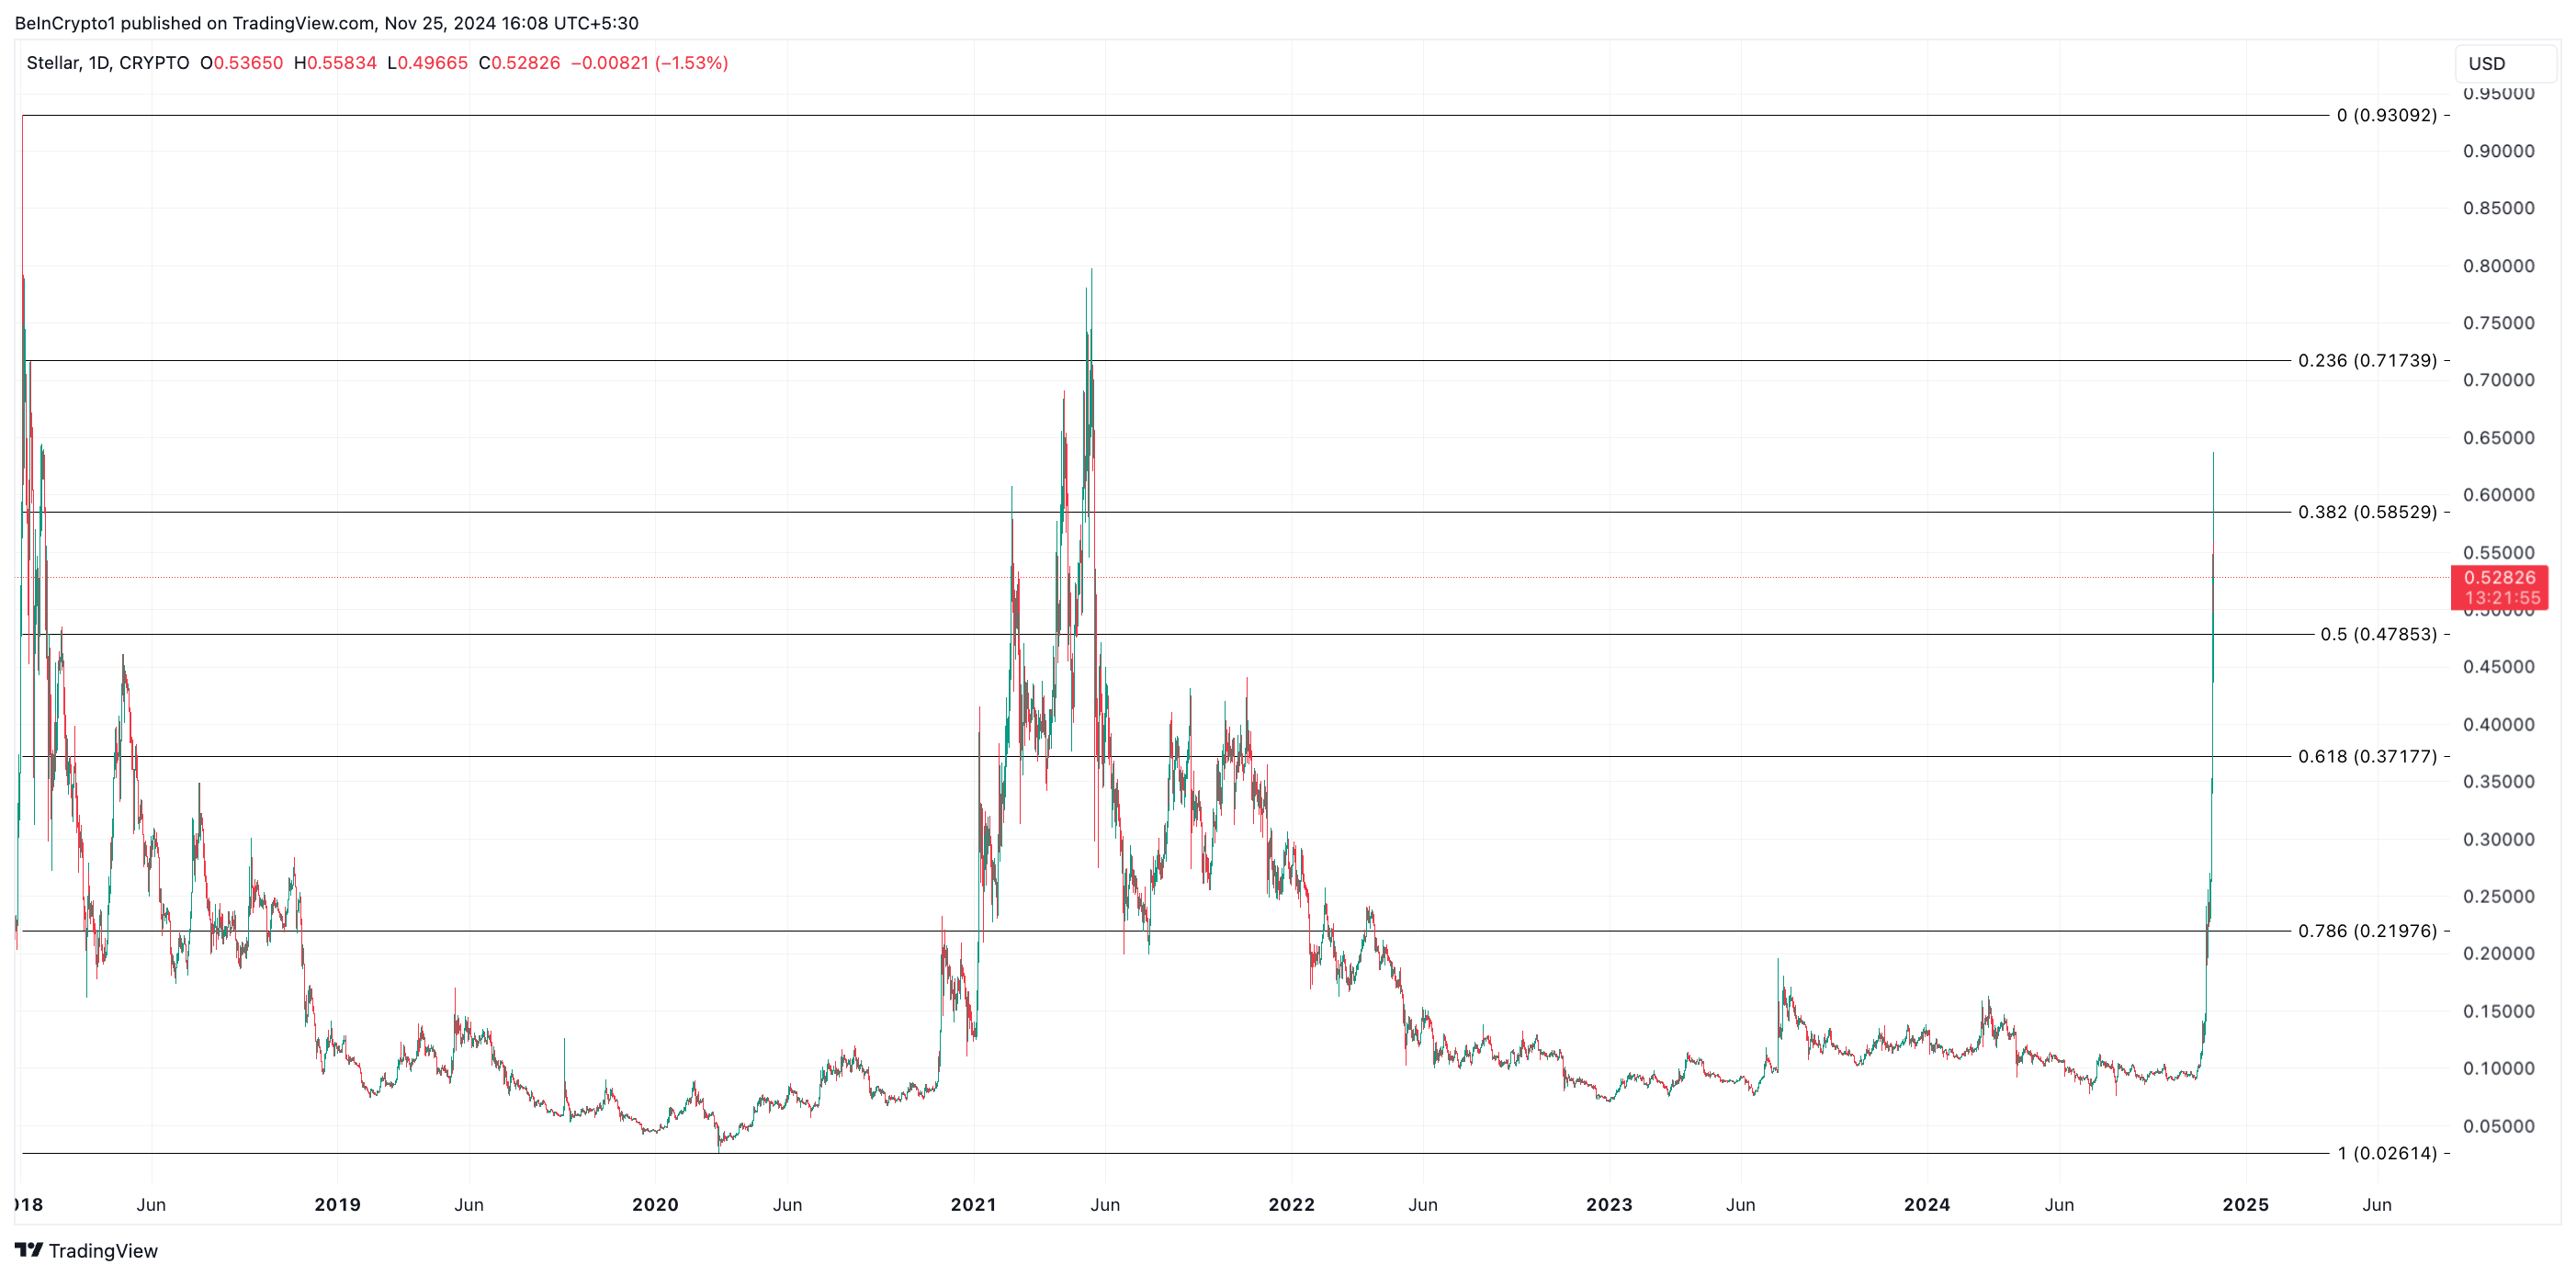
However, if buyer exhaustion sets in, XLM’s price will fall toward support at $0.47, invalidating this bullish outlook.
Disclaimer
In line with the Trust Project guidelines, this price analysis article is for informational purposes only and should not be considered financial or investment advice. BeInCrypto is committed to accurate, unbiased reporting, but market conditions are subject to change without notice. Always conduct your own research and consult with a professional before making any financial decisions. Please note that our Terms and Conditions, Privacy Policy, and Disclaimers have been updated.
Market
Meme Coin FARTCOIN Hits Two-Month High, Could It Reach $1?

The Solana-based meme coin FARTCOIN has once again claimed its spot as the market’s top gainer, surging to a two-month high of $0.73.
It has seen an impressive 39% price increase over the past 24 hours, reflecting a notable uptick amid an otherwise declining market.
FARTCOIN Defies the Odds, Soars to Two-Month High
FARTCOIN plunged to a year-to-date low of $0.19 on March 10. This presented a buying opportunity for the meme coin holders, who have since increased their buy orders for the token. Trading at a two-month high of $0.72 as of this writing, FARTCOIN’s value has since soared by 279% in the past month.
On the daily chart, FARTCOIN’s triple-digit rally has pushed its price above the Leading Span A (green line) of its Ichimoku Cloud. The strengthening bullish momentum is now driving the altcoin toward the Leading Span B (red line) of this indicator, a breakout of which would further validate FARTCOIN’s current bull run.
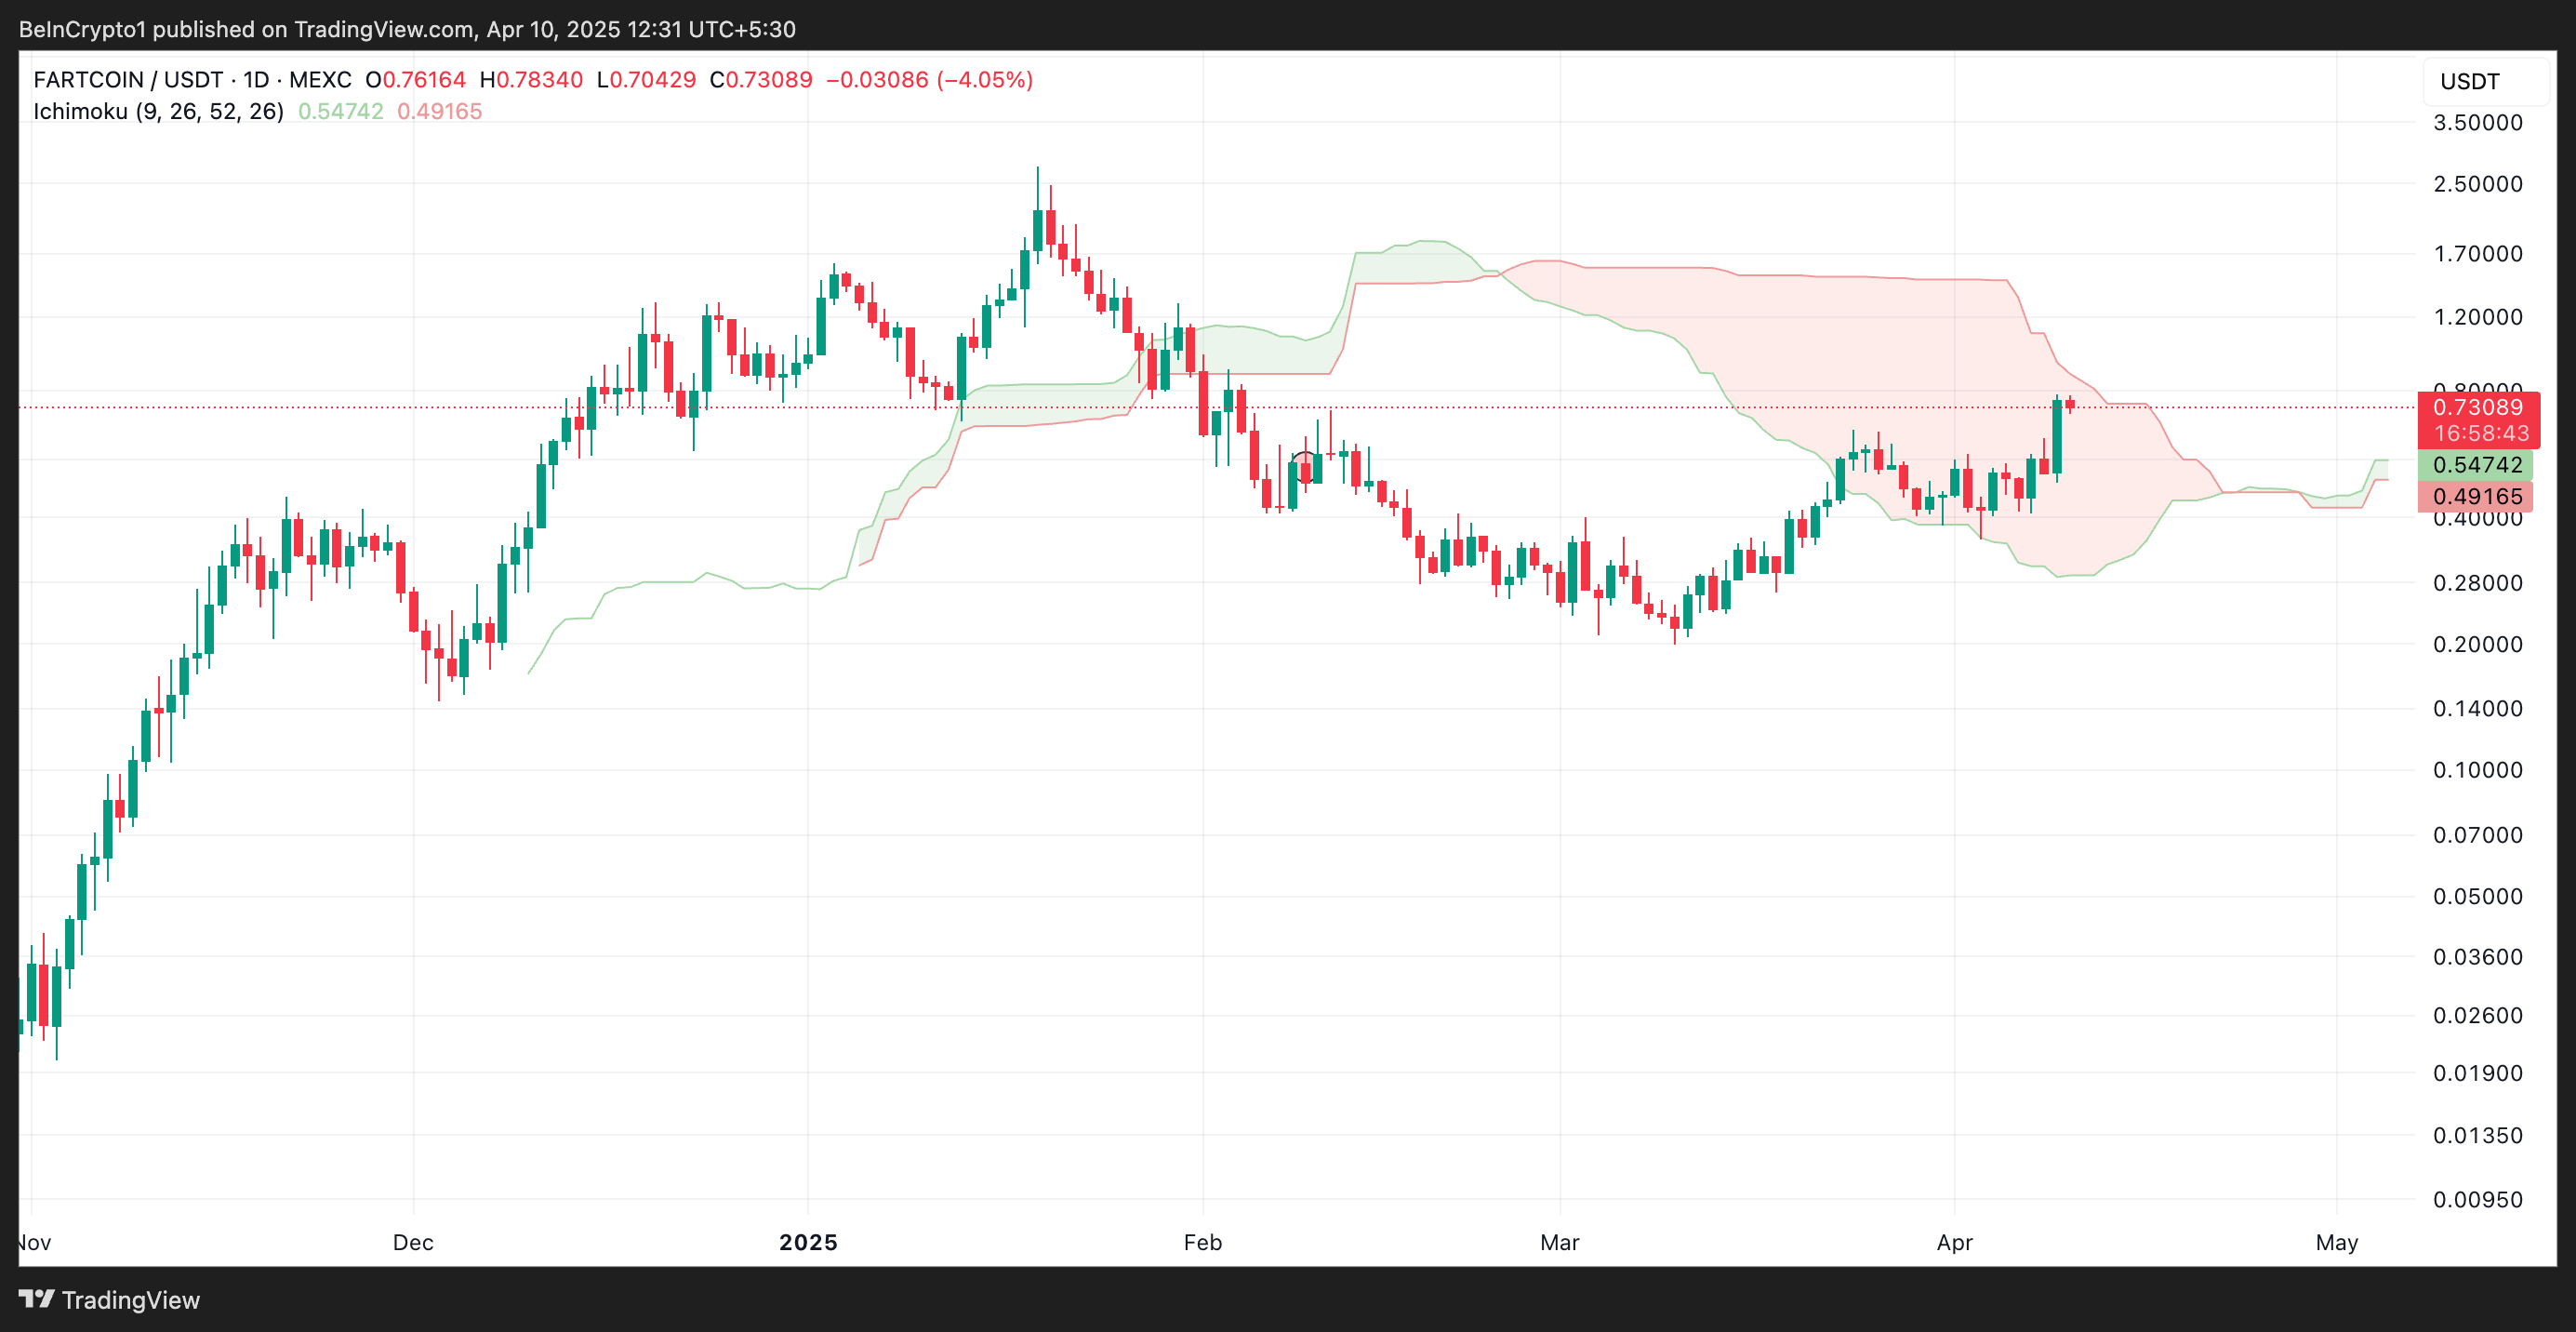
The Ichimoku Cloud tracks the momentum of an asset’s market trends and identifies potential support/resistance levels.
When an asset’s price breaks above Leading Span A and is poised to break above Leading Span B, it signals a strengthening bullish trend. This hints at the potential for further upward movement as FARTCOIN moves into a more favorable market position.
Further, the altcoin’s Chaikin Money Flow (CMF) remains above the zero line, confirming the preference for FARTCOIN accumulation over selloffs. At press time, this momentum indicator, which measures how money flows into and out of an asset, is at 0.13.
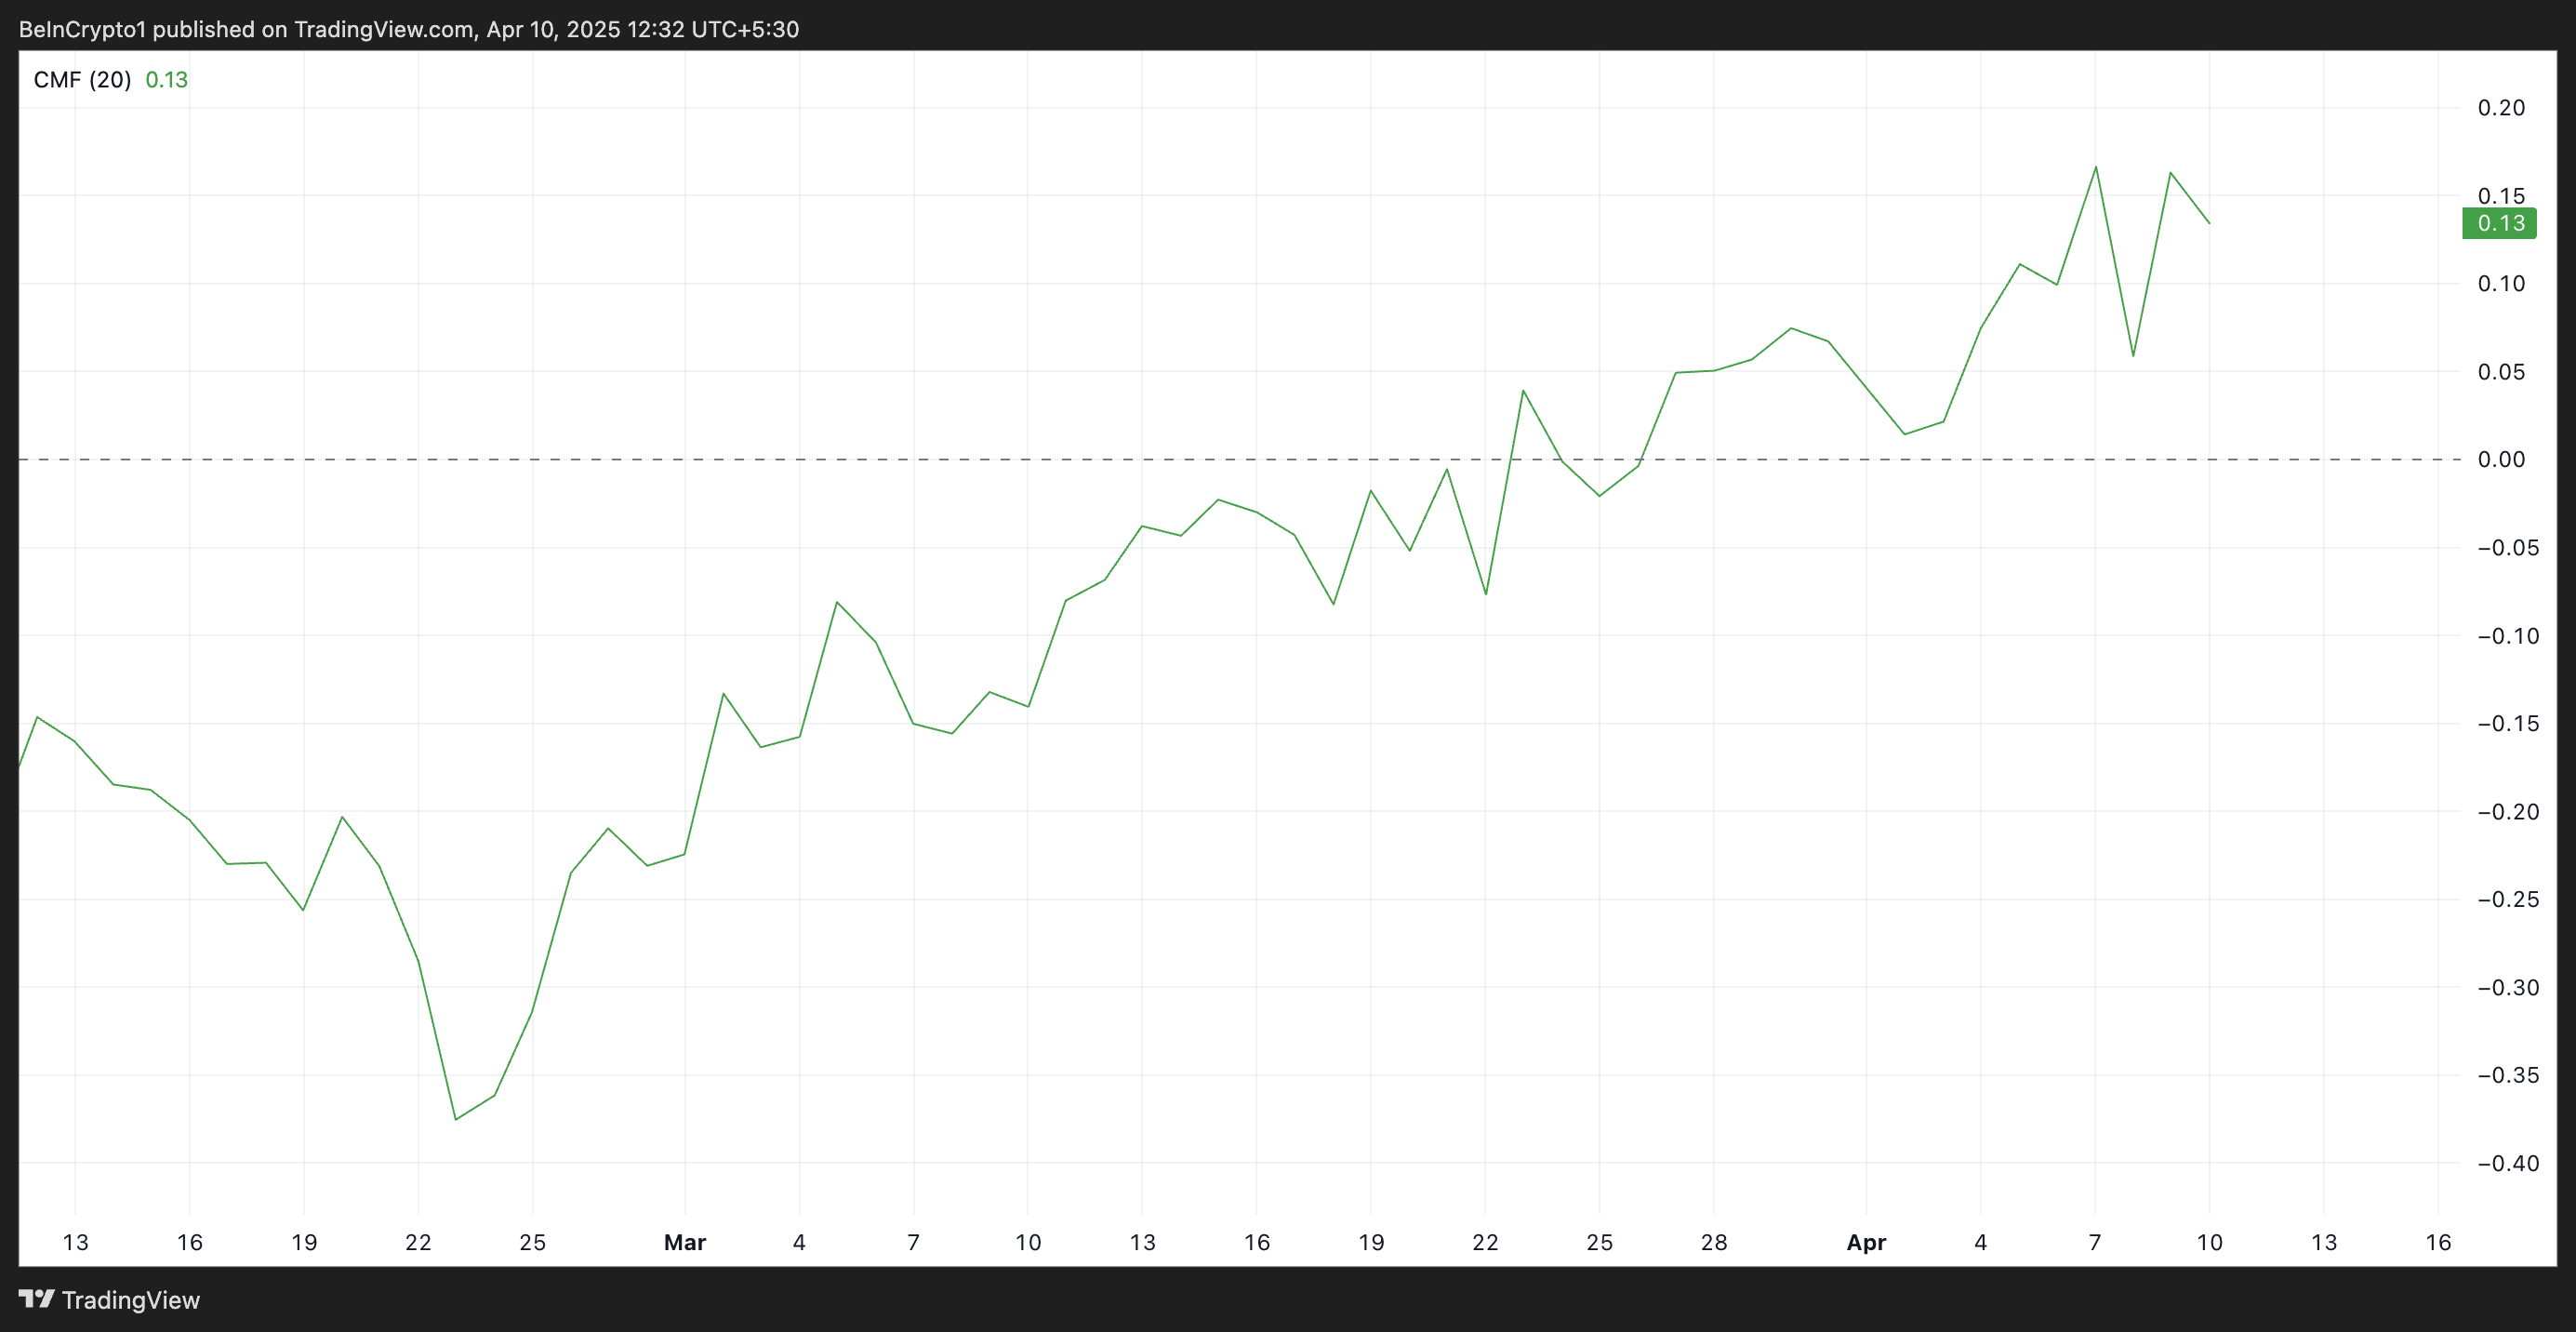
A positive CMF reading during a rally like this indicates strong buying pressure and market participation, as the volume of buy orders outweighs sell orders. This suggests that FARTCOIN’s rally is supported by solid demand, reinforcing the sustainability of the upward movement.
FARTCOIN is on Track for $1
Since its rally began on March 10, FARTCOIN has traded within an ascending parallel channel. This bullish pattern confirms the growing demand for the meme coin.
If buying pressure strengthens, FARTCOIN could extend its gains. In that case, its price could break above the Leading Span B, which currently forms a dynamic resistance above its price. A successful break above this level could propel the token toward $1.
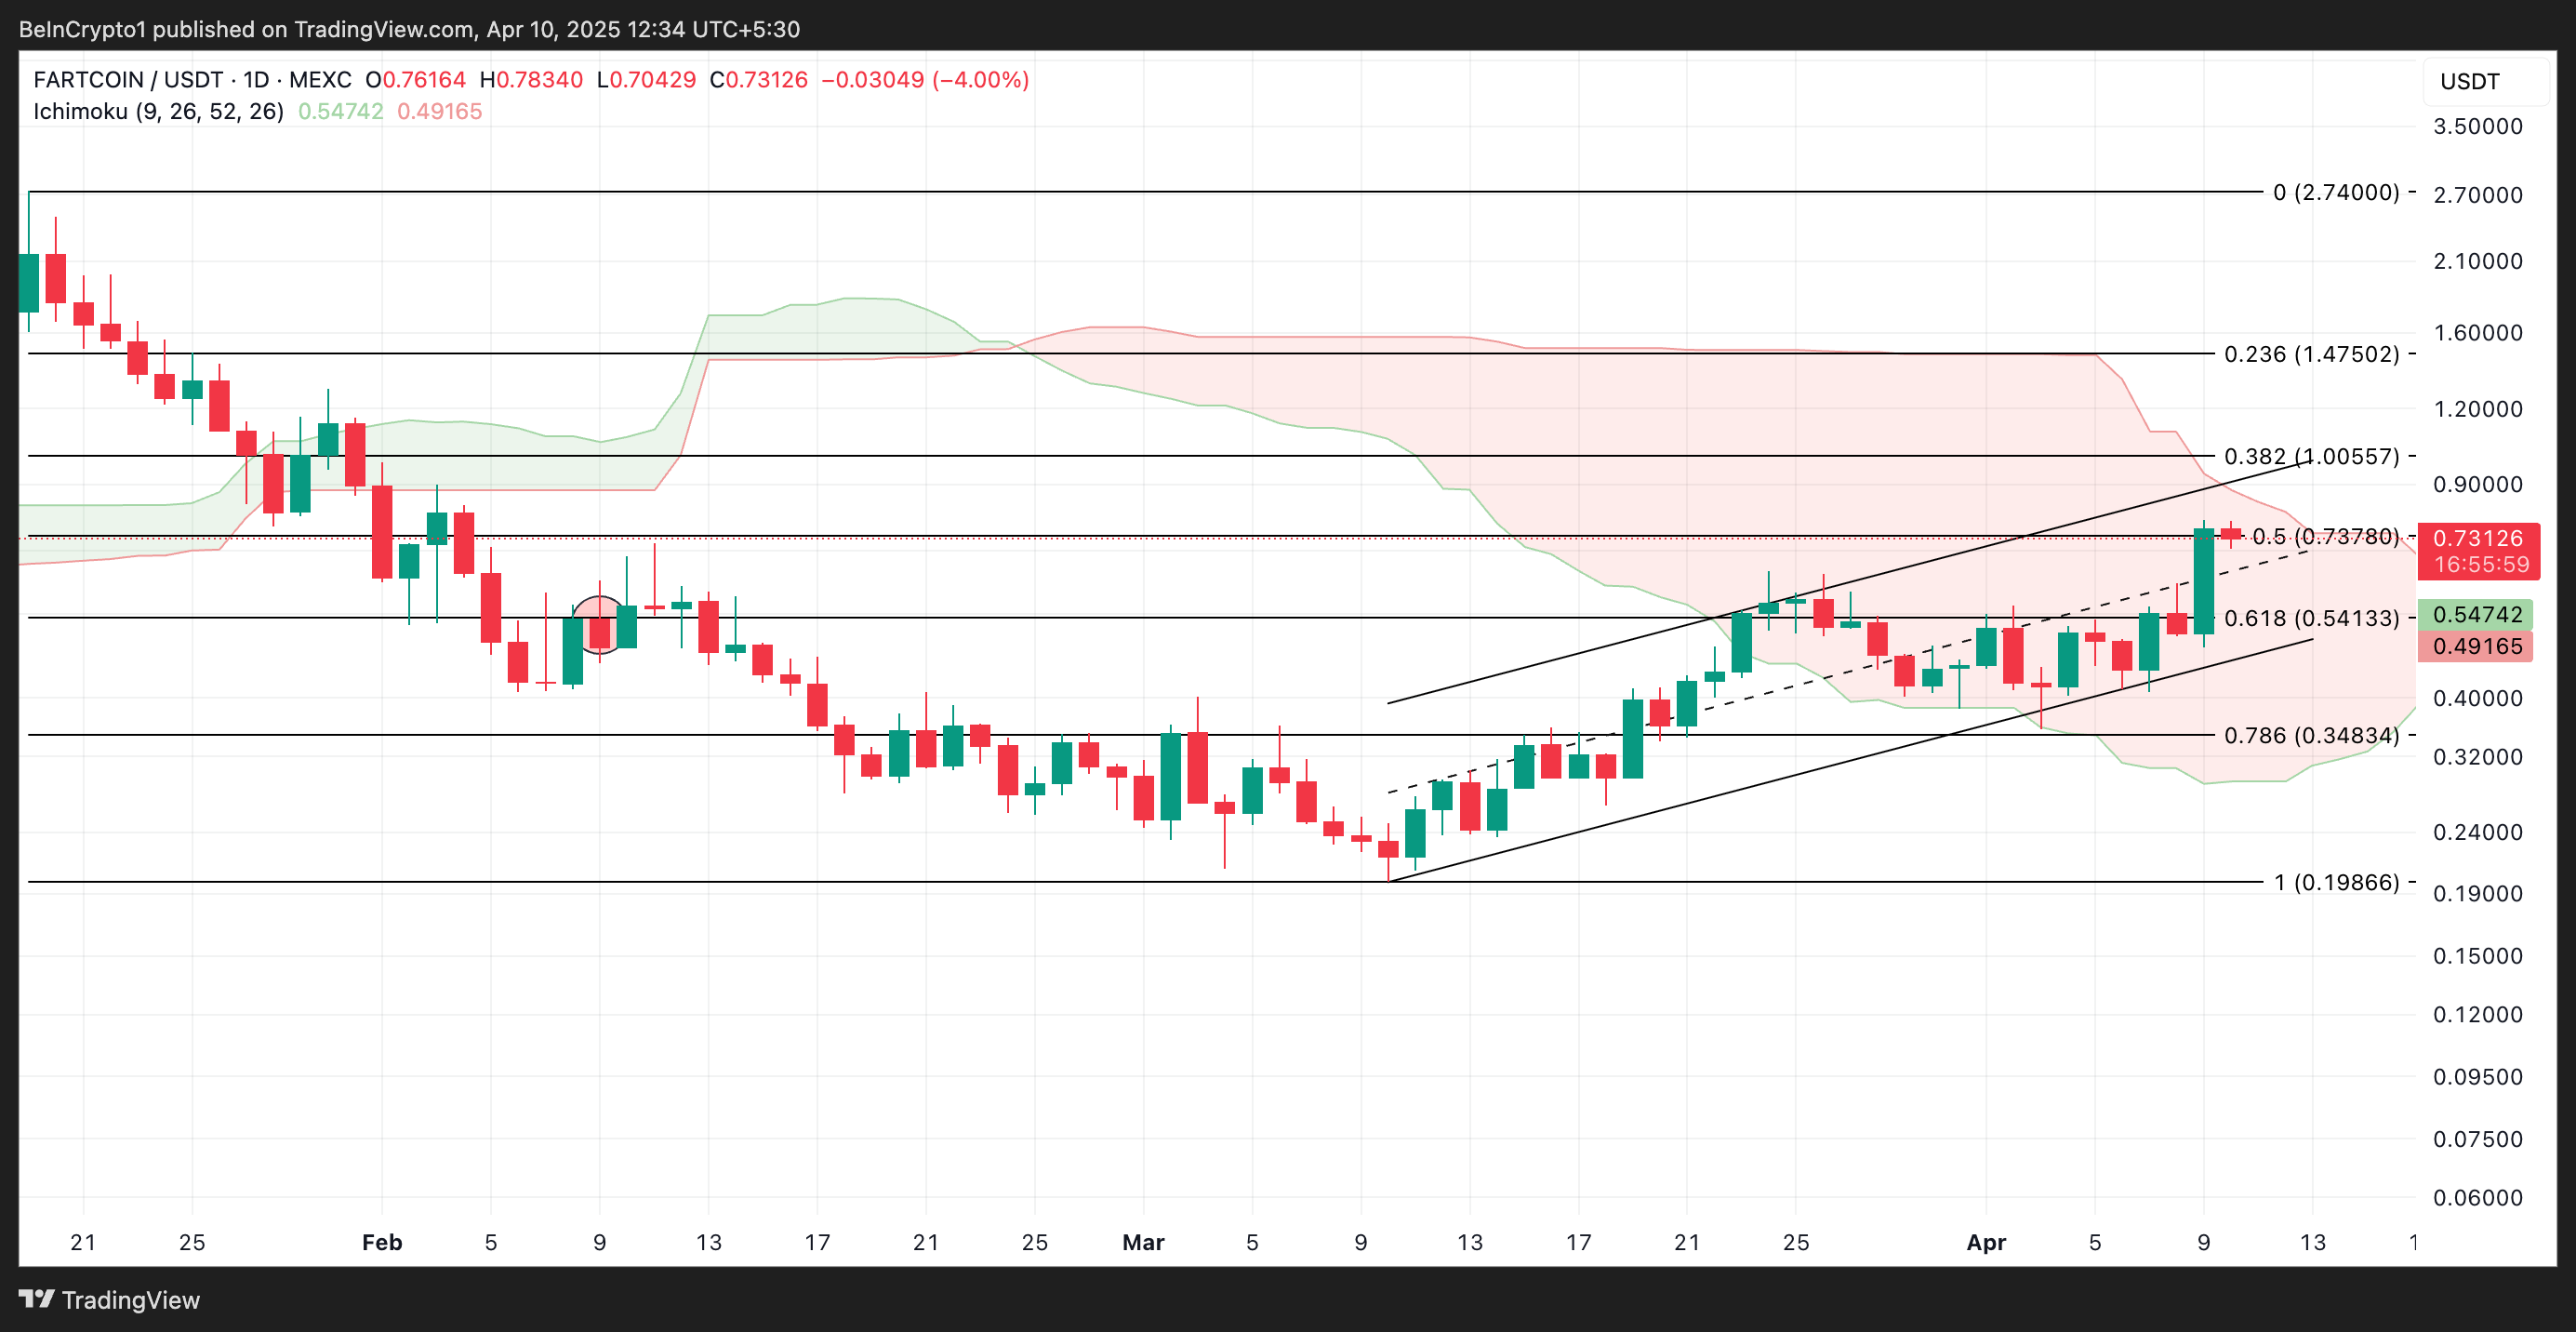
However, if profit-taking resumes, this bullish projection will be invalidated. In that scenario, meme coin FARTCOIN’s price could dip to $0.54.
Disclaimer
In line with the Trust Project guidelines, this price analysis article is for informational purposes only and should not be considered financial or investment advice. BeInCrypto is committed to accurate, unbiased reporting, but market conditions are subject to change without notice. Always conduct your own research and consult with a professional before making any financial decisions. Please note that our Terms and Conditions, Privacy Policy, and Disclaimers have been updated.
Market
XRP Price Forms Rounded Bottom Within Descending Channel, Target Set Above $3

Despite breaking above $3 earlier this year, the XRP price has since gone on to disappoint investors with multiple crashes that have rocked the altcoin. This has seen the cryptocurrency lose almost 50% of its acquired value between late 2024 and early 2025. Nevertheless, this has failed to erode bullish sentiment, with predictions for higher prices dominating the community.
Time To Go Long On The XRP Price?
A crypto analyst on X (formerly Twitter) has renewed bullish hope after identifying an important formation on the XRP price chart. The analysis pointed out that the XRP Price is still moving within a descending channel, a formation that usually signals a bearish move.
However, the downtrend has pushed the altcoin’s price to the point where it is now testing the bottom trend line. This bottom trend line has been known to act as strong support previously and is expected to do so this time around.
With the support forming, it is likely that the XRP Price is gearing up for a bounce from this level. Furthermore, the crypto analyst points out that XRP is also forming a rounded bottom inside this descending channel. Such a rounded bottom could signal an end to the downtrend from here.
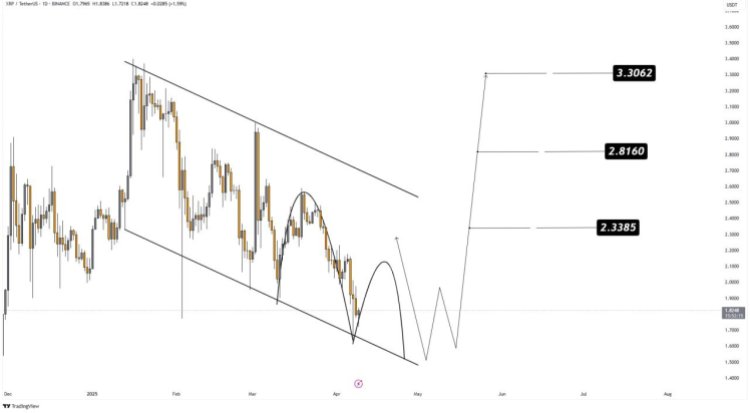
As the formation grows, the main level of support is now sitting at $1.6. So far, this level has held up quite nicely and bulls have been using it as a bounce-off point for recovery. Given this, the crypto analyst advises that entries for the XRP price are best at around $1.70 to $1.85.
This is not the only good news for the XRP price with support forming. If it holds and the altcoin does indeed bounce from this level toward $2, then the next important levels lie between $2 and $2.2. These serve as the levels for the bulls to beat to confirm a bullish continuation toward a possible all-time high.
If the bulls are successful, then three profit targets are placed by the crypto analyst. These include $2.3385, $2.8160, and $3.3062, pushing it toward January 2025 highs.
The Bearish Case
While the analysis is inherently bullish, there is still the possibility of invalidation that could send the XRP price tumbling further. As the analyst points out, the major support currently lies at $1.6. This means that bulls must hold this level. Otherwise, there is the risk of a much deeper correction as a liquidity sweep could send support further down to $1.3.
Nevertheless, with buy sentiments building once again, it is likely that XRP will follow the bullish scenario in this case.
Chart from TradingView.com
Market
RSR Price Climbs 22% After Paul Atkins Gets Named SEC Chair

Reserve Rights (RSR) has experienced a notable 22% increase in its price over the last 24 hours. This surge follows the news of Paul Atkins, former Reserve Rights Foundation advisor, becoming the new chair of the US Securities and Exchange Commission (SEC).
Additionally, US President Donald Trump’s decision to pause reciprocal tariffs has added a layer of optimism to the cryptocurrency market, further buoying RSR’s price.
Reserve Rights Investors May Note Profits Soon
The market sentiment surrounding RSR remains cautiously optimistic, driven by a significant accumulation of tokens. According to the IOMAP, around 46.73 billion RSR tokens, valued at over $350 million, are currently sitting at a price range between $0.007983 and $0.008202.
These tokens have not yet reached a profit zone, but an 8% rally would make them profitable for investors. As these large holders are likely to maintain a bullish outlook, the anticipation of possible profits could further strengthen the buying sentiment, contributing to a price increase.
However, if the holders aim to sell for a break-even, it might negatively impact the RSR price rally.

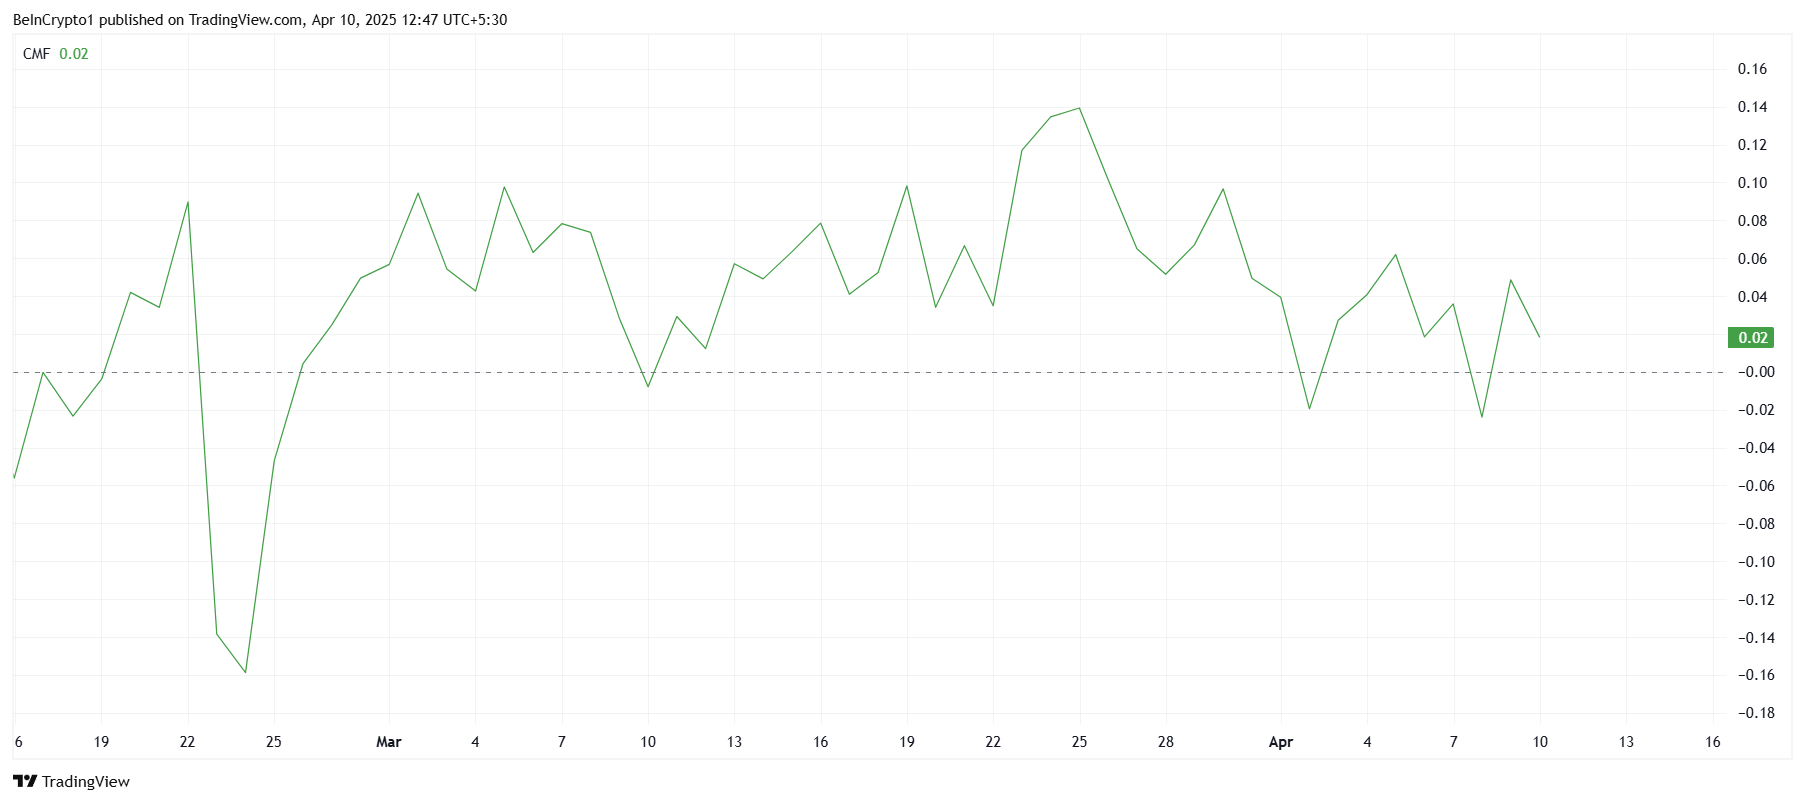
Despite the news of Paul Atkins becoming SEC Chair, the overall macro momentum for RSR appears to be lackluster. The Chaikin Money Flow (CMF) indicator, which measures market liquidity and investor buying pressure, has not seen any sharp upticks, even after the recent announcements.
This suggests that, while the netflows have been positive, they remain underwhelming compared to the size of the positive developments. If RSR’s price continues its uptick in the coming days, there is a chance that the CMF will start to reflect stronger positive sentiment.
RSR Price Is Rising
Reserve Rights (RSR) price is currently trading at $0.007543, with a strong support level at $0.007386. Given the 22% rally over the last 24 hours, it is possible that the token will continue to rise if it holds above this support.
A bounce off $0.007386 could see RSR making its way to $0.008196. This would bring the altcoin closer to a profitable range for many investors as well as imbue confidence regarding further rally.

However, should RSR fail to breach the $0.008196 resistance or fall below the support of $0.007386, the altcoin’s price could drop to $0.006601 or even lower towards $0.005900. This would significantly damage the bullish thesis and extend recent losses, potentially leading to a further period of consolidation.
Disclaimer
In line with the Trust Project guidelines, this price analysis article is for informational purposes only and should not be considered financial or investment advice. BeInCrypto is committed to accurate, unbiased reporting, but market conditions are subject to change without notice. Always conduct your own research and consult with a professional before making any financial decisions. Please note that our Terms and Conditions, Privacy Policy, and Disclaimers have been updated.
-
 Bitcoin11 hours ago
MicroStrategy Bitcoin Dump Rumors Circulate After SEC Filing
-
 Market11 hours ago
XRP Primed for a Comeback as Key Technical Signal Hints at Explosive Move
-

 Altcoin15 hours ago
NFT Drama Ends For Shaquille O’Neal With Hefty $11 Million Settlement
-

 Market23 hours ago
How Ripple’s $1.25 Billion Deal Could Surge XRP Demand
-
 Regulation11 hours ago
US Senate Confirms Pro-Crypto Paul Atkins As SEC Chair
-

 Altcoin22 hours ago
Pepe Coin Whales Offload Over 1 Trillion PEPE
-
 Bitcoin21 hours ago
Will the Corporate Bitcoin Accumulation Trend Continue in 2025?
-

 Altcoin14 hours ago
Is Dogecoin Price Levels About To Bounce Back?


