Market
Why the Surge in Solana’s (SOL) DEX Activity Means Little

On-chain data shows a 400% spike in trading activity on decentralized exchanges (DEXs) powered by the Solana network over the past week.
However, a closer analysis indicates that the increase might not reflect genuine user participation.
Solana‘s DEX Activity: Much Talk About Nothing
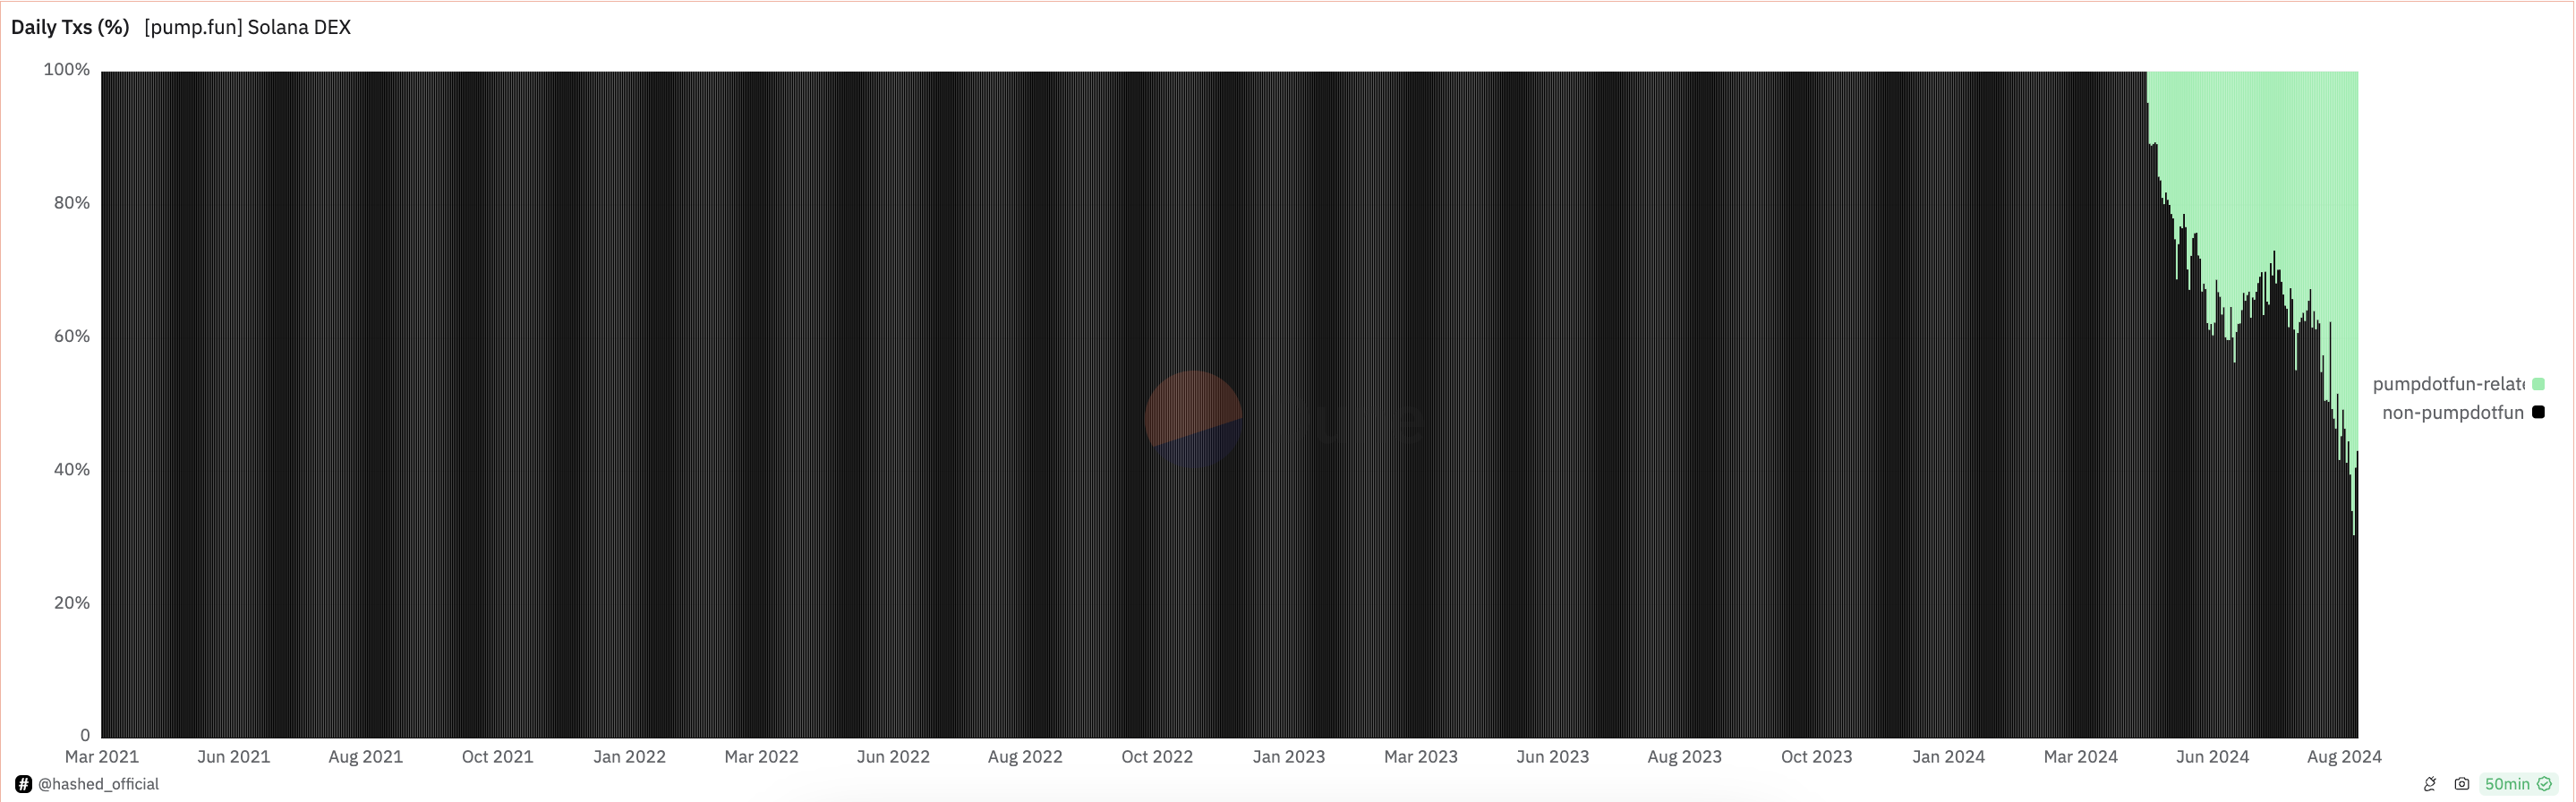
The rise in trading volume across DEXes housed within the Solana network is due to the recent explosion of meme coins, particularly those traded on pump.fun. This Solana-based meme coin creation platform has gained popularity in the past few weeks because it allows users to launch these “joke coins” for free.
The platform gained significant attention toward the end of June and has since dominated activity across Solana DEXs. Data from Dune Analytics shows that since August, transactions linked to pump.fun have consistently outpaced other activities on these exchanges.
On August 18, for example, pump.fun-related transactions accounted for 70% of all activity on Solana DEXs, leaving only 30% for other transactions. This dominance highlights how the platform has shaped trading dynamics within Solana’s decentralized finance (DeFi) ecosystem.

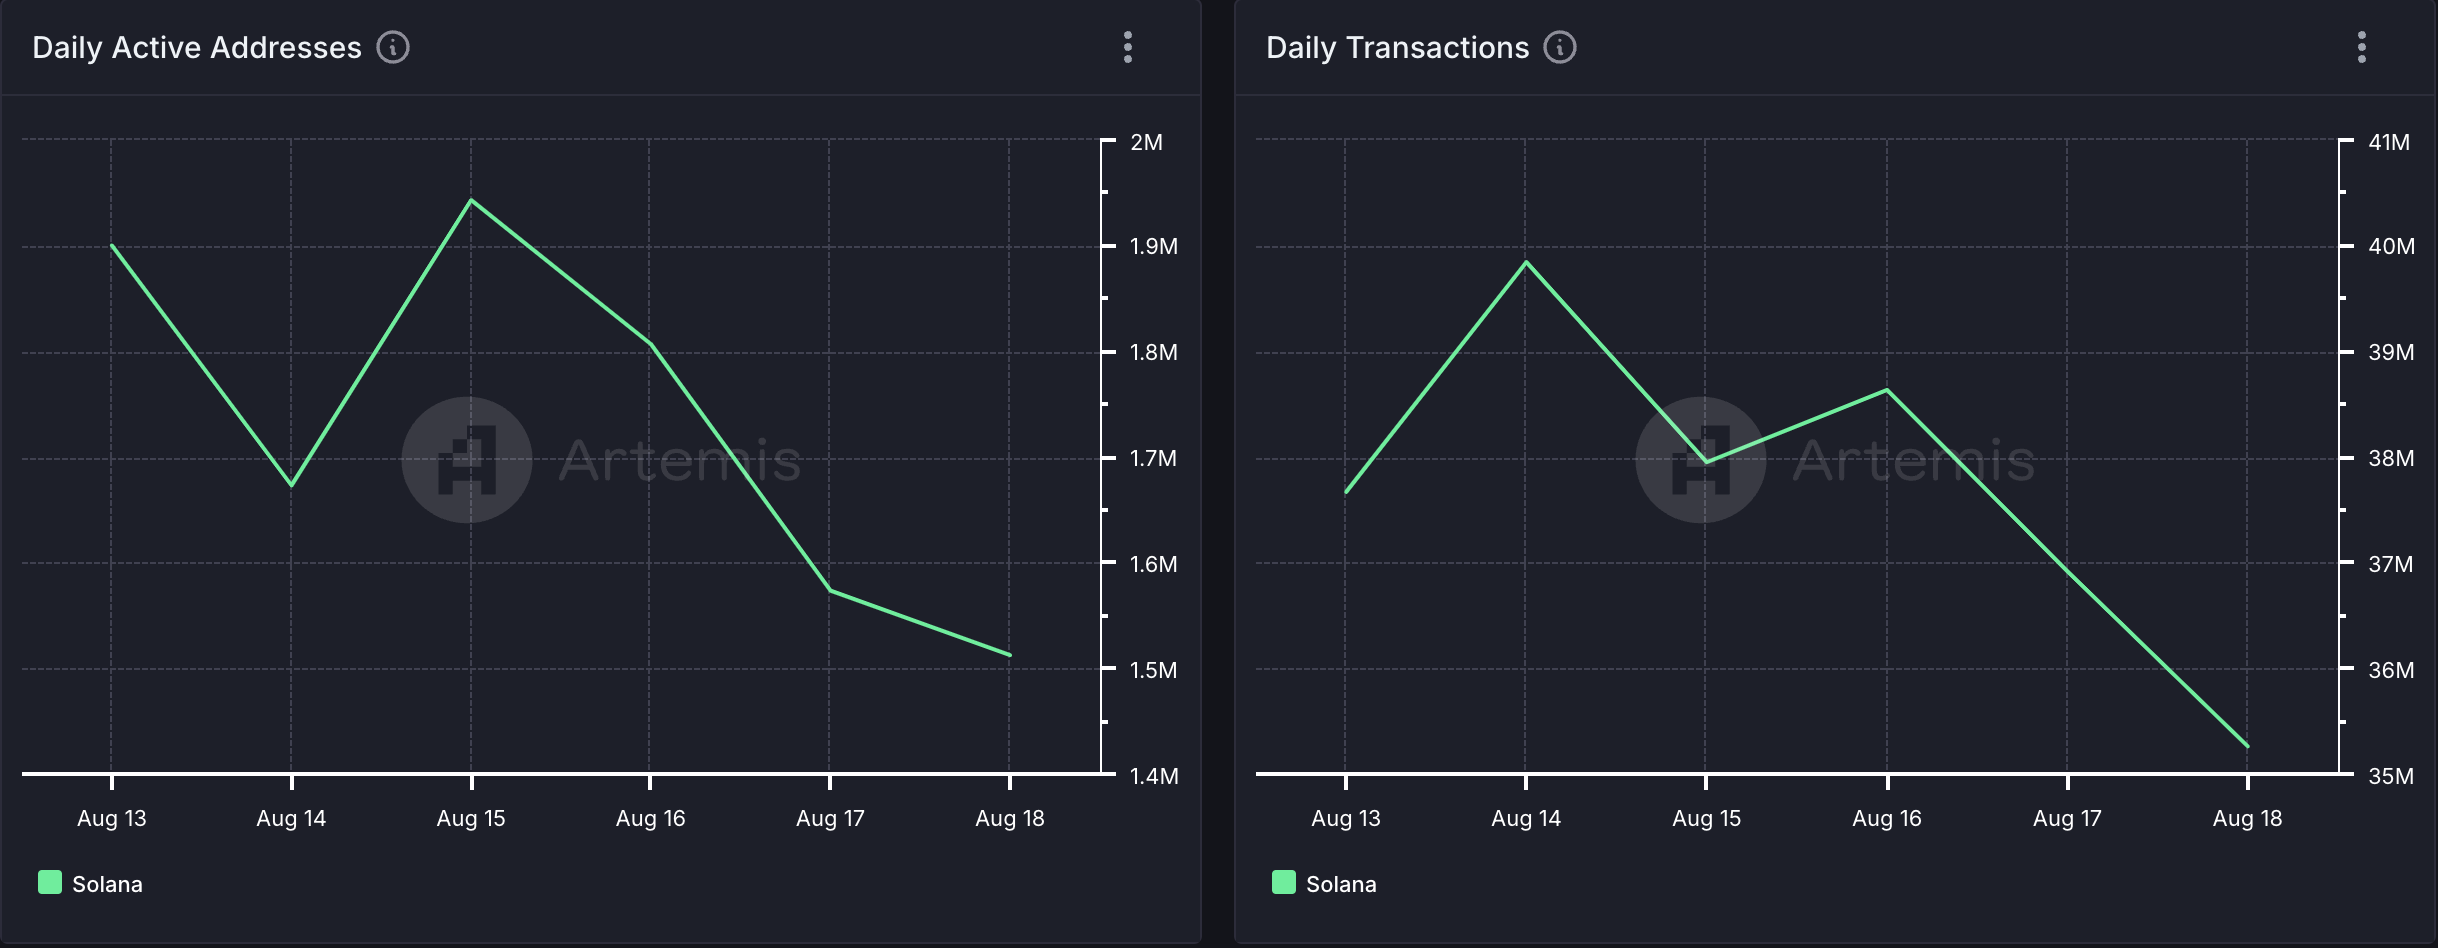
Despite this surge in DEX trading, user activity on the Solana blockchain has not seen a corresponding increase. On the contrary, daily active addresses on Solana have dropped by 20% over the past week.
This decline in users has also led to a dip in the network’s daily transaction count. According to Artemis data, transactions have decreased by 6% in the past seven days.
Read more: 6 Best Platforms To Buy Solana (SOL) in 2024

A primary impact of low user activity and transactions on a network is reduced fees and revenue. During the period in review, Solana’s transaction fees and network revenue have dropped by 34%.
SOL Price Prediction: Trend Begins to Shift
At press time, Solana’s native coin trades at $147.3, with price movements on the one-day chart indicating a possible rally.
Currently, the MACD line (blue) is positioned to cross above the signal line (orange). The MACD indicator tracks changes in price trends, direction, and momentum. When the MACD line crosses above the signal line, it often signals a shift from a bearish to a bullish trend, hinting at a potential short-term rally.
Read more: 13 Best Solana (SOL) Wallets To Consider in August 2024

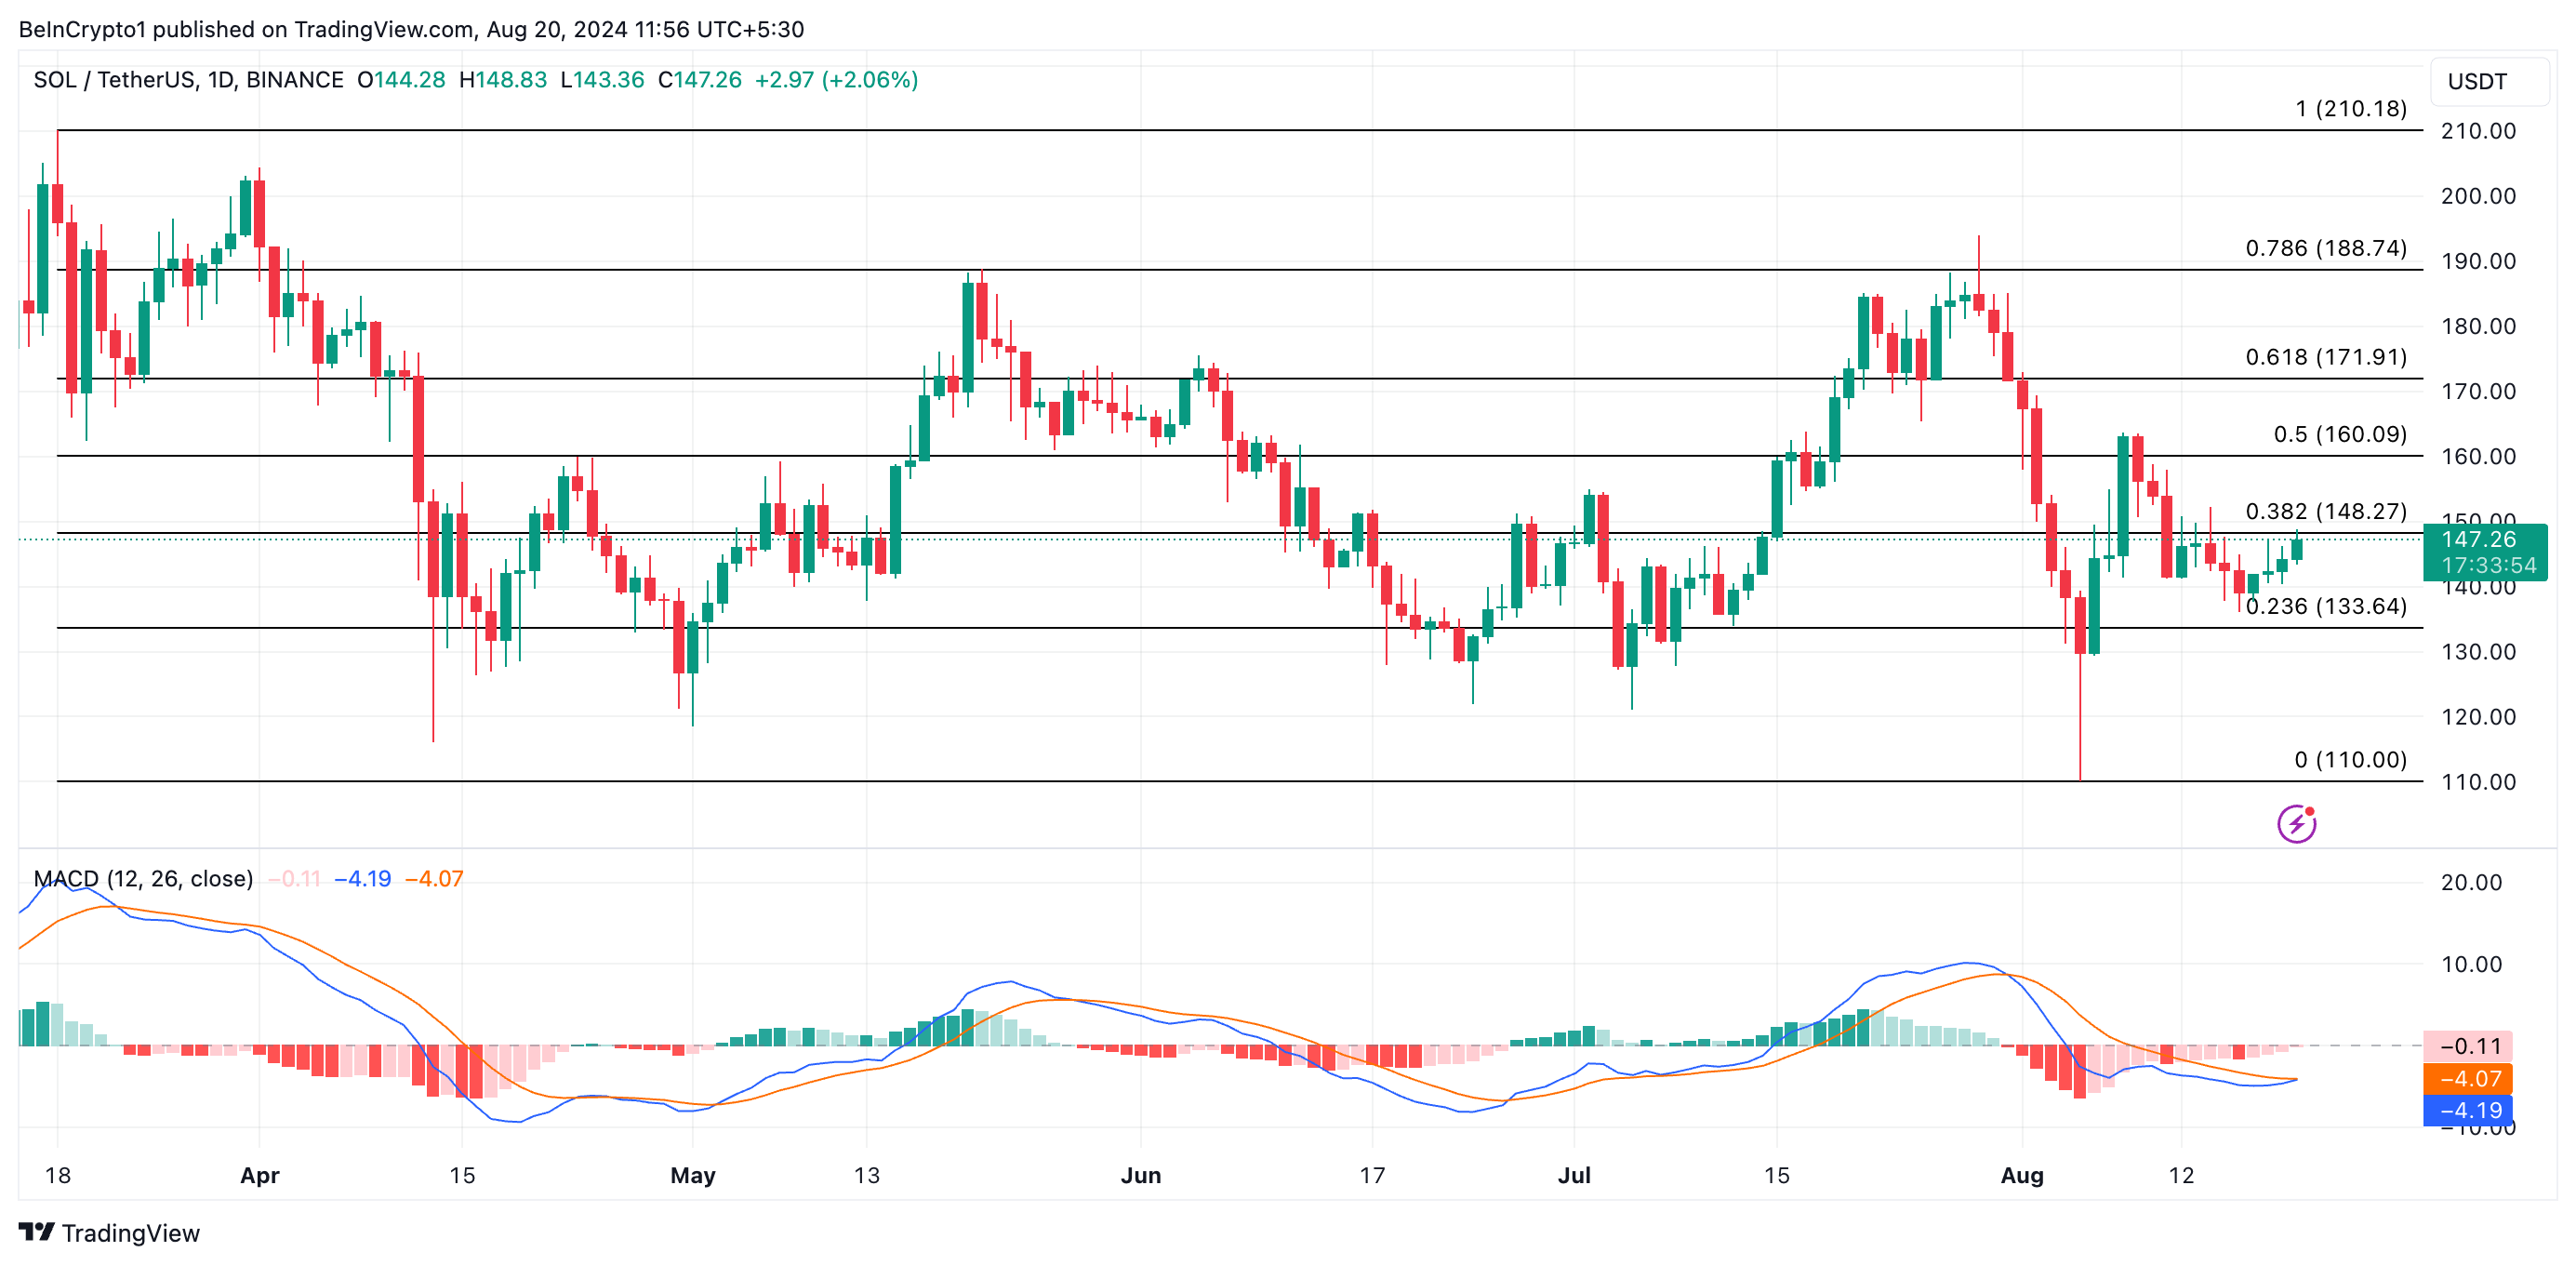
If SOL completes this crossover and demand rises, its price could reach $148.27. However, if buying pressure diminishes and bearish momentum takes over, SOL’s value could drop to $133.64.
Disclaimer
In line with the Trust Project guidelines, this price analysis article is for informational purposes only and should not be considered financial or investment advice. BeInCrypto is committed to accurate, unbiased reporting, but market conditions are subject to change without notice. Always conduct your own research and consult with a professional before making any financial decisions. Please note that our Terms and Conditions, Privacy Policy, and Disclaimers have been updated.