
Market
Why FET Whales May Push Its Price To $2?

Artificial Superintelligence Alliance (FET) has been on an uptrend, gaining 31% over the past week. This rally is driven by increased whale accumulation, indicating heightened interest from large-scale investors.
FET’s double-digit price surge has brought it near the upper boundary of the horizontal channel it has traded within since June. The key question is whether this momentum will trigger a breakout above this critical resistance level.
FET Whales Drive Rally
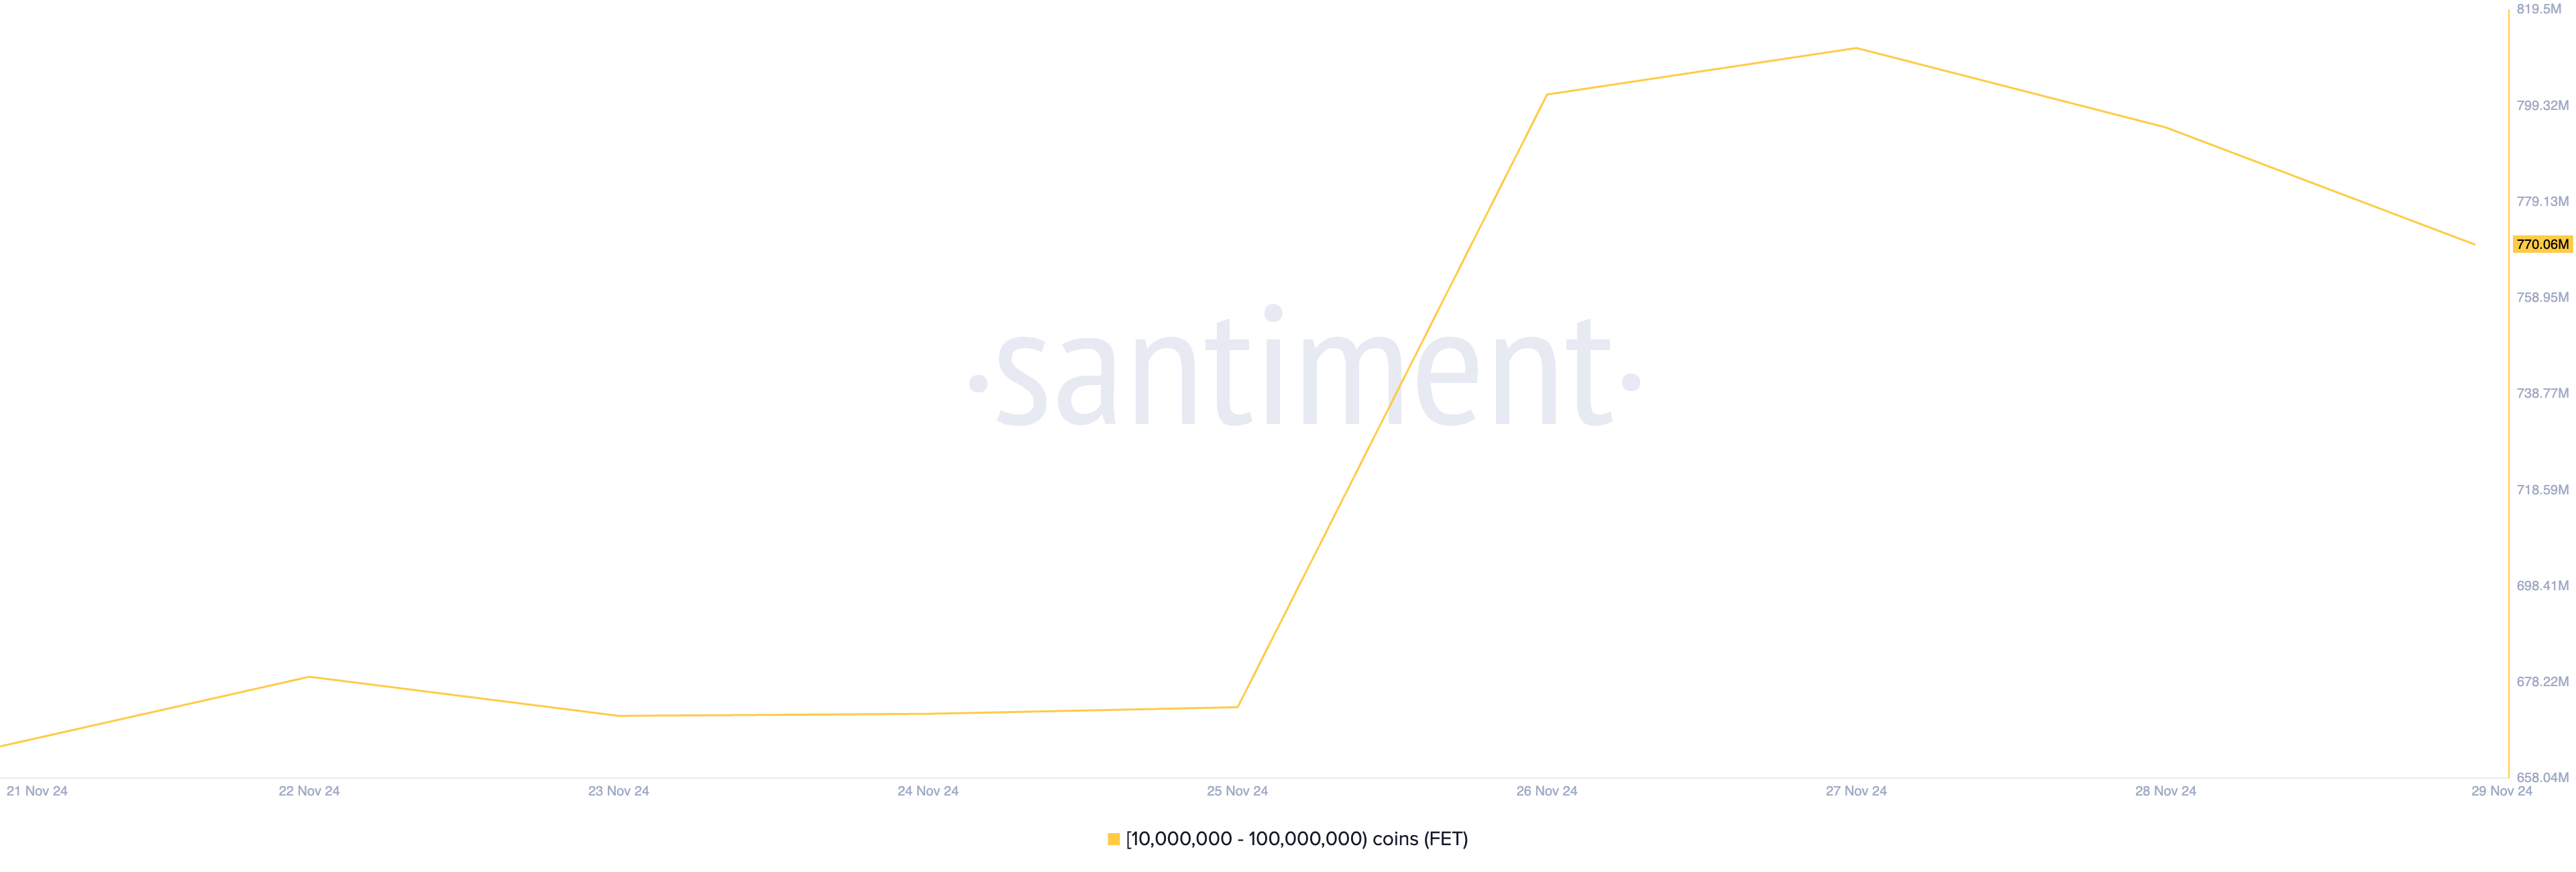
BeInCrypto’s analysis of FET’s on-chain performance has revealed a significant rise in whale accumulation over the past week. Data from Santiment reveals that, in the past seven days, whale addresses holding between 10 million and 100 million FET tokens have collectively purchased 106 million tokens valued at $174 million at current market prices.
When whales accumulate more coins, it signals confidence in the asset’s future value. This heightened demand often influences retail interest, which increases buying pressure and drives up the asset’s price.
This surge in whale accumulation is largely attributed to FET’s undervalued status, as indicated by its negative market value to realized value (MVRV) ratio. Santiment reports that FET’s current MVRV ratio stands at -86.25%.
The MVRV ratio compares an asset’s market capitalization to the total value of coins purchased at their realized price, offering insights into whether the asset is overvalued or undervalued relative to its historical cost basis.
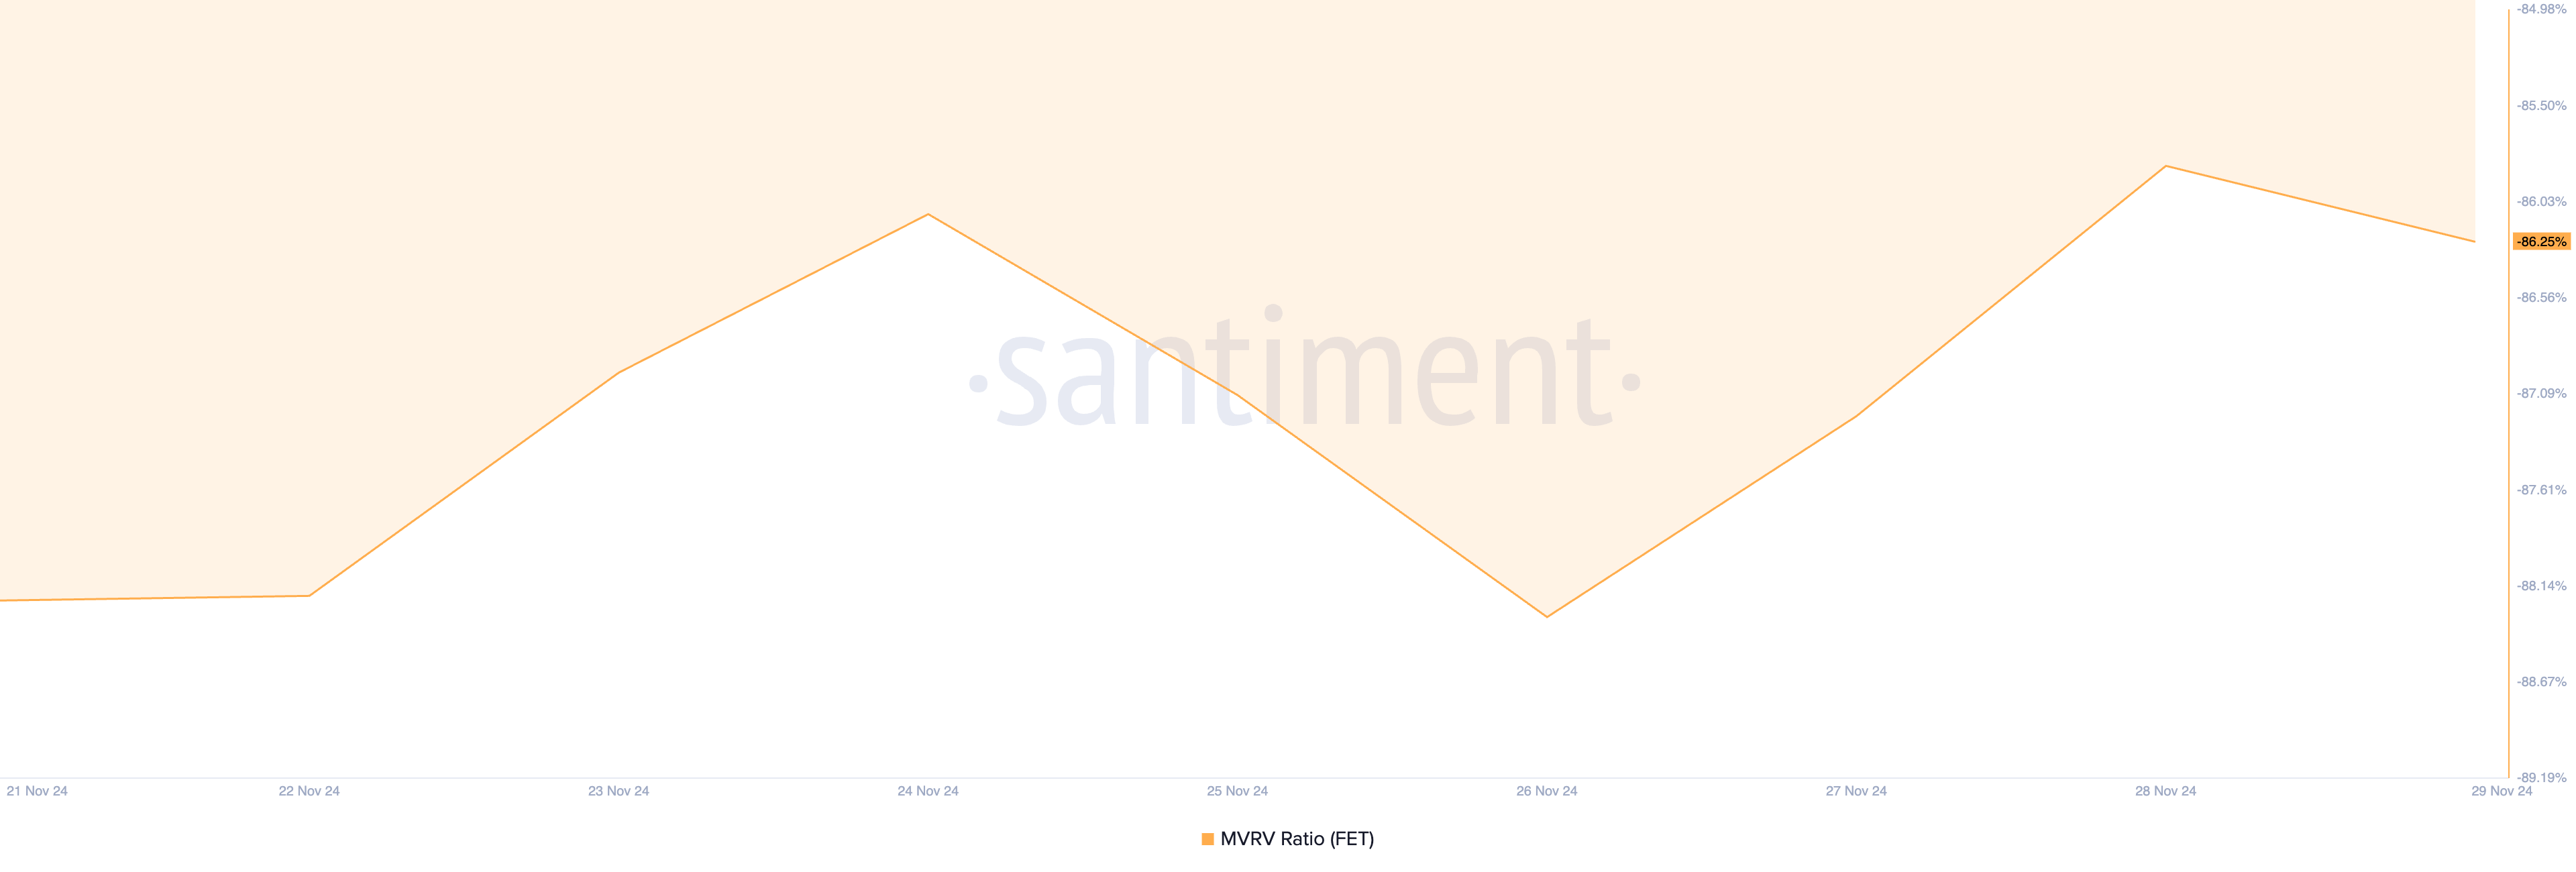
Historically, investors view negative MVRV ratios as a buying opportunity, recognizing that the asset trades below its historical acquisition cost and may rebound. This expectation of a rebound has led FET whales to increase their holdings in recent days.
FET Price Prediction: A Rally Above $2 Is Possible
On a daily chart, FET has traded within a horizontal channel since June. This channel is formed when an asset’s price fluctuates between parallel support and resistance levels, indicating a period of consolidation or range-bound trading. Since June, FET has faced resistance at $1.72 and has found support at $1.09.
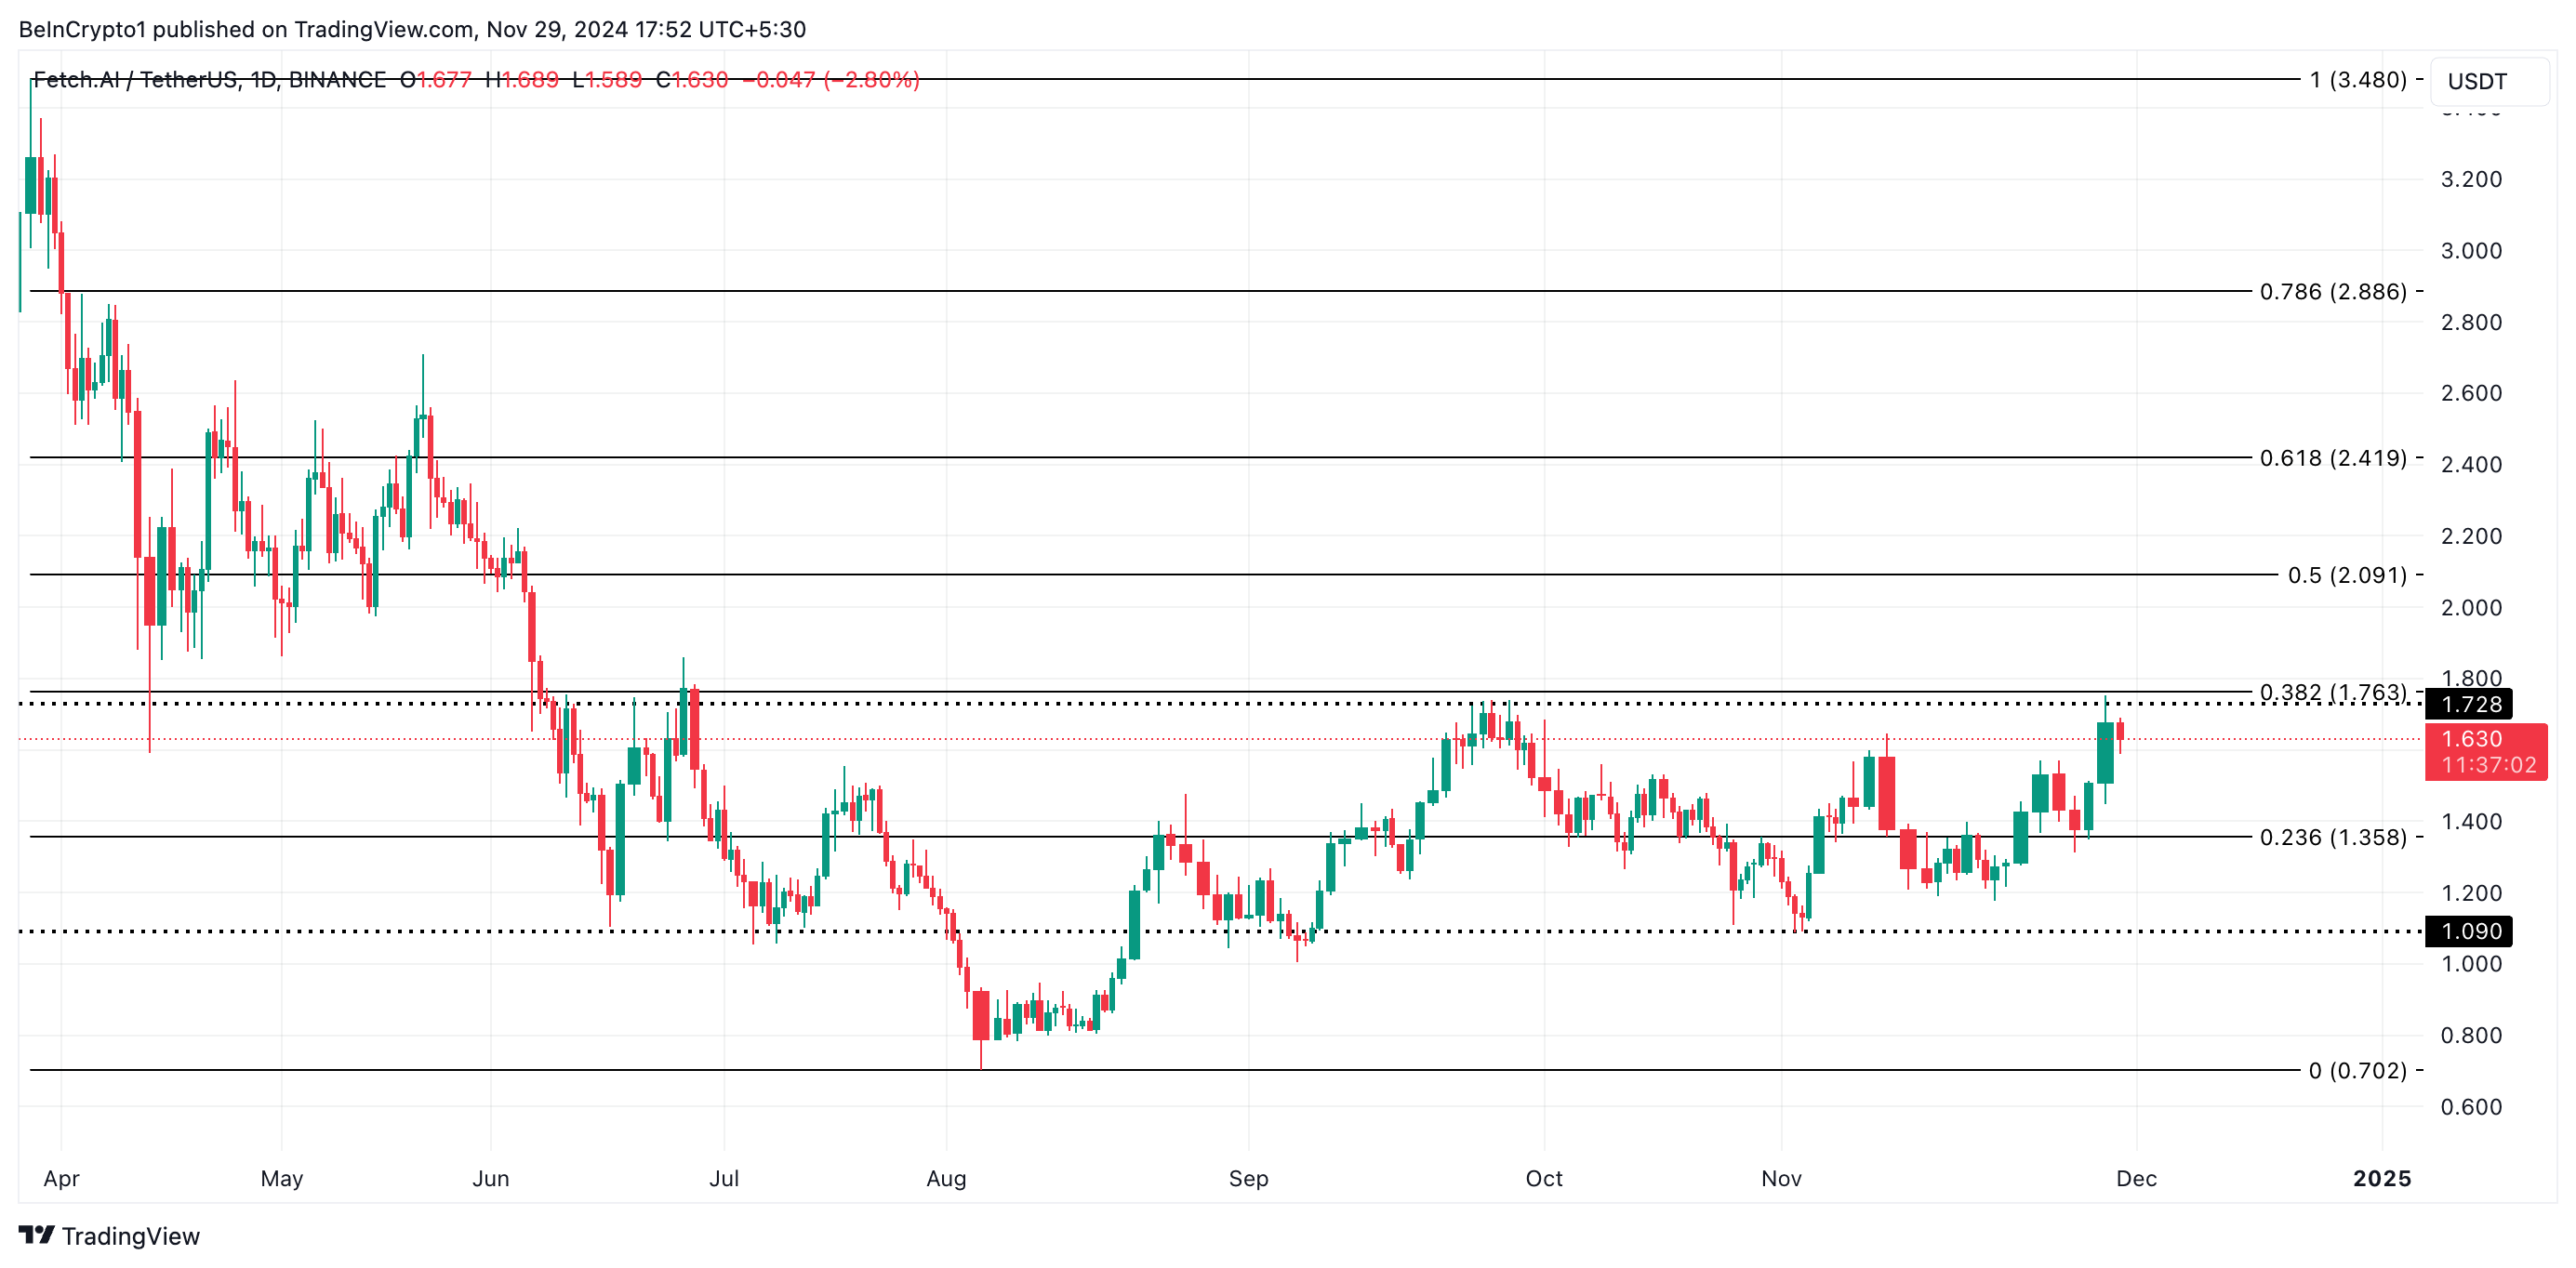
At press time, FET trades at $1.63, attempting to break above the upper line of this channel. If successful, this will propel its price to trade at $2.09. Conversely, a failed attempt to breach resistance will send FET’s price toward support at $1.35.
Disclaimer
In line with the Trust Project guidelines, this price analysis article is for informational purposes only and should not be considered financial or investment advice. BeInCrypto is committed to accurate, unbiased reporting, but market conditions are subject to change without notice. Always conduct your own research and consult with a professional before making any financial decisions. Please note that our Terms and Conditions, Privacy Policy, and Disclaimers have been updated.


The value of the leading altcoin, Ethereum, has plunged to its lowest point since March 2023, signaling a steep decline in market confidence. This has happened amid the broader market’s downturn, which was exacerbated by Donald Trump’s Liberation Day.
Compounding the bearish sentiment, the ETH/BTC ratio has now dropped to a five-year low, indicating that Bitcoin is gaining relative strength against Ethereum.
ETH/BTC Ratio Hits 5-Year Low as Traders Flee
ETH’s price decline has pushed the ETH/BTC ratio to a five-year low of 0.019. This ratio measures ETH’s relative value compared to BTC. When it rises, it indicates that ETH is outperforming BTC, either because the altcoin’s price is growing faster or the king coin’s price is falling.
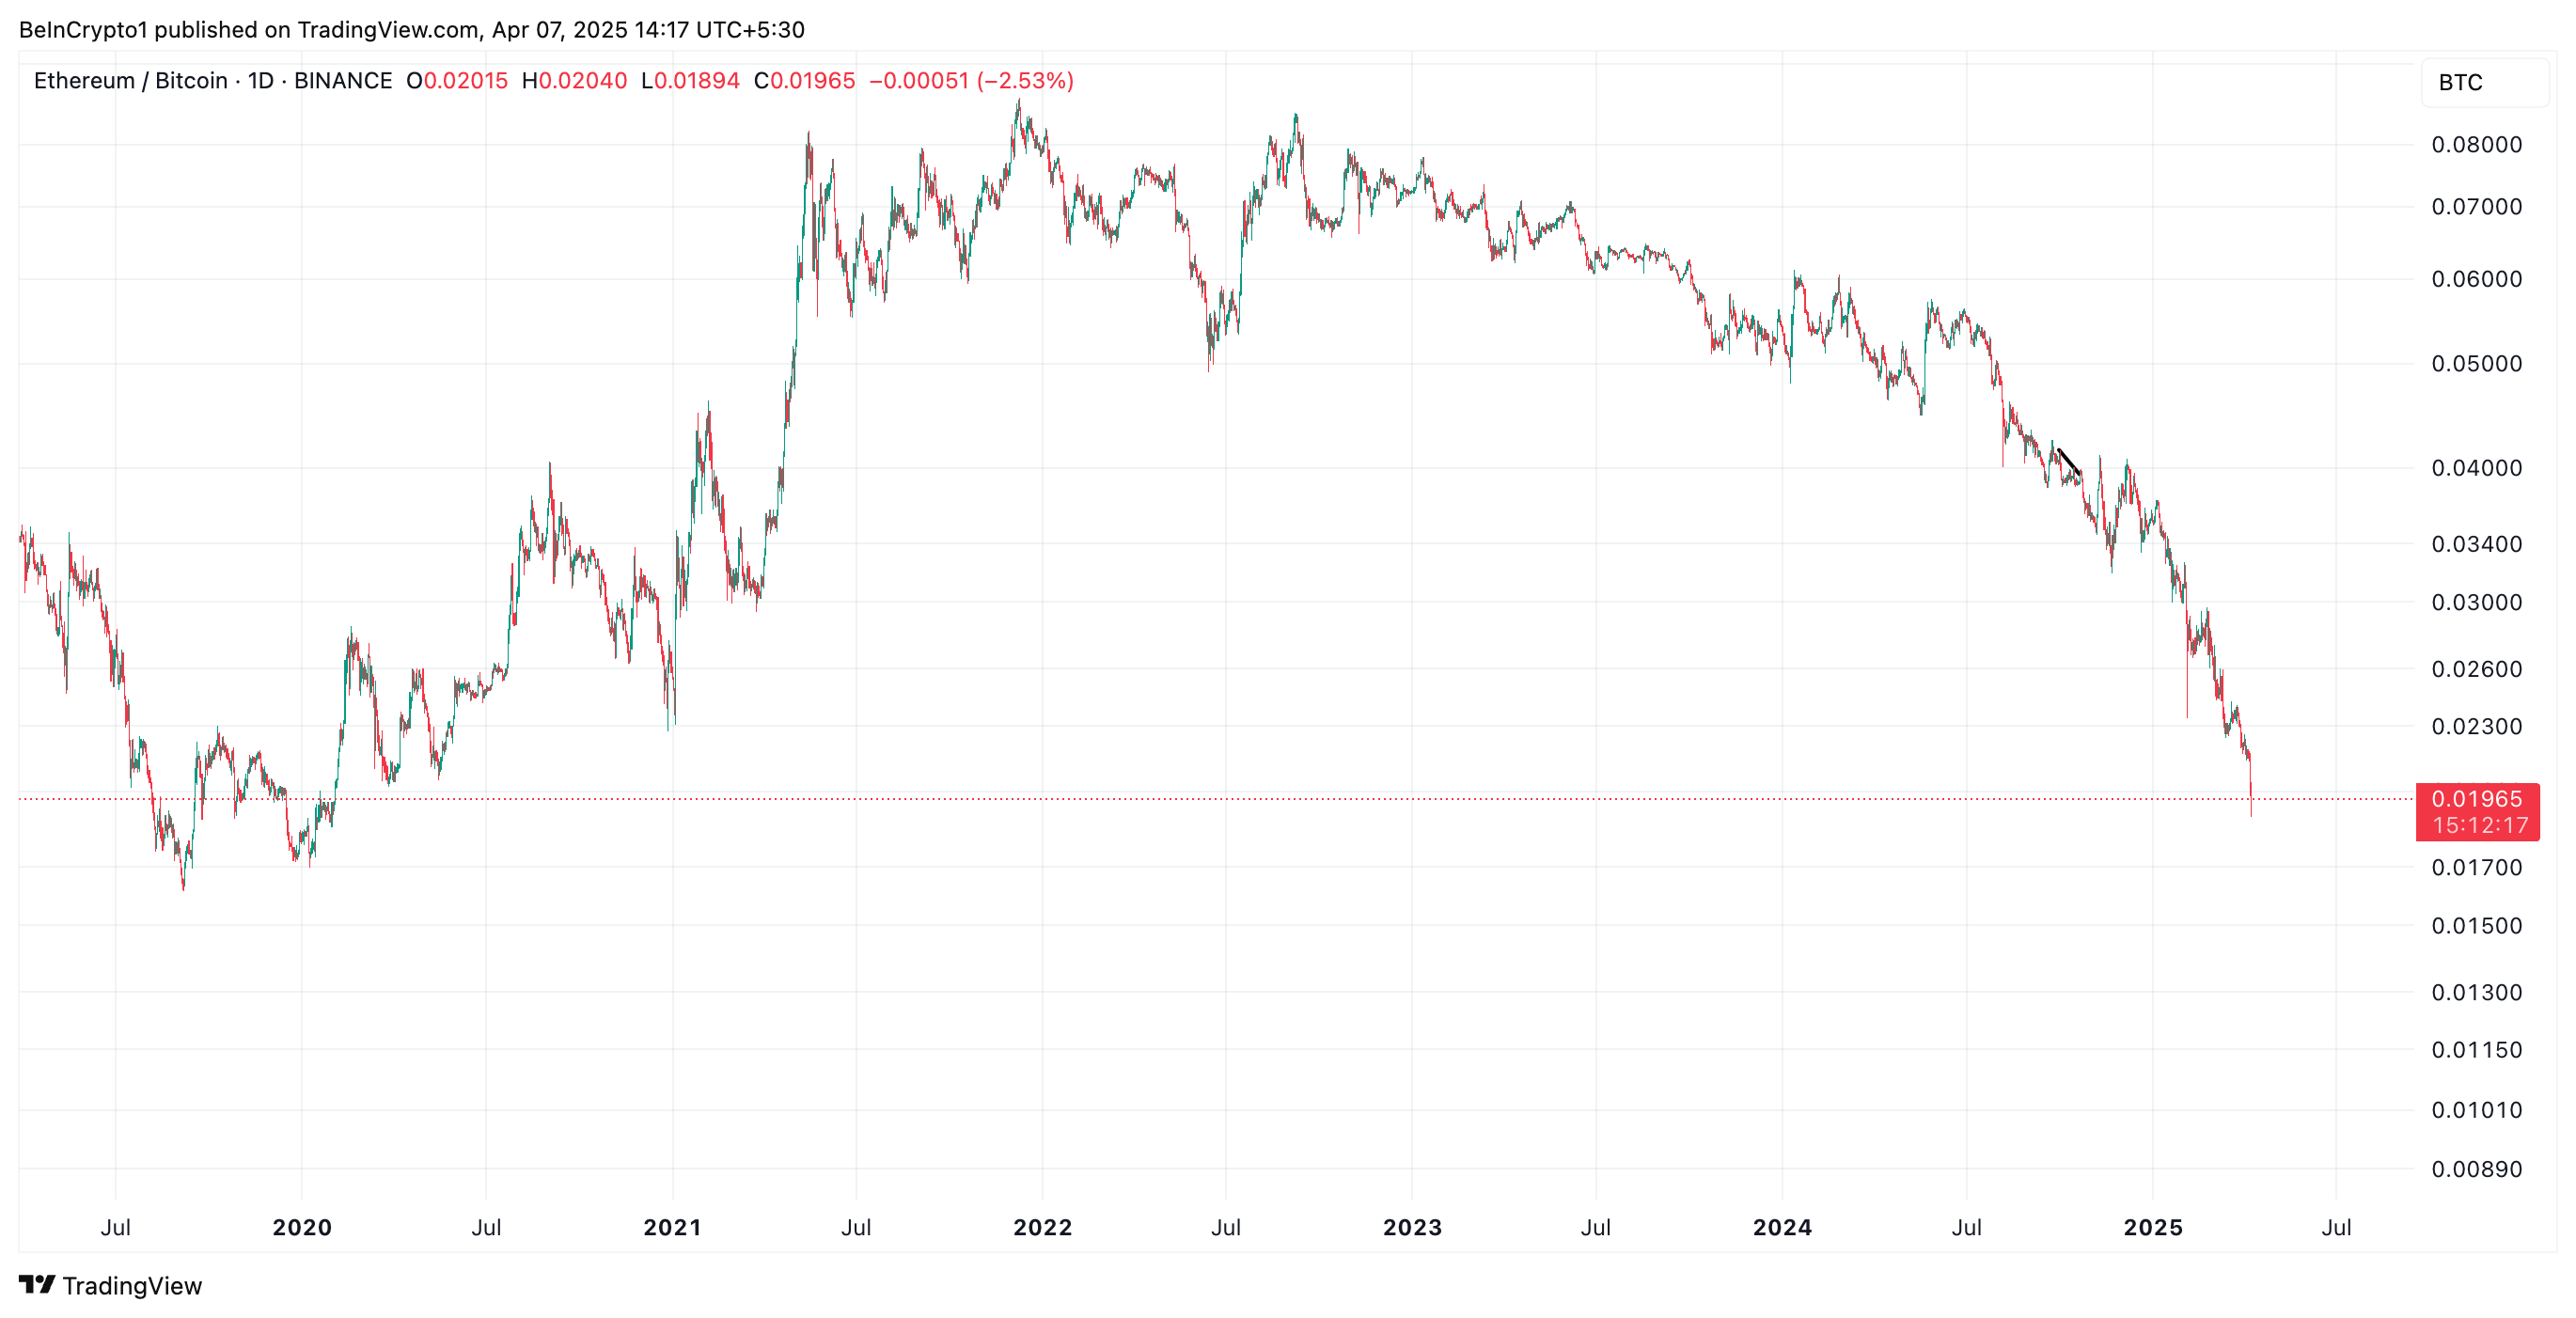
Conversely, a decline like this suggests that the leading coin, BTC, is gaining strength relative to the top altcoin, ETH. It suggests that traders are moving capital into BTC, seeing it as a safer or more profitable investment at the moment despite its own price troubles.
Further, on the daily chart, ETH’s negative Chaikin Money Flow (CMF) confirms the coin’s plummeting demand. At press time, it is at -0.07.
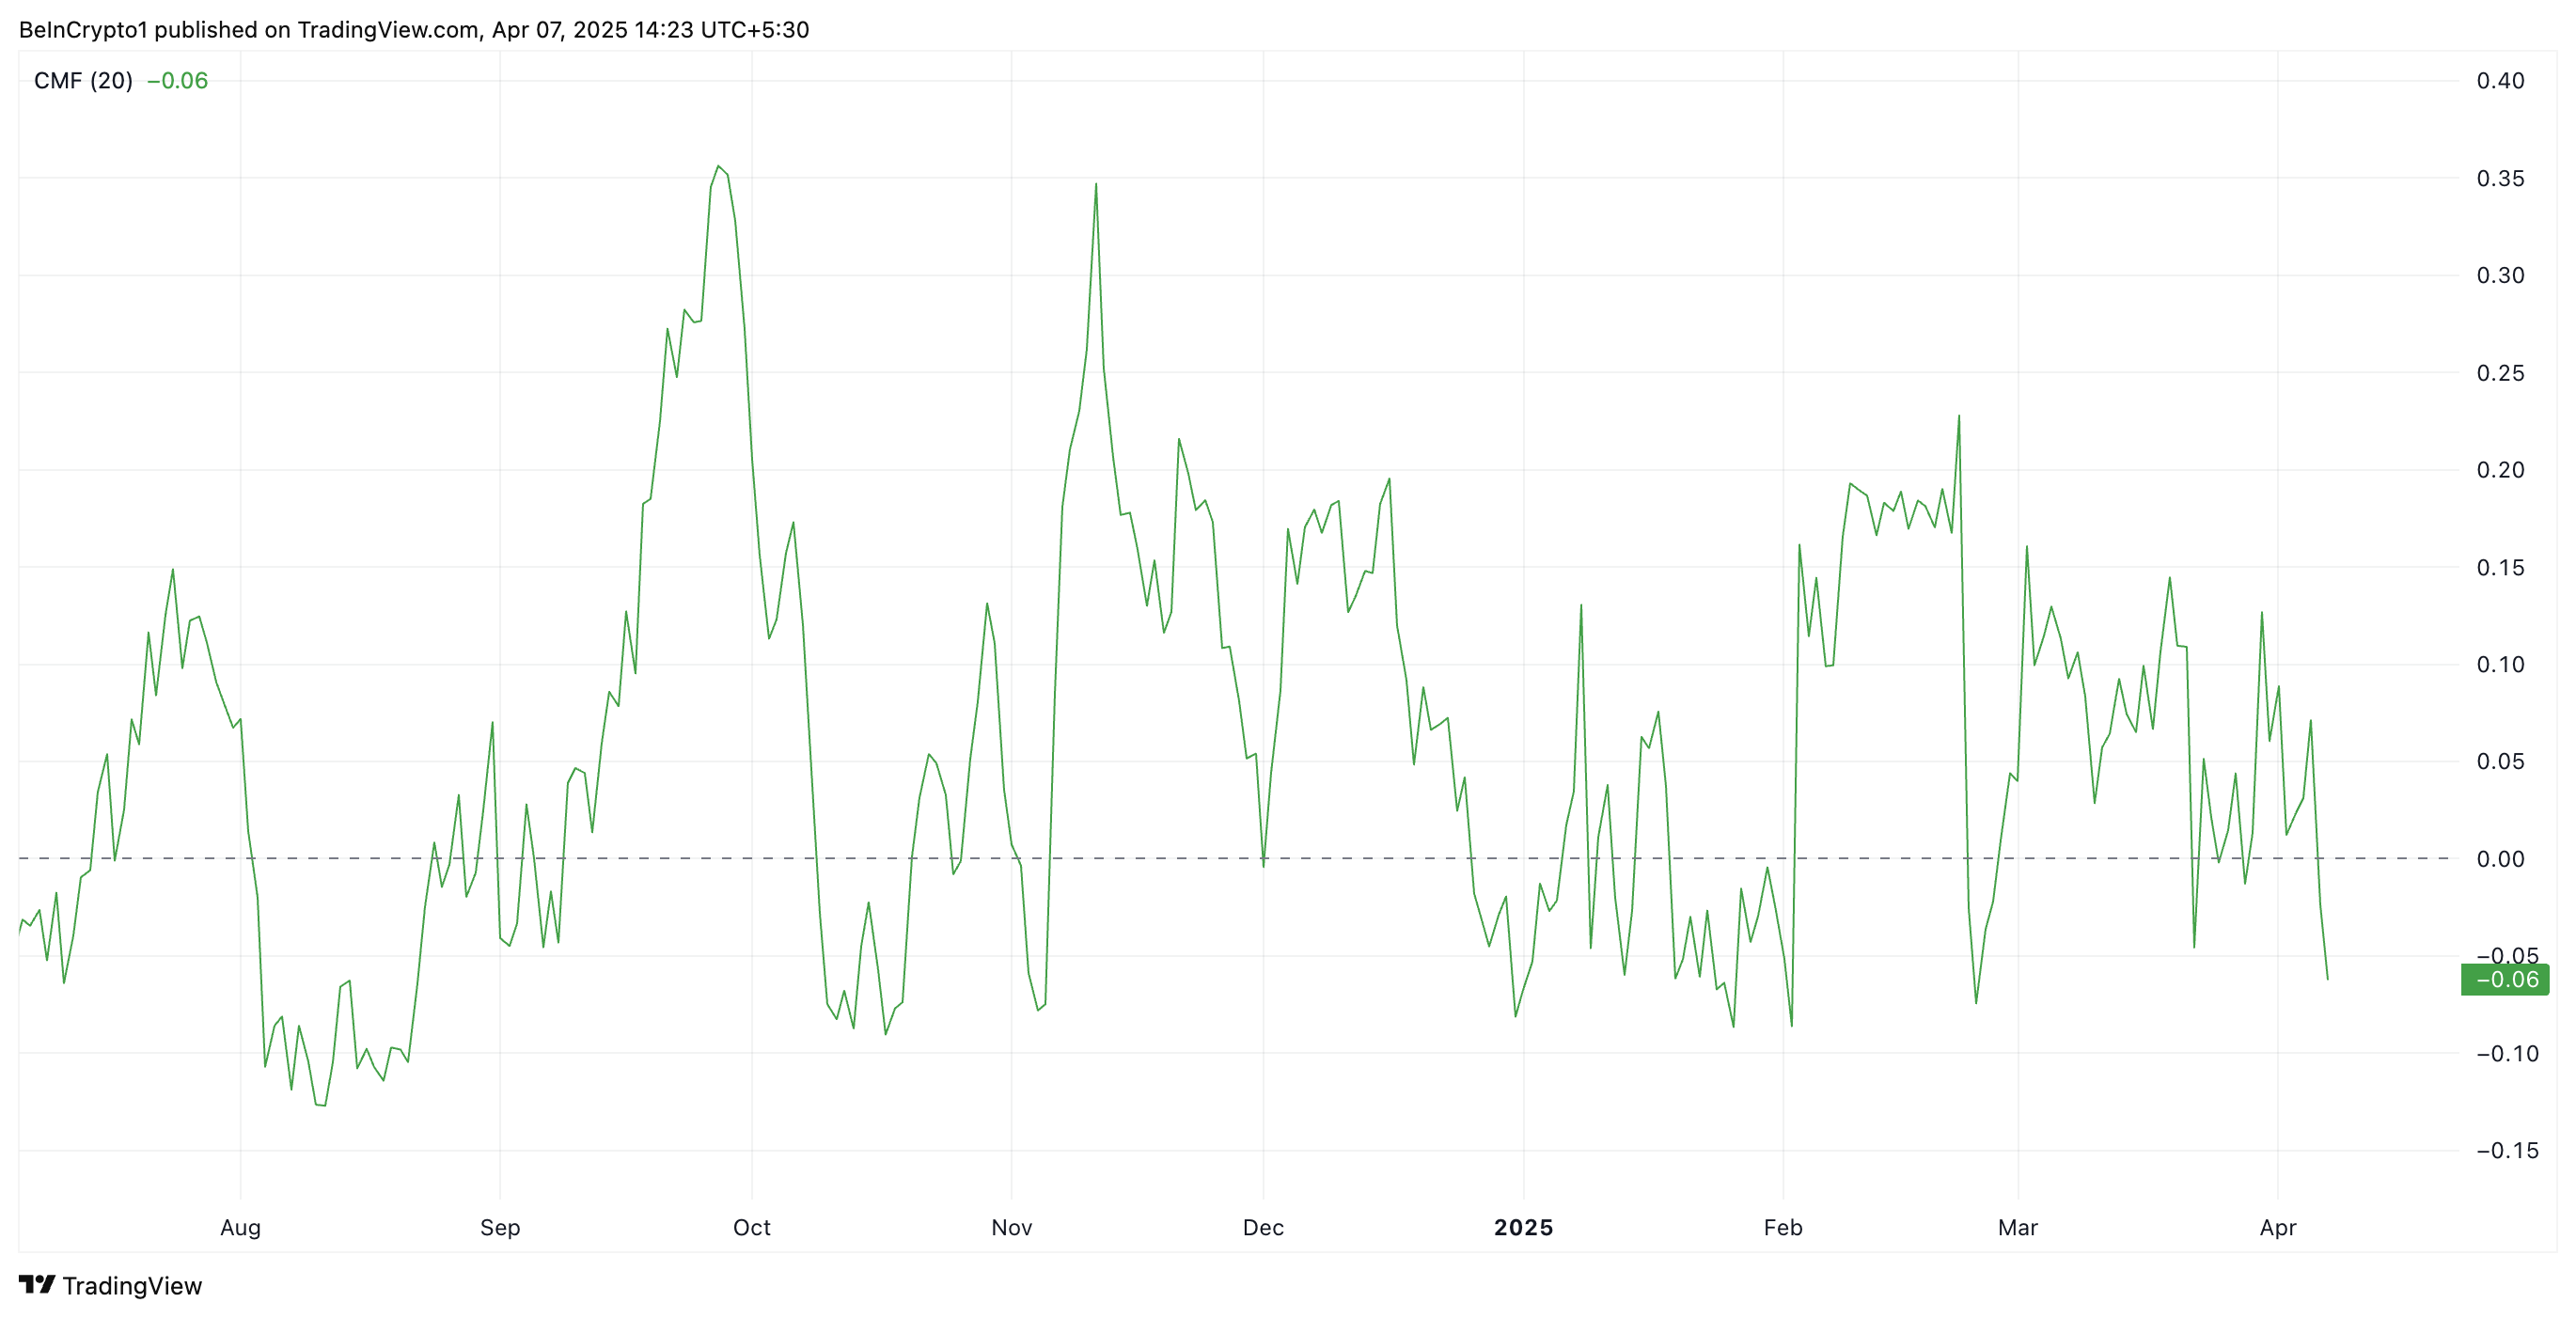
The CMF indicator measures the volume-weighted accumulation and distribution of an asset over a set period, helping gauge buying and selling pressure. When its value falls below zero like this, it indicates that selling pressure is dominating.
ETH’s CMF readings suggest that more traders are distributing (selling) the coin than accumulating it. This reflects weakening demand and is a bearish signal for the asset’s price momentum.
ETH Flashes Oversold Signal: Is a Bounce Back on the Horizon?
ETH’s Relative Strength Index (RSI), observed on a one-day chart, shows that the altcoin is currently oversold. At press time, the momentum indicator is in a downtrend at 25.62.
The RSI indicator measures an asset’s overbought and oversold market conditions. It ranges between 0 and 100. Values above 70 suggest that the asset is overbought and due for a price decline, while values under 30 indicate that the asset is oversold and may witness a rebound.
At 25.62, ETH’s RSI signals that the coin is deeply oversold. This presents a buying opportunity, as such lows are usually followed by a price rebound.
If this happens, ETH’s price could regain and climb back above $1,589. If this support level strengthens, it could propel ETH’s value to $1,904.
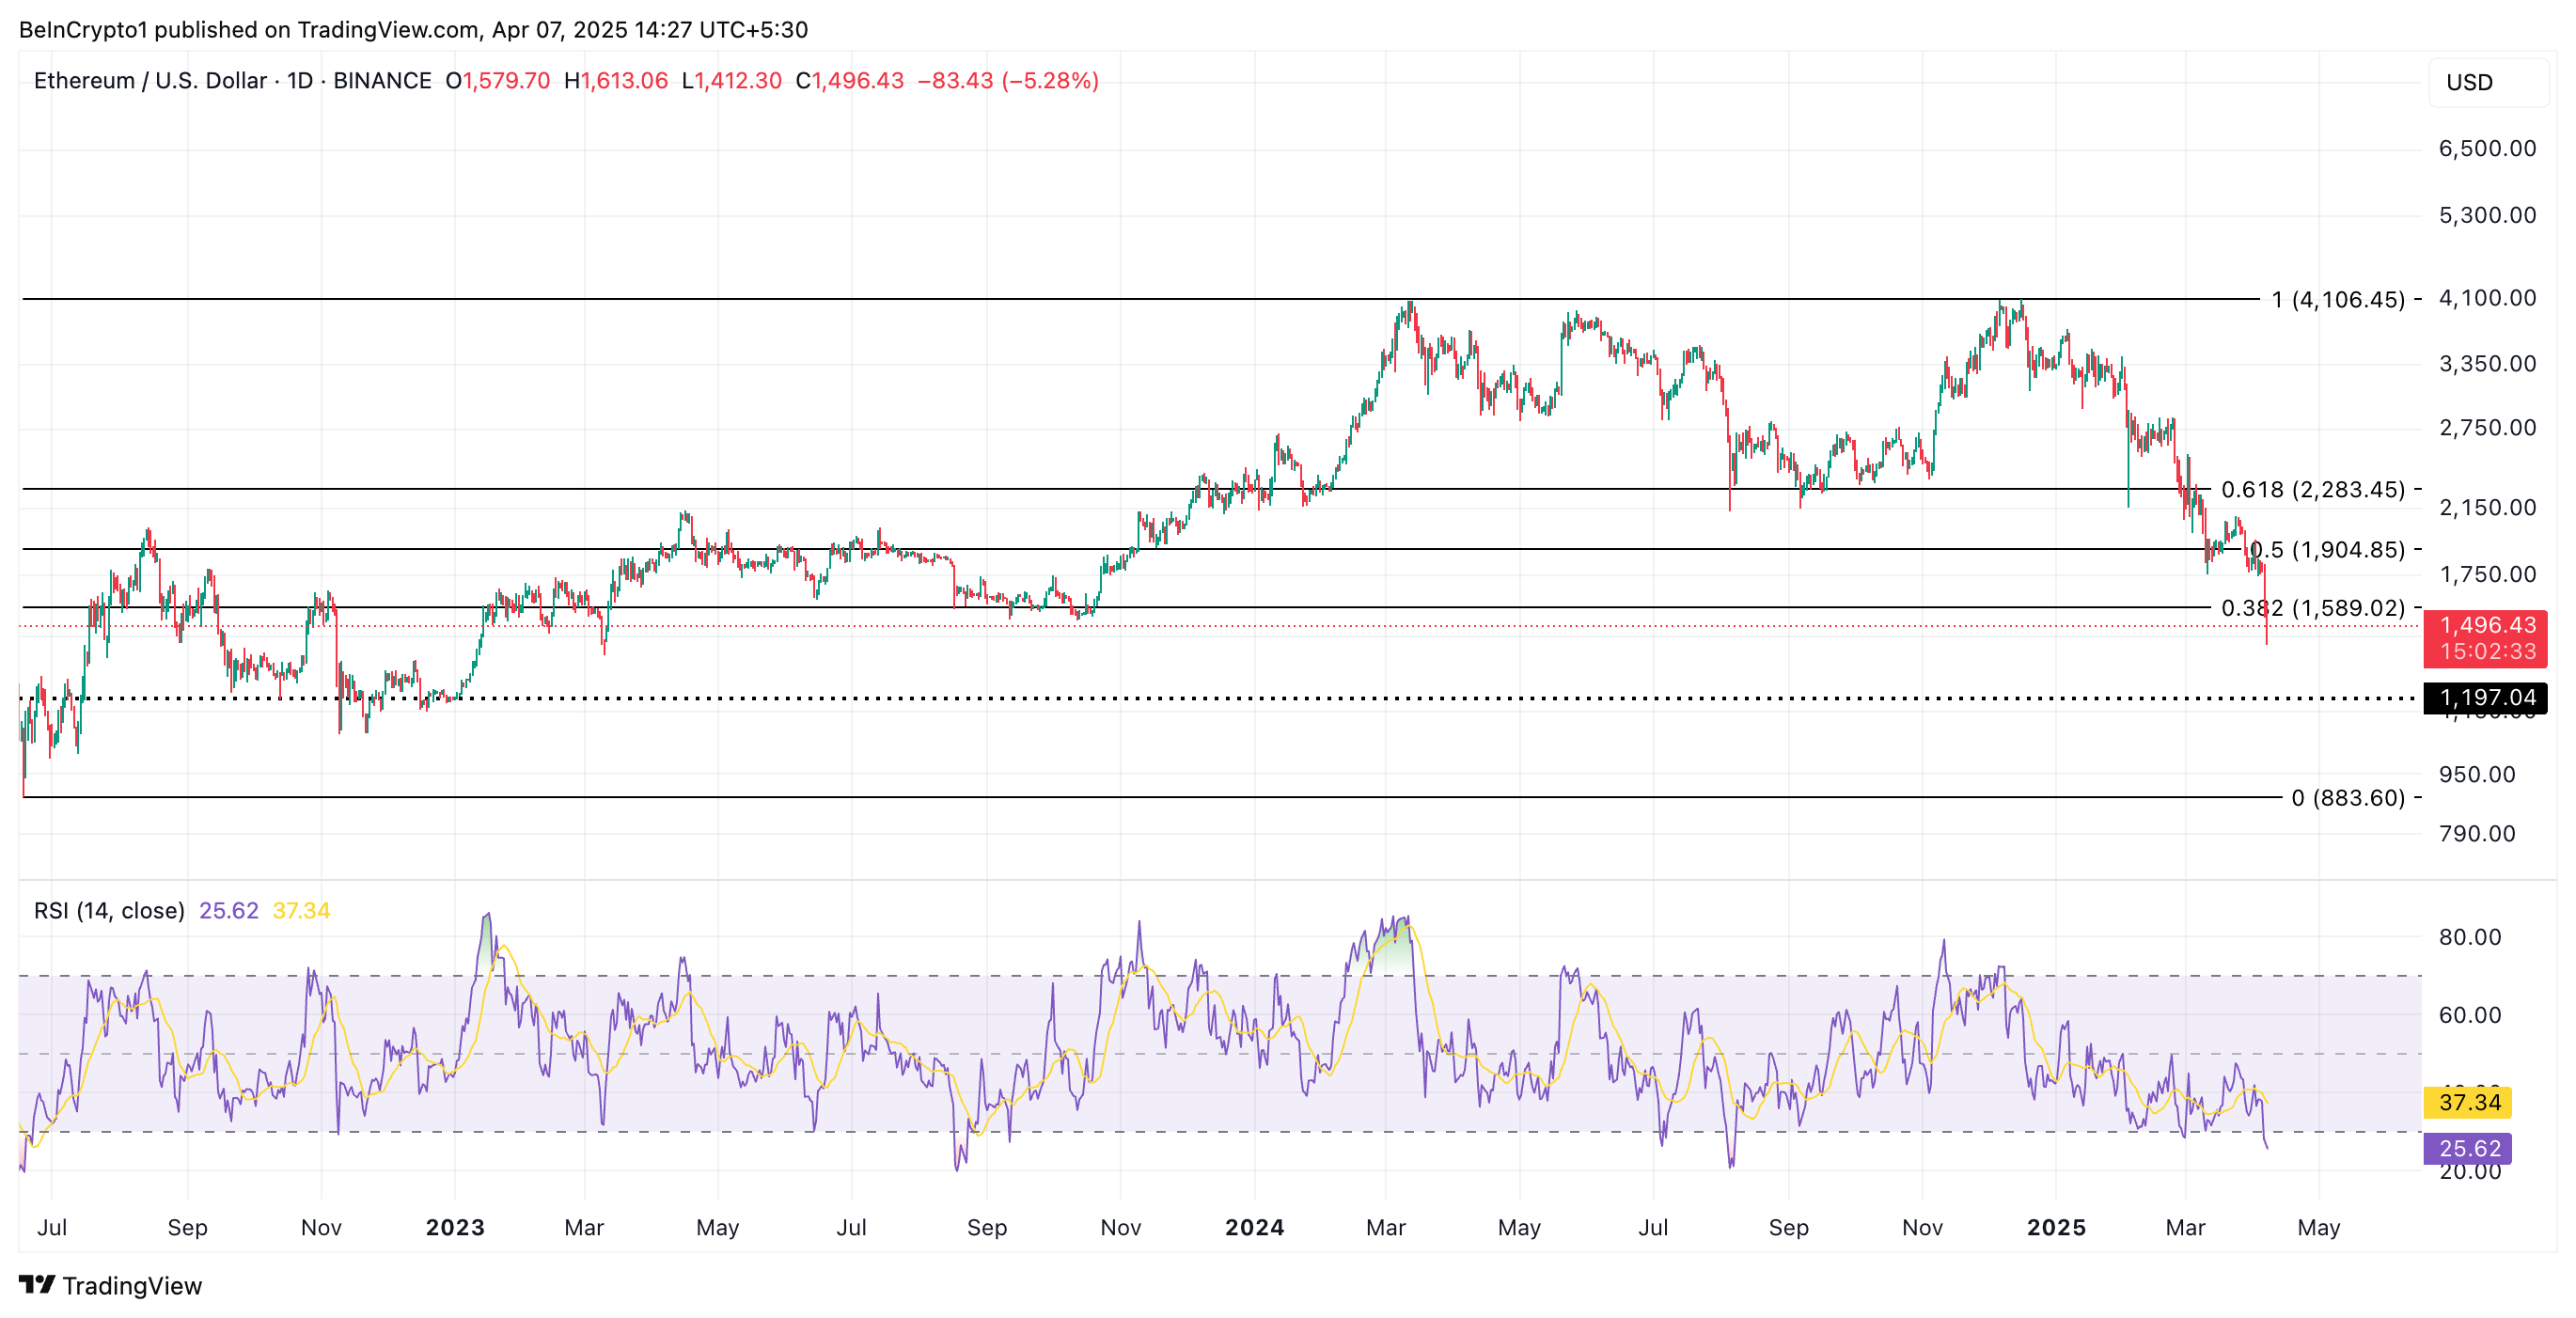
However, this rebound is not guaranteed. If ETH bears maintain dominance and selloffs continue, the coin could extend its decline and fall toward $1,197.
The post Ethereum (ETH) Tanks to March 2023 Levels as ETH/BTC Ratio Plummets to 5-Year Low appeared first on BeInCrypto.
CoinGecko unveiled a refreshed brand identity and two new mascots, marking the 11th anniversary of the crypto data aggregator.
The changes come amid a bruising “Crypto Black Monday,” with CoinGecko’s brand revitalization presenting as a show of optimism despite sour sentiment.
CoinGecko Resets Its Brand on 11th Anniversary
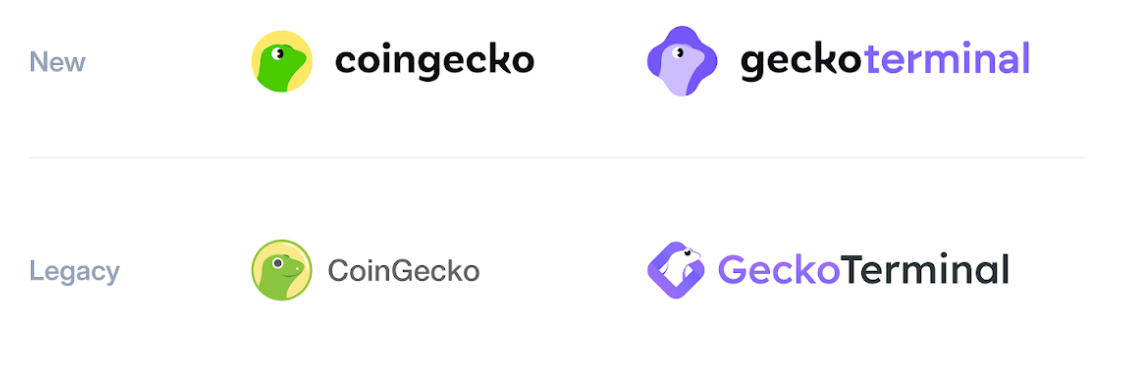
CoinGecko leaned into Monday’s turbulence with the message that growth is still on the table despite sour crypto market sentiment. Marking its 11th anniversary, the crypto data aggregator introduced a new visual identity.

The change features a modernized logo, a more interactive and user-friendly design system, and a cohesive brand refresh. These changes extend to GeckoTerminal, its DEX aggregator that tracks real-time trading data from over 1,500 decentralized exchanges.
CoinGecko users will henceforth encounter Gekko and Rex as two new mascots. In a statement shared with BeInCrypto, CoinGecko said these mascots embody the duality of the crypto experience.
On the one hand, Gekko is a playful and geeky friend offering insights. On the other hand, Rex is sharp, analytical, and always on the hunt for alpha.
“This brand refresh marks a new chapter for CoinGecko, as we continue building for the decentralized future,” an excerpt in the statement read, citing TM Lee, CEO and co-founder of CoinGecko.
Lee explained that this refresh was for the crypto community, which has continuously leveraged CoinGecko’s crypto data aggregator across market cycles. The changes are intended to make CoinGecko more relatable and forward-looking, emulating the industry’s spirit of resilience and innovation.
Refresh in the Face of Crypto Black Monday
This show of optimism comes in time to boost user sentiment after a weekend bloodbath that set the pace for crypto’s black Monday narrative. Liquidations swept the crypto market over the weekend, triggering millions of losses.
The company acknowledged the market stress in a post teasing the launch just hours before the unveiling.
“We know it’s not the easiest day for crypto. Still, something new is on the way,” wrote CoinGecko on X (Twitter).
CoinGecko was founded in April 2014. It has grown from a price-tracking site into a comprehensive crypto data platform serving millions worldwide. The aggregator reportedly monitors over 17,000 cryptocurrencies and NFTs (non-fungible tokens) across over 1,200 exchanges.
Its on-chain analytics platform, GeckoTerminal, launched in 2022, has since become an expansive DEX aggregator. According to the report, GeckoTerminal tracks over 6 million tokens across more than 200 blockchain networks.
Meanwhile, CoinGecko’s brand update is more than cosmetic. It reflects the platform’s consistent effort to stay relatable to its user base.
Recently, it has been a go-to source for key market insights. Among them was a 2025 sentiment survey, which revealed mixed investor moods and highlighted a strong belief in the rise of crypto-AI.
CoinGecko has also been instrumental in reflecting changing user behavior in the industry. Recently, the platform shared a 2024 analysis showing crypto perpetuals trading volumes reaching all-time highs. Similarly, the data aggregator shared a report pointing out that publicly listed crypto companies account for just 5.8% of the market cap.
By launching a branding overhaul during one of the year’s harshest market downturns, CoinGecko sends a clear message that beyond surviving, crypto is also preparing for what is next.
As the dust settles from the weekend sell-off and key US economic indicators are in the pipeline, CoinGecko’s refreshed look suggests the next chapter is always around the corner.
Disclaimer
In adherence to the Trust Project guidelines, BeInCrypto is committed to unbiased, transparent reporting. This news article aims to provide accurate, timely information. However, readers are advised to verify facts independently and consult with a professional before making any decisions based on this content. Please note that our Terms and Conditions, Privacy Policy, and Disclaimers have been updated.

Reason to trust
![]()
Strict editorial policy that focuses on accuracy, relevance, and impartiality
Created by industry experts and meticulously reviewed
The highest standards in reporting and publishing
Strict editorial policy that focuses on accuracy, relevance, and impartiality
Morbi pretium leo et nisl aliquam mollis. Quisque arcu lorem, ultricies quis pellentesque nec, ullamcorper eu odio.
Bitcoin price started a fresh decline below the $83,500 zone. BTC is consolidating losses and might start another decline below the $80,000 level.
- Bitcoin started a fresh decline below the $82,000 zone.
- The price is trading below $81,200 and the 100 hourly Simple moving average.
- There was a break below a connecting bullish trend line with support at $83,000 on the hourly chart of the BTC/USD pair (data feed from Kraken).
- The pair could start another increase if it clears the $80,500 zone.
Bitcoin Price Dips Below Support
Bitcoin price failed to settle above the $83,500 level and started a fresh decline. BTC traded below the $83,000 ad $82,000 levels to enter a bearish zone.
There was a break below a connecting bullish trend line with support at $83,000 on the hourly chart of the BTC/USD pair. The pair even dived below the $80,000 support zone. A low was formed at $77,057 and the price started a recovery wave.
There was a move above the $78,800 level. The price climbed above the 23.6% Fib retracement level of the recent decline from the $83,680 swing high to the $77,057 low. However, the price is struggling to continue higher.
Bitcoin price is now trading below $81,500 and the 100 hourly Simple moving average. On the upside, immediate resistance is near the $80,000 level. The first key resistance is near the $80,500 level or the 50% Fib retracement level of the recent decline from the $83,680 swing high to the $77,057 low.

The next key resistance could be $81,500. A close above the $81,500 resistance might send the price further higher. In the stated case, the price could rise and test the $82,500 resistance level. Any more gains might send the price toward the $83,500 level.
Another Decline In BTC?
If Bitcoin fails to rise above the $80,500 resistance zone, it could start a fresh decline. Immediate support on the downside is near the $77,500 level. The first major support is near the $77,000 level.
The next support is now near the $76,500 zone. Any more losses might send the price toward the $75,000 support in the near term. The main support sits at $74,200.
Technical indicators:
Hourly MACD – The MACD is now gaining pace in the bearish zone.
Hourly RSI (Relative Strength Index) – The RSI for BTC/USD is now below the 50 level.
Major Support Levels – $77,500, followed by $77,000.
Major Resistance Levels – $80,000 and $80,500.

Ethereum (ETH) Tanks to March 2023 Levels as ETH/BTC Ratio Plummets to 5-Year Low

Bitcoin Drop Hits Companies Holding Digital Assets Hard

CoinGecko Refreshes Brand During Crypto Black Monday Chaos

5 US Economic Events With Crypto Market Implications This Week

Bitcoin Price Crashes Hard—Is The Selloff Just Getting Started?

Will ADA Drop to $0.44?


-
 Altcoin18 hours ago
Expert Reveals Decentralized Strategy To Stabilize Pi Network Price
-

 Bitcoin21 hours ago
US Macro Setup To Favour New Bitcoin ATH In The Long Run
-

 Market17 hours ago
Bitcoin Price Drops Below $80,000 Amid Heavy Weekend Selloff
-

 Market23 hours ago
Celestia (TIA) Price’s 30% Crash Prolonging Could Bring Recovery
-

 Market22 hours ago
Ripple Highlights UK’s Potential to Become Global Crypto Hub
-

 Market21 hours ago
Key Solana Holders’ 6-Month High Accumulation Signal Price Rise
-

 Market20 hours ago
3 Token Unlocks for This Week: AXS, JTO, XAV
-

 Ethereum20 hours ago
Ethereum Lags Behind Bitcoin In Q1 Performance Amid Market Downturn – Details
 Arabic
 Chinese (Simplified)
 Dutch
Dutch English
 French
 German
 Italian
 Portuguese
 Russian
 Spanish
 Vietnamese