Market
Why Ethereum Price May Shed Recent Gains

Ethereum (ETH) has experienced a modest 1% price increase over the past 24 hours, reflecting the broader cryptocurrency market’s uptrend. This rebound comes after a week-long decline, largely attributed to political tensions in the Middle East.
Although the rally offers temporary relief for ETH holders, BeInCrypto’s analysis indicates it may be short-lived. Weak on-chain demand and a persistent bearish sentiment surrounding the altcoin suggest that the recovery could struggle to maintain momentum.
Ethereum Witnesses Poor Demand
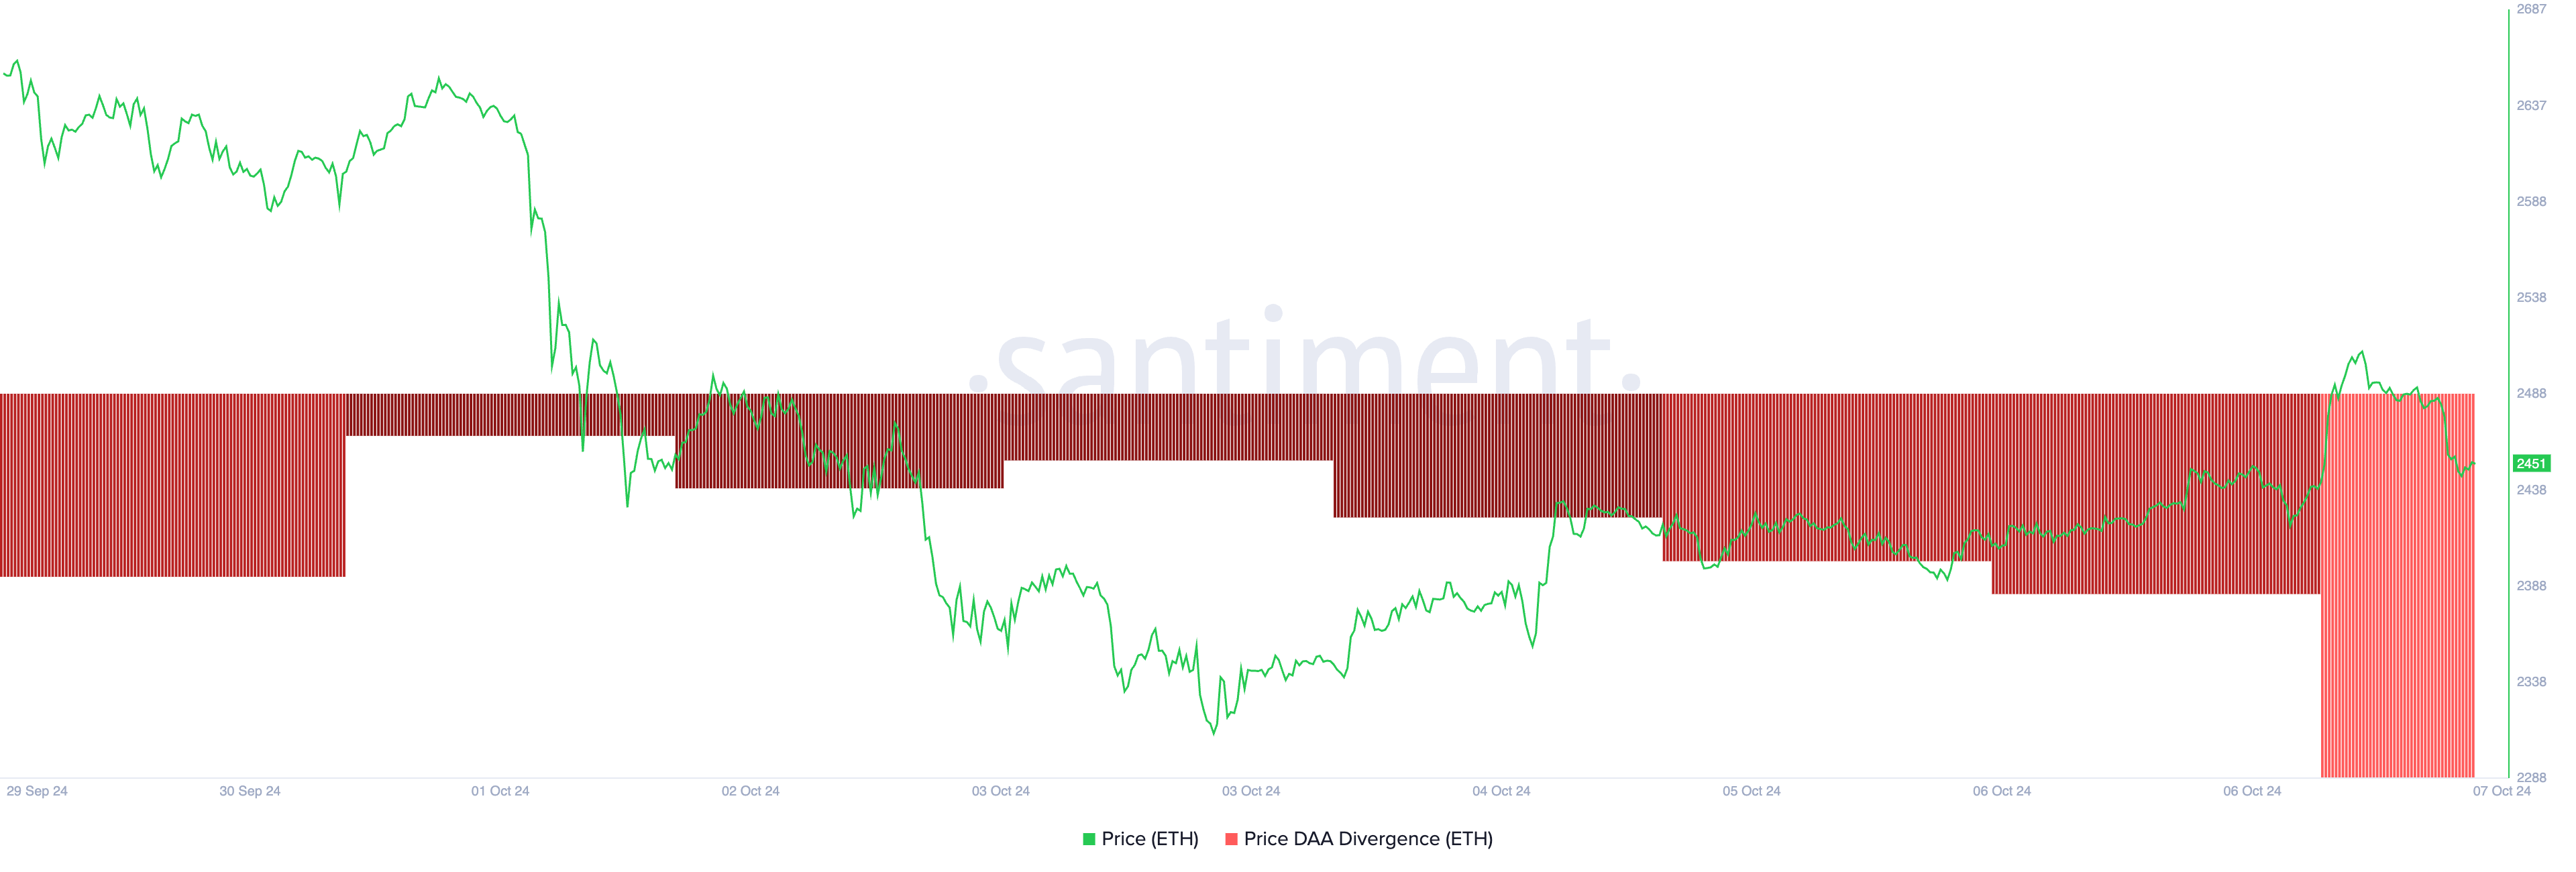
The negative readings from ETH’s price daily active address (DAA) divergence reflect the poor demand for the altcoin among market participants. This metric, which measures an asset’s price movements with the changes in its number of daily active addresses, is at -70.34% at press time.
For context, DAA have remained negative despite its price rally since last weekend. Historically, when an asset’s price rises while active addresses decrease, it’s considered a sell signal. This suggests the rally is driven by speculation rather than real demand, implying that the price surge may be short-lived.
Read more: How to Invest in Ethereum ETFs?

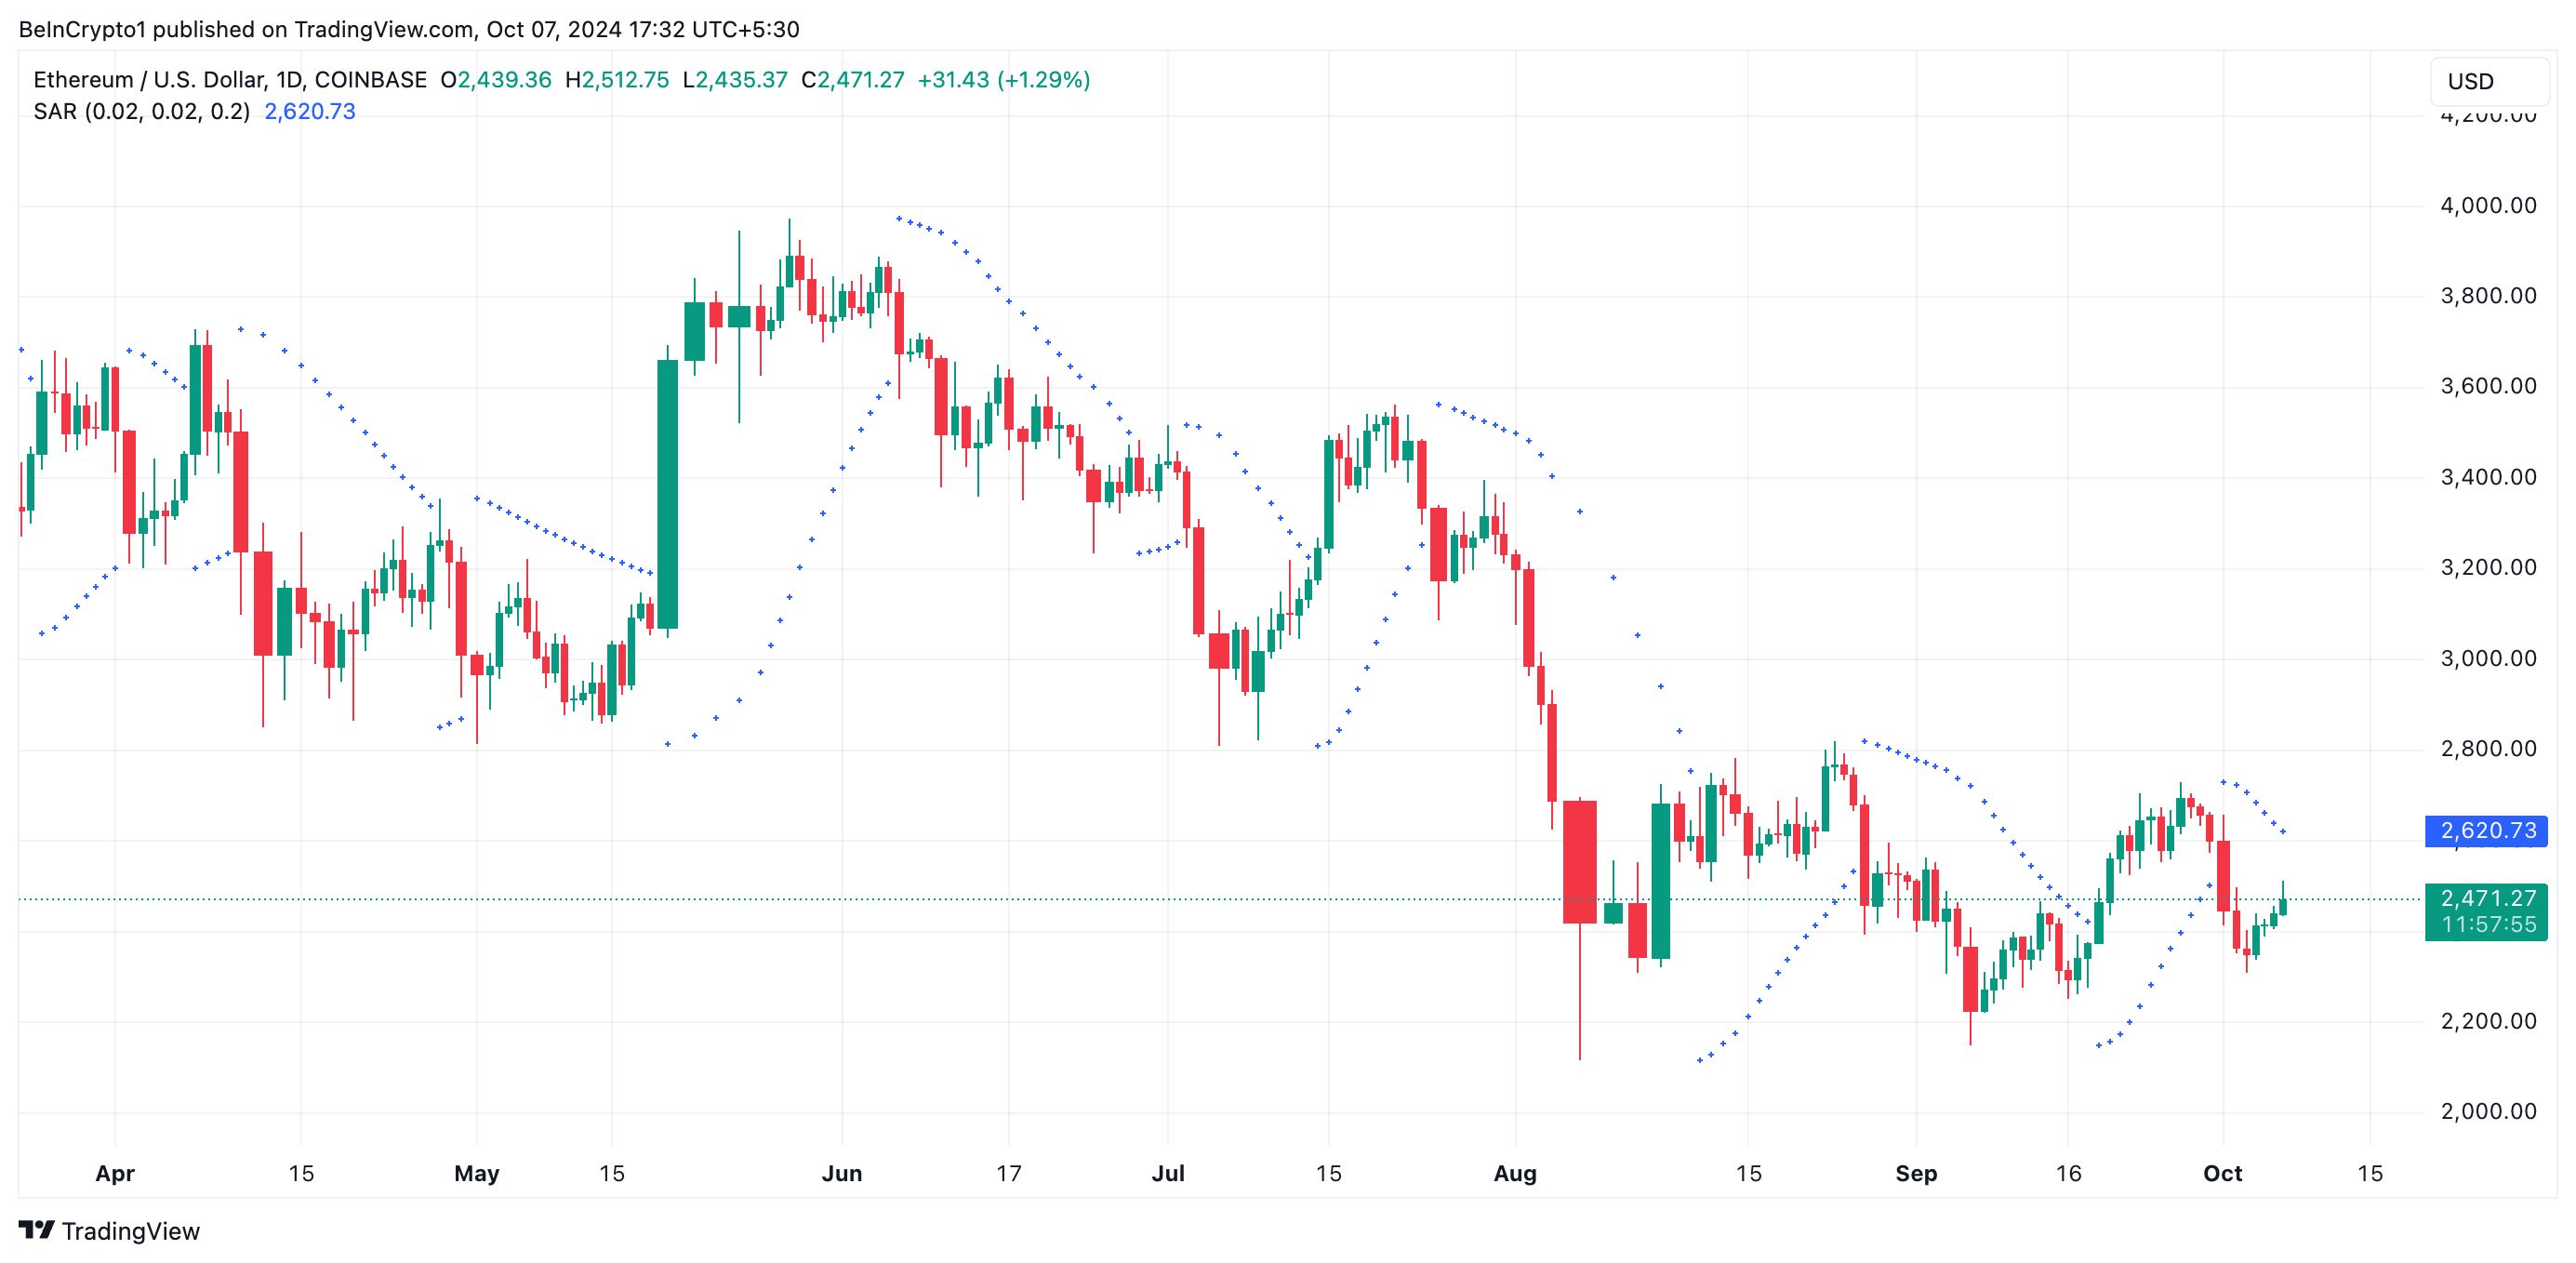
Furthermore, Ethereum’s Parabolic Stop and Reverse (SAR) indicator, which helps identify trend direction and potential reversal points, reinforces the bearish outlook. Currently, the indicator’s dots are positioned above ETH’s price.
When the Parabolic SAR dots appear above an asset’s price, it signals downward pressure and suggests that the trend is likely bearish. Traders typically view this as an indicator to hold or consider initiating short positions, expecting further price declines.

ETH Price Prediction: August 5 Low on the Horizon
The Parabolic SAR dots above the price can act as a form of dynamic resistance. If the price tries to rise, it might face selling pressure near these dots, reinforcing the bearish trend.
These dots currently rest at $2620, suggesting that ETH will face a surge in selling pressure once it approaches this level. If selling pressure strengthens, Ethereum’s price risks falling 14% to its August 5 low of $2,116.
Read more: Ethereum (ETH) Price Prediction 2024/2025/2030
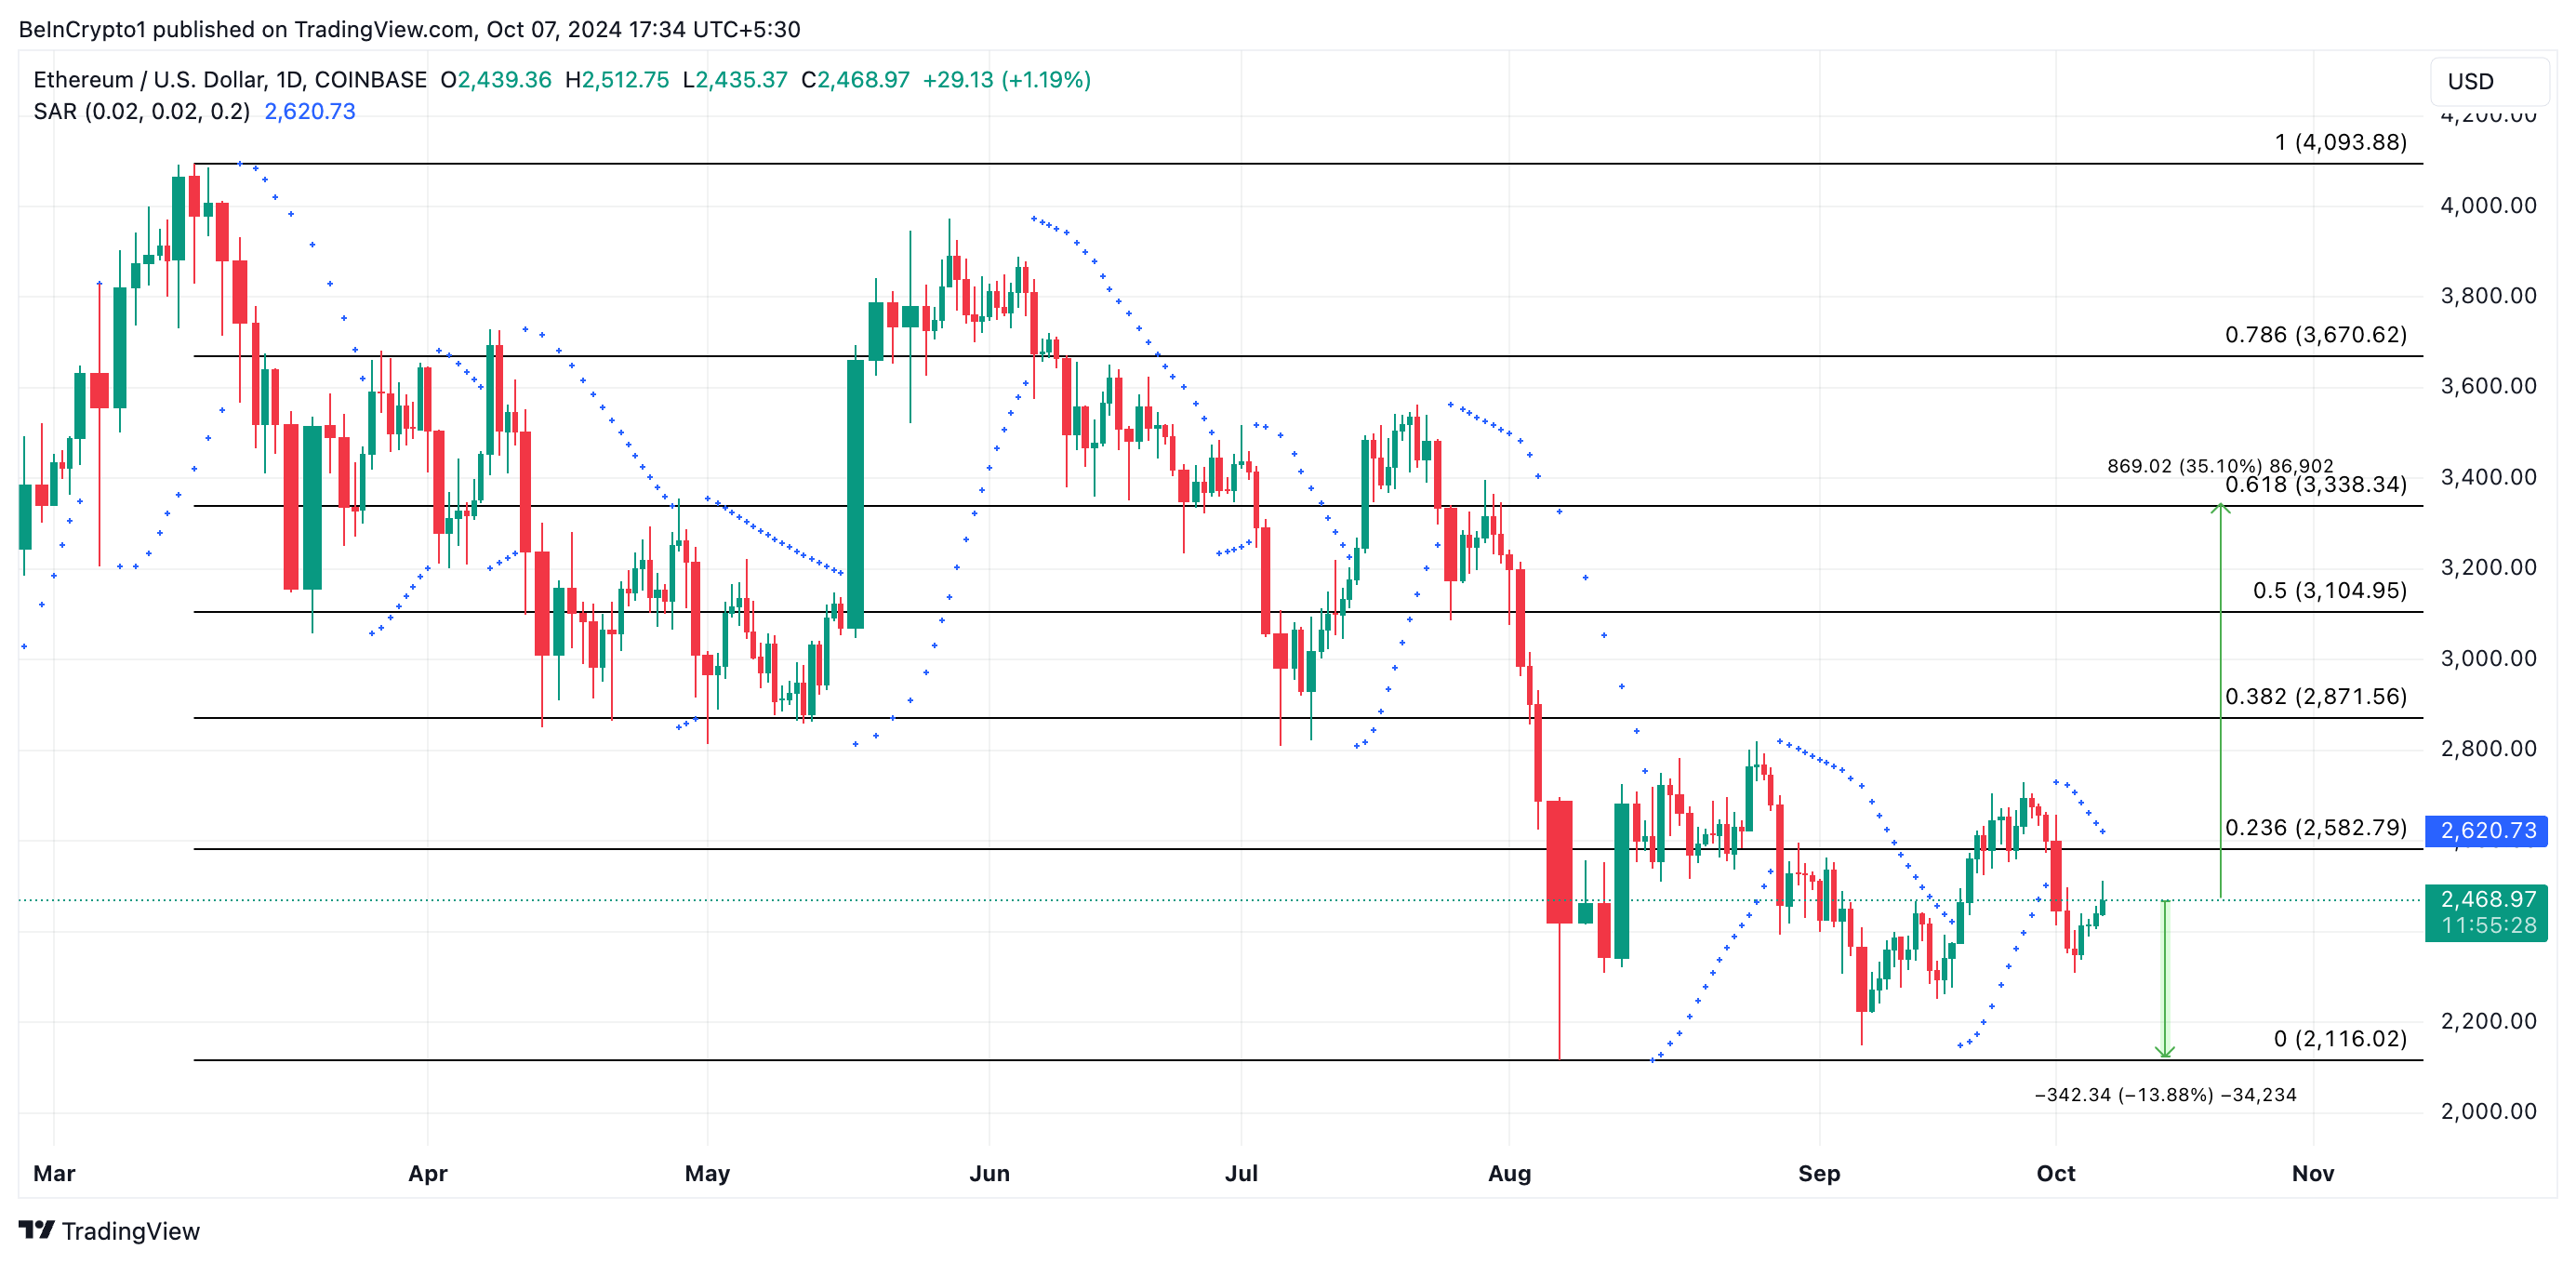
However, if it witnesses a resurgence in demand, ETH may break above the resistance formed at the $2,700 price level and target $3,338.
Disclaimer
In line with the Trust Project guidelines, this price analysis article is for informational purposes only and should not be considered financial or investment advice. BeInCrypto is committed to accurate, unbiased reporting, but market conditions are subject to change without notice. Always conduct your own research and consult with a professional before making any financial decisions. Please note that our Terms and Conditions, Privacy Policy, and Disclaimers have been updated.