Market
When Will Ethereum Turn Deflationary?

Over the past 30 days, 62,699 ETH, valued at $172 million at current market prices, have been added to the leading altcoin’s circulating supply.
The circulating supply now stands at 120.30 million ETH, marking its highest level since the year began.
Ethereum Sees Decline in Activity and Burn Rate
According to data from Ultrasound.money, ETH’s circulating supply has steadily risen since April 14.
An asset’s circulating supply refers to the number of coins or tokens available to the public. It increases when more tokens become available for trading. In Ethereum’s case, this supply growth happens when the network witnesses a demand drop, reducing the burn rate.

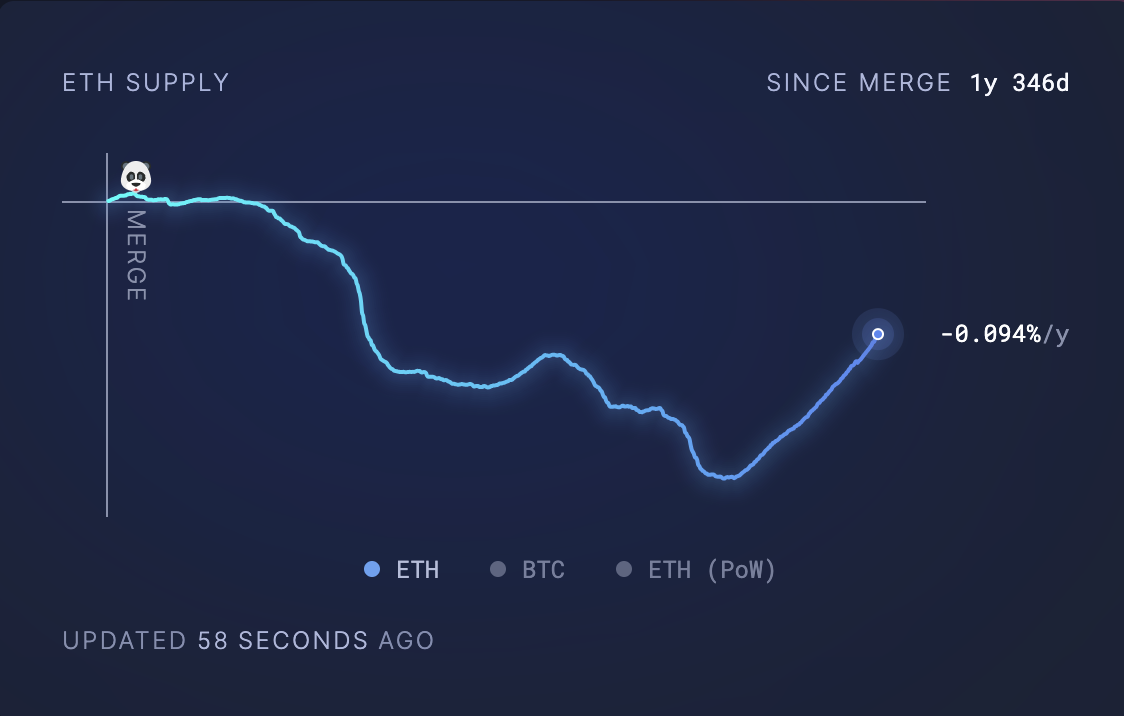
Typically, as more users transact and engage with Ethereum, the burn rate — measuring ETH tokens permanently removed from circulation — increases, driving Ethereum’s deflationary supply dynamic. However, when user activity drops, the burn rate also declines, leaving more coins in circulation and expanding the circulating supply.
User activity on Ethereum has been trending downward in recent months. Data from Artemis reveals that since daily active addresses peaked at 611,000 on June 22, the number of users on Ethereum has decreased by 37%.
Read more: How to Invest in Ethereum ETFs?

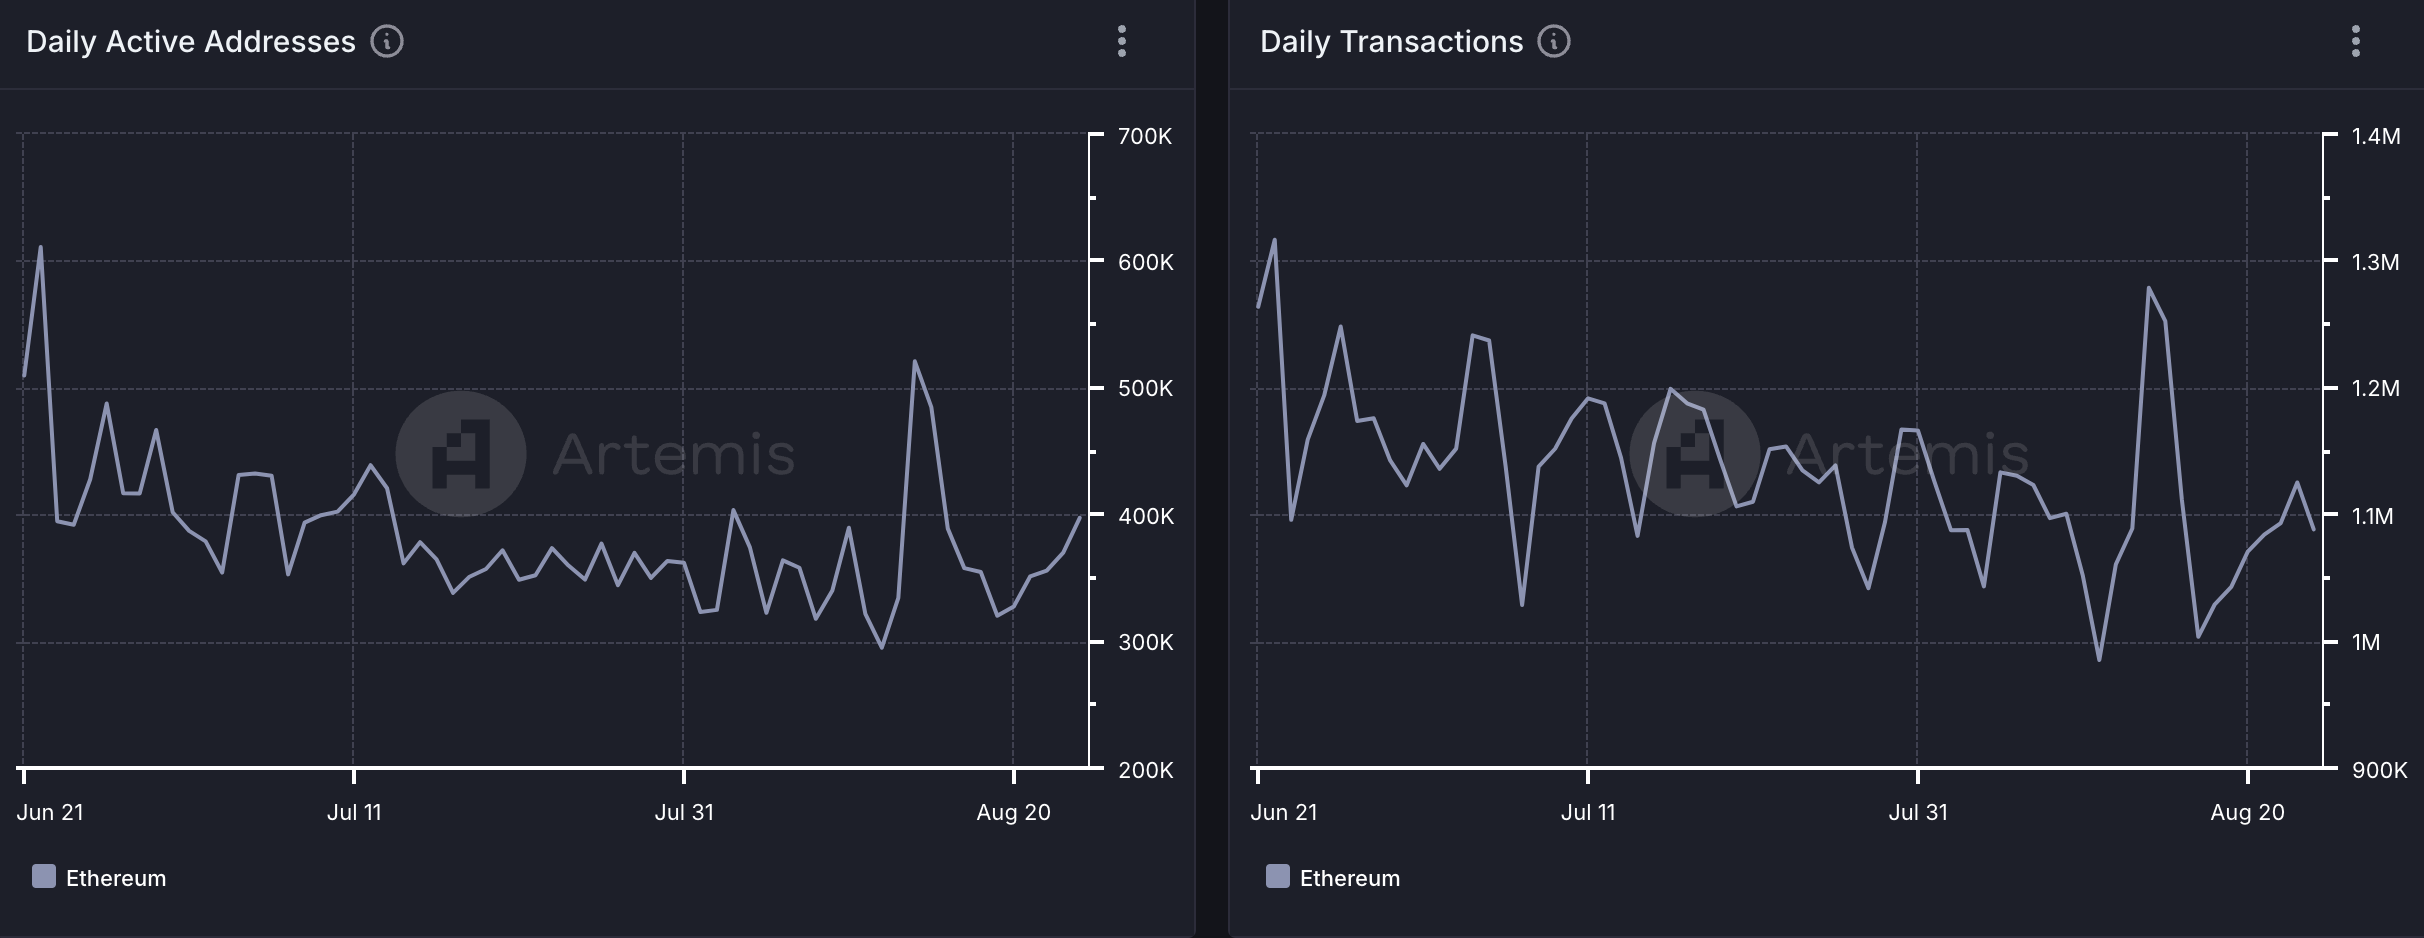
As a result, the number of daily transactions completed on the network has also plunged. Per Artemis, since climbing to a high of 1.3 million on June 22, the daily count of unique on-chain interactions with Ethereum has decreased by 15%.
ETH Price Prediction: Buyers and Sellers Take Some Time Off
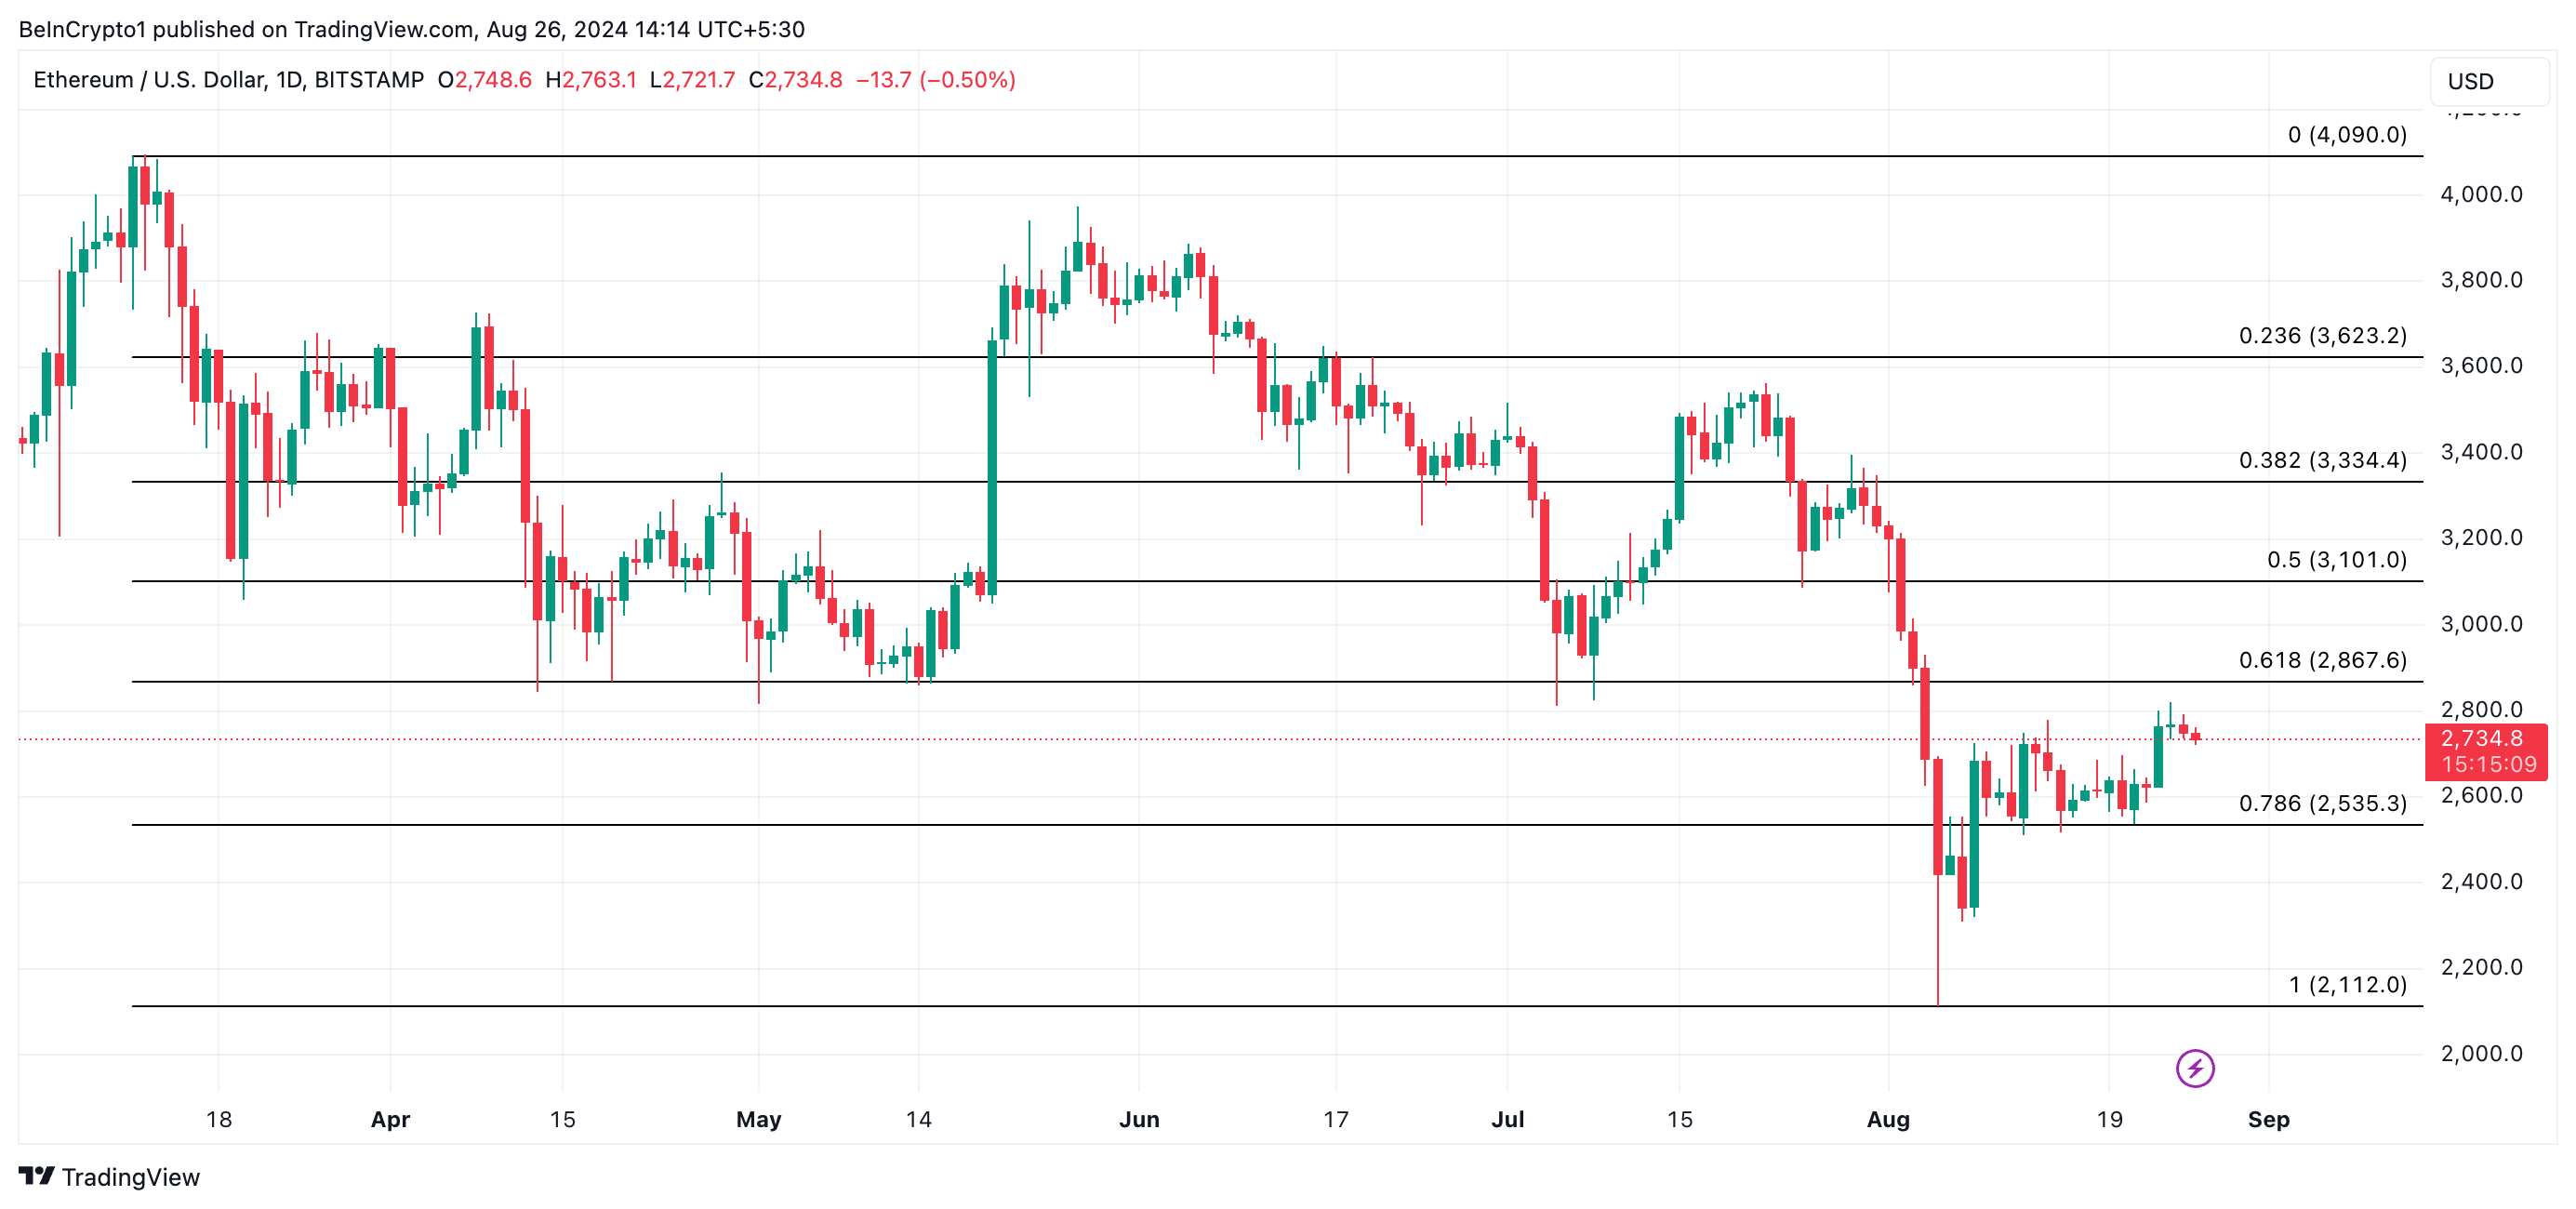
When more ETH tokens enter circulation, the overall supply available for purchase generally increases. This can lead to a price decline if supply outpaces demand. This scenario has unfolded as ETH struggles to break above the $3,000 price mark since the beginning of the month.
At press time, ETH trades at $2,742, reflecting a 15% drop over the past 30 days due to the broader market downturn. However, in recent days, the market has stabilized, showing a relative balance between buying and selling pressures. This is evidenced by the flat Relative Strength Index (RSI).
Read more: Ethereum (ETH) Price Prediction 2024/2025/2030

When an asset’s RSI is flat, it indicates that it is neither overbought nor oversold, suggesting a period of market indecision or consolidation. When this happens, traders are waiting for a catalyst to trigger either a buying or selling spree.
A surge in accumulation could push ETH toward a price target of $2,867. On the flip side, increased distribution might drive it down to $2,535.
Disclaimer
In line with the Trust Project guidelines, this price analysis article is for informational purposes only and should not be considered financial or investment advice. BeInCrypto is committed to accurate, unbiased reporting, but market conditions are subject to change without notice. Always conduct your own research and consult with a professional before making any financial decisions. Please note that our Terms and Conditions, Privacy Policy, and Disclaimers have been updated.