
Market
What’s Next for Crypto Prices?

Things are getting quiet — really quiet — raising concerns about whether this is still a bull market for the highly volatile crypto ecosystem. While this answer lies in Bitcoin (BTC) performance and altcoin prices, historical data and recent developments can predict the point at which the cycle is.
In this analysis, BeInCrypto examines crucial on-chain metrics that suggest the bull market started about two years ago and could have reached 50% completion.
History Shows the Cycle Is Way Beyond Bears
The year 2022 was a particularly difficult time for the crypto market, which had previously thrived in 2021. The industry saw major firms like FTX, Celsius, and Three Arrows Capital (3AC) collapse, triggering widespread bankruptcies and causing significant declines in cryptocurrency prices.
By November 21, 2022, Bitcoin (BTC) had plunged to $15,409, Ethereum (ETH) was trading at $1,065, BNB at $248.60, and Solana (SOL) had dropped to $7.70. These levels were the lowest these assets had seen in nearly two years.
Given this downturn, it seems that November 2022 marked the bottom of the bear market. The strong price recovery in early 2023 supports the idea that January was the start of a new bull cycle. Historically, crypto market cycles span roughly three years (1,047 to 1,278 days). Based on this timeframe, the current cycle is around 640 days in, indicating that the bull market is approximately halfway through.
Notably, the Bitcoin halving, which typically drives massive price increases, occurred earlier this year. Interestingly, Bitcoin reached a new all-time high even before the halving, driven largely by the approval of spot ETFs. Despite the recent corrections and periods of consolidation, on-chain metrics suggest that BTC has not yet reached the peak of this cycle. This leaves room for potential further growth as the bull market progresses.
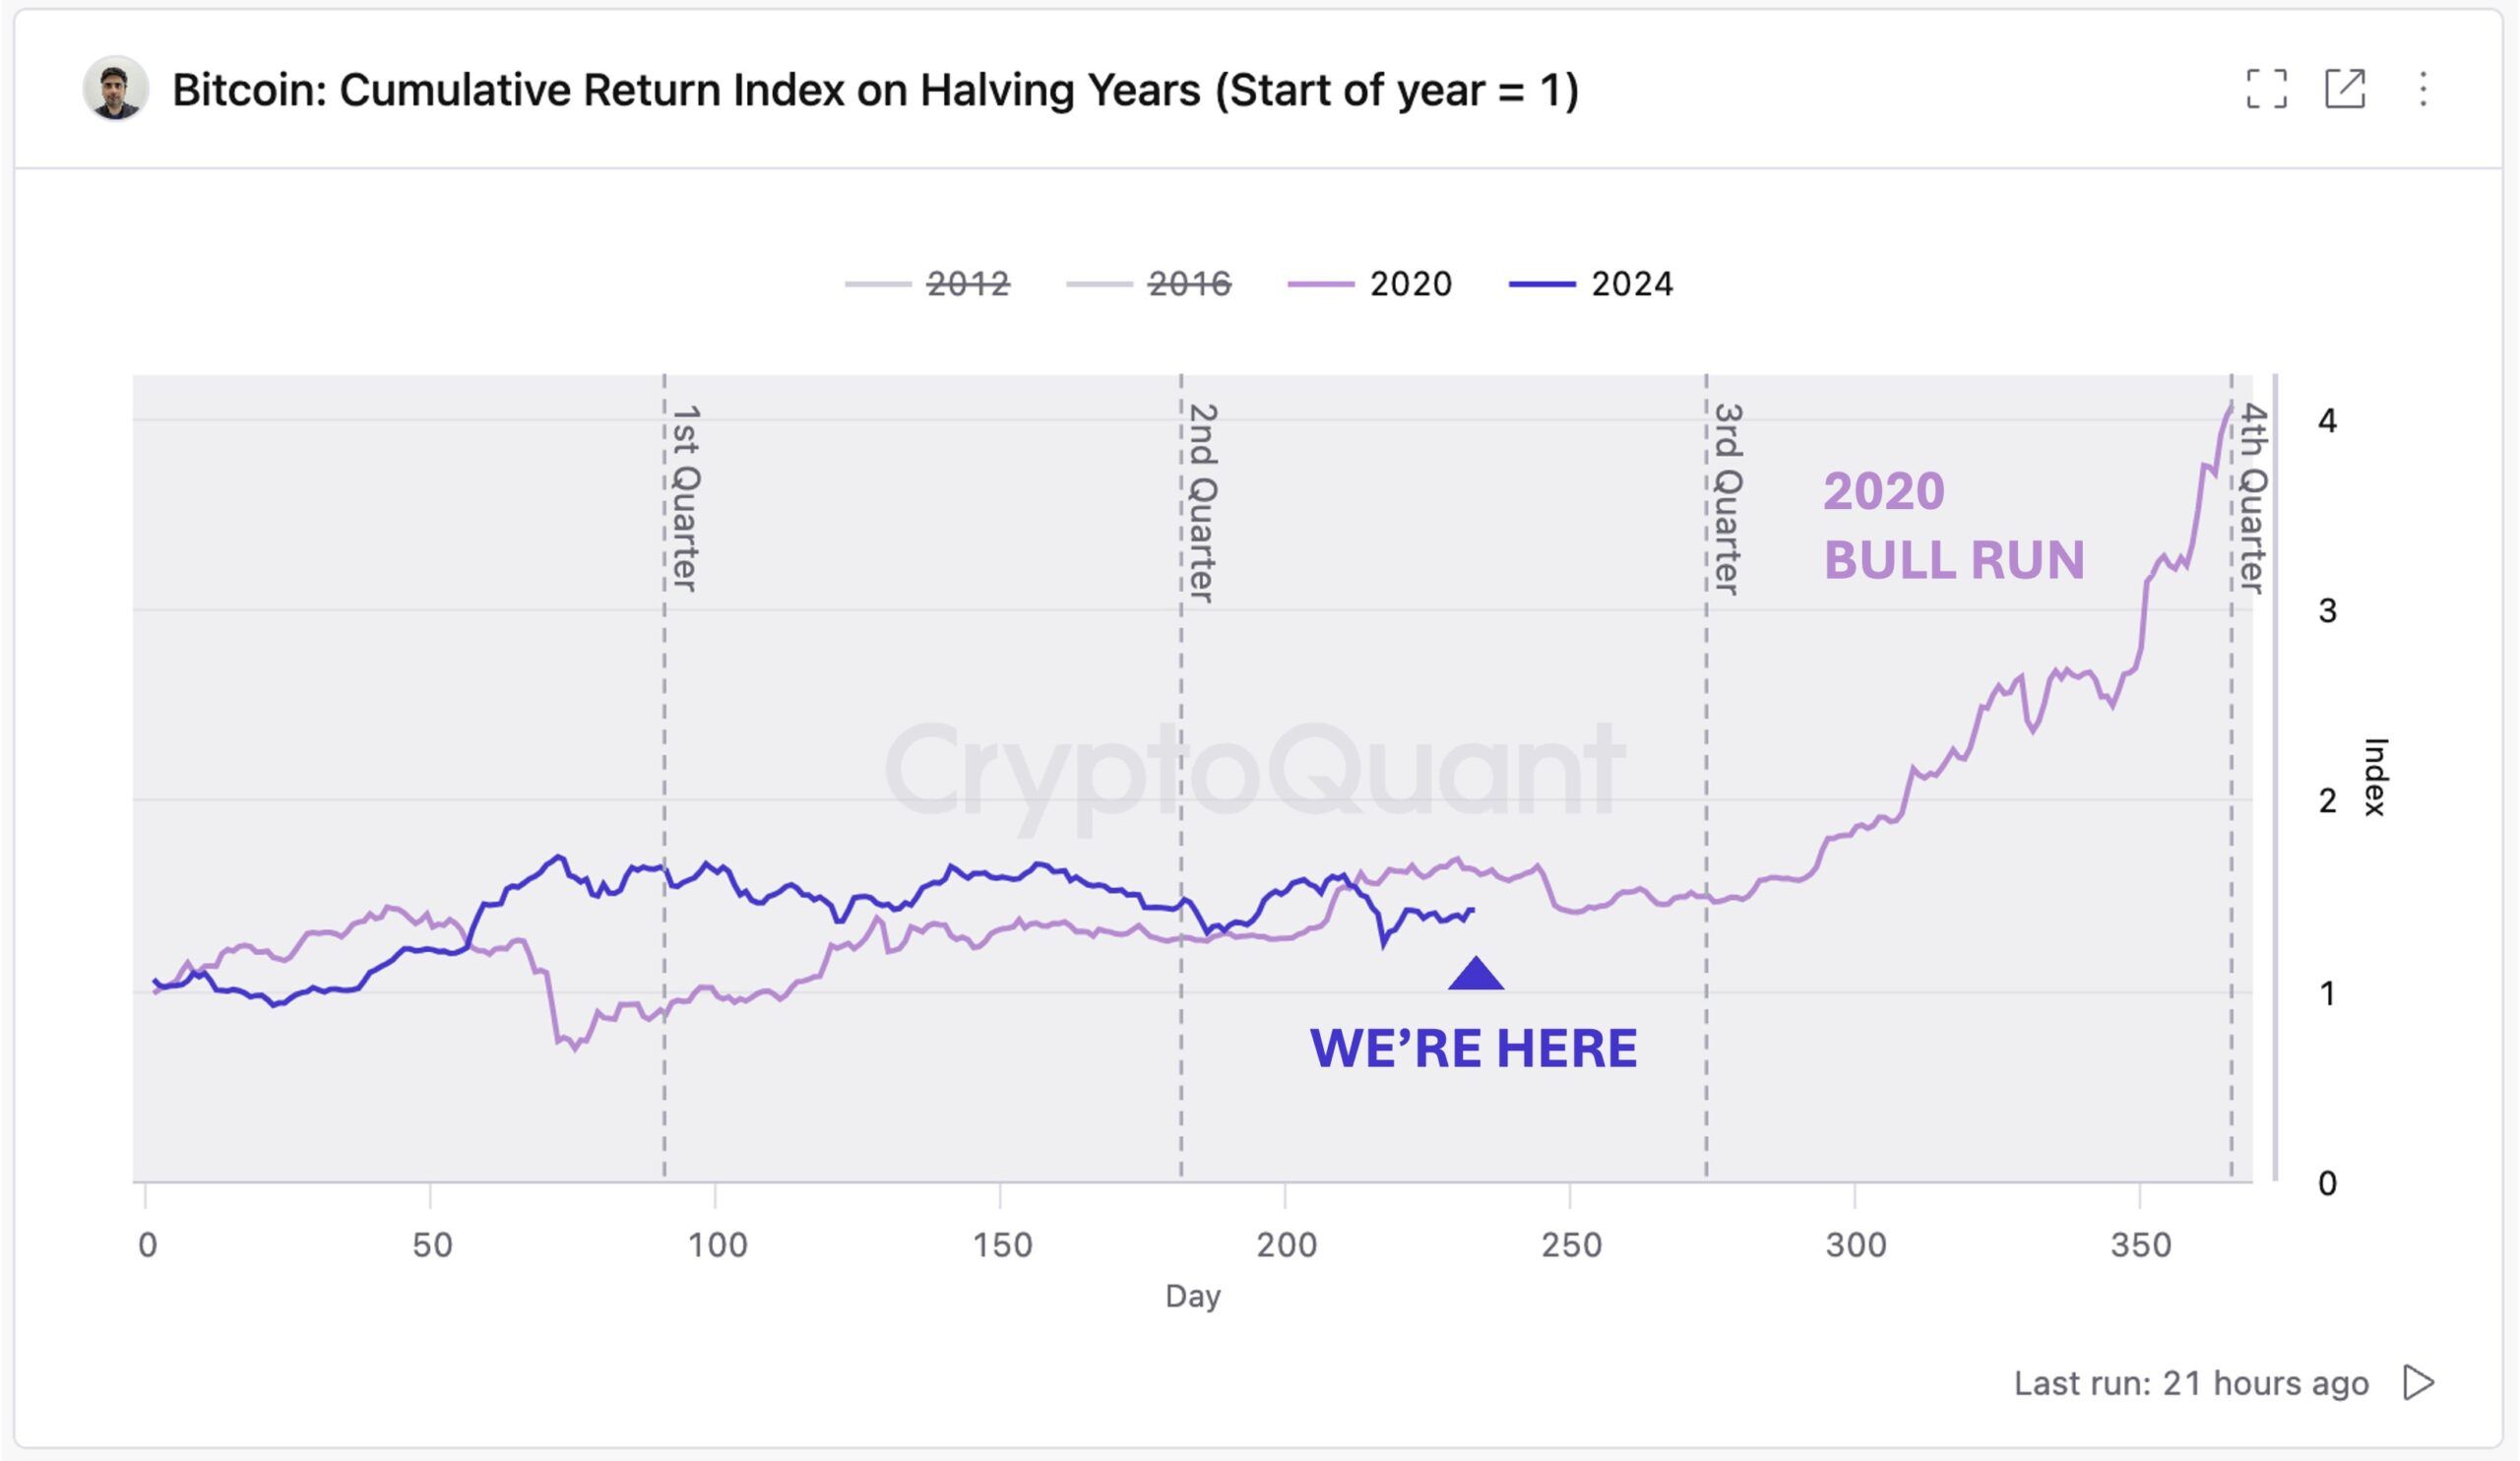
As seen above, the post-halving rally began in the fourth quarter (Q4) of each halving year. Thus, if we go by that recurrence, then a substantial upswing could start around October. Interestingly, CryptoQuant’s CEO, Ki Young Ju, also seems to agree with the sentiment.
“In the last Bitcoin halving cycle, the bull rally began in Q4. Whales won’t let Q4 be boring with a flat YoY performance,” Young Ju highlighted on X.
Bitcoin, ETH, and Altcoin Prices Still Have Room to Grow
Historically, Bitcoin’s price has at least doubled during each halving year. In 2012, BTC’s price surged by 2.52x, followed by a 2.26x increase in 2016, and a 4.05x jump in 2020. At the start of 2024, Bitcoin was trading around $42,208. Even after reaching $73,750 in March, the data suggests the bull cycle is not yet over.
To match past halving performances, Bitcoin’s price would need to rise further, targeting between $80,000 and $85,000 before this cycle peaks. The historical trends indicate room for more growth in 2024.
Now, to other things — starting with ETH. During the 2021 bull run, the second most valuable cryptocurrency gave BTC a run for its money, outperforming it for an extended period.
Despite the spot Ethereum ETF approval, ETH hasn’t mirrored its performance from three years ago. On June 20, Ethereum’s dominance was 18.80%. As of now, it has dropped to 15%, signaling that the altcoin has yet to replicate its impressive 2021 run.
Read more: Bitcoin Halving History: Everything You Need To Know
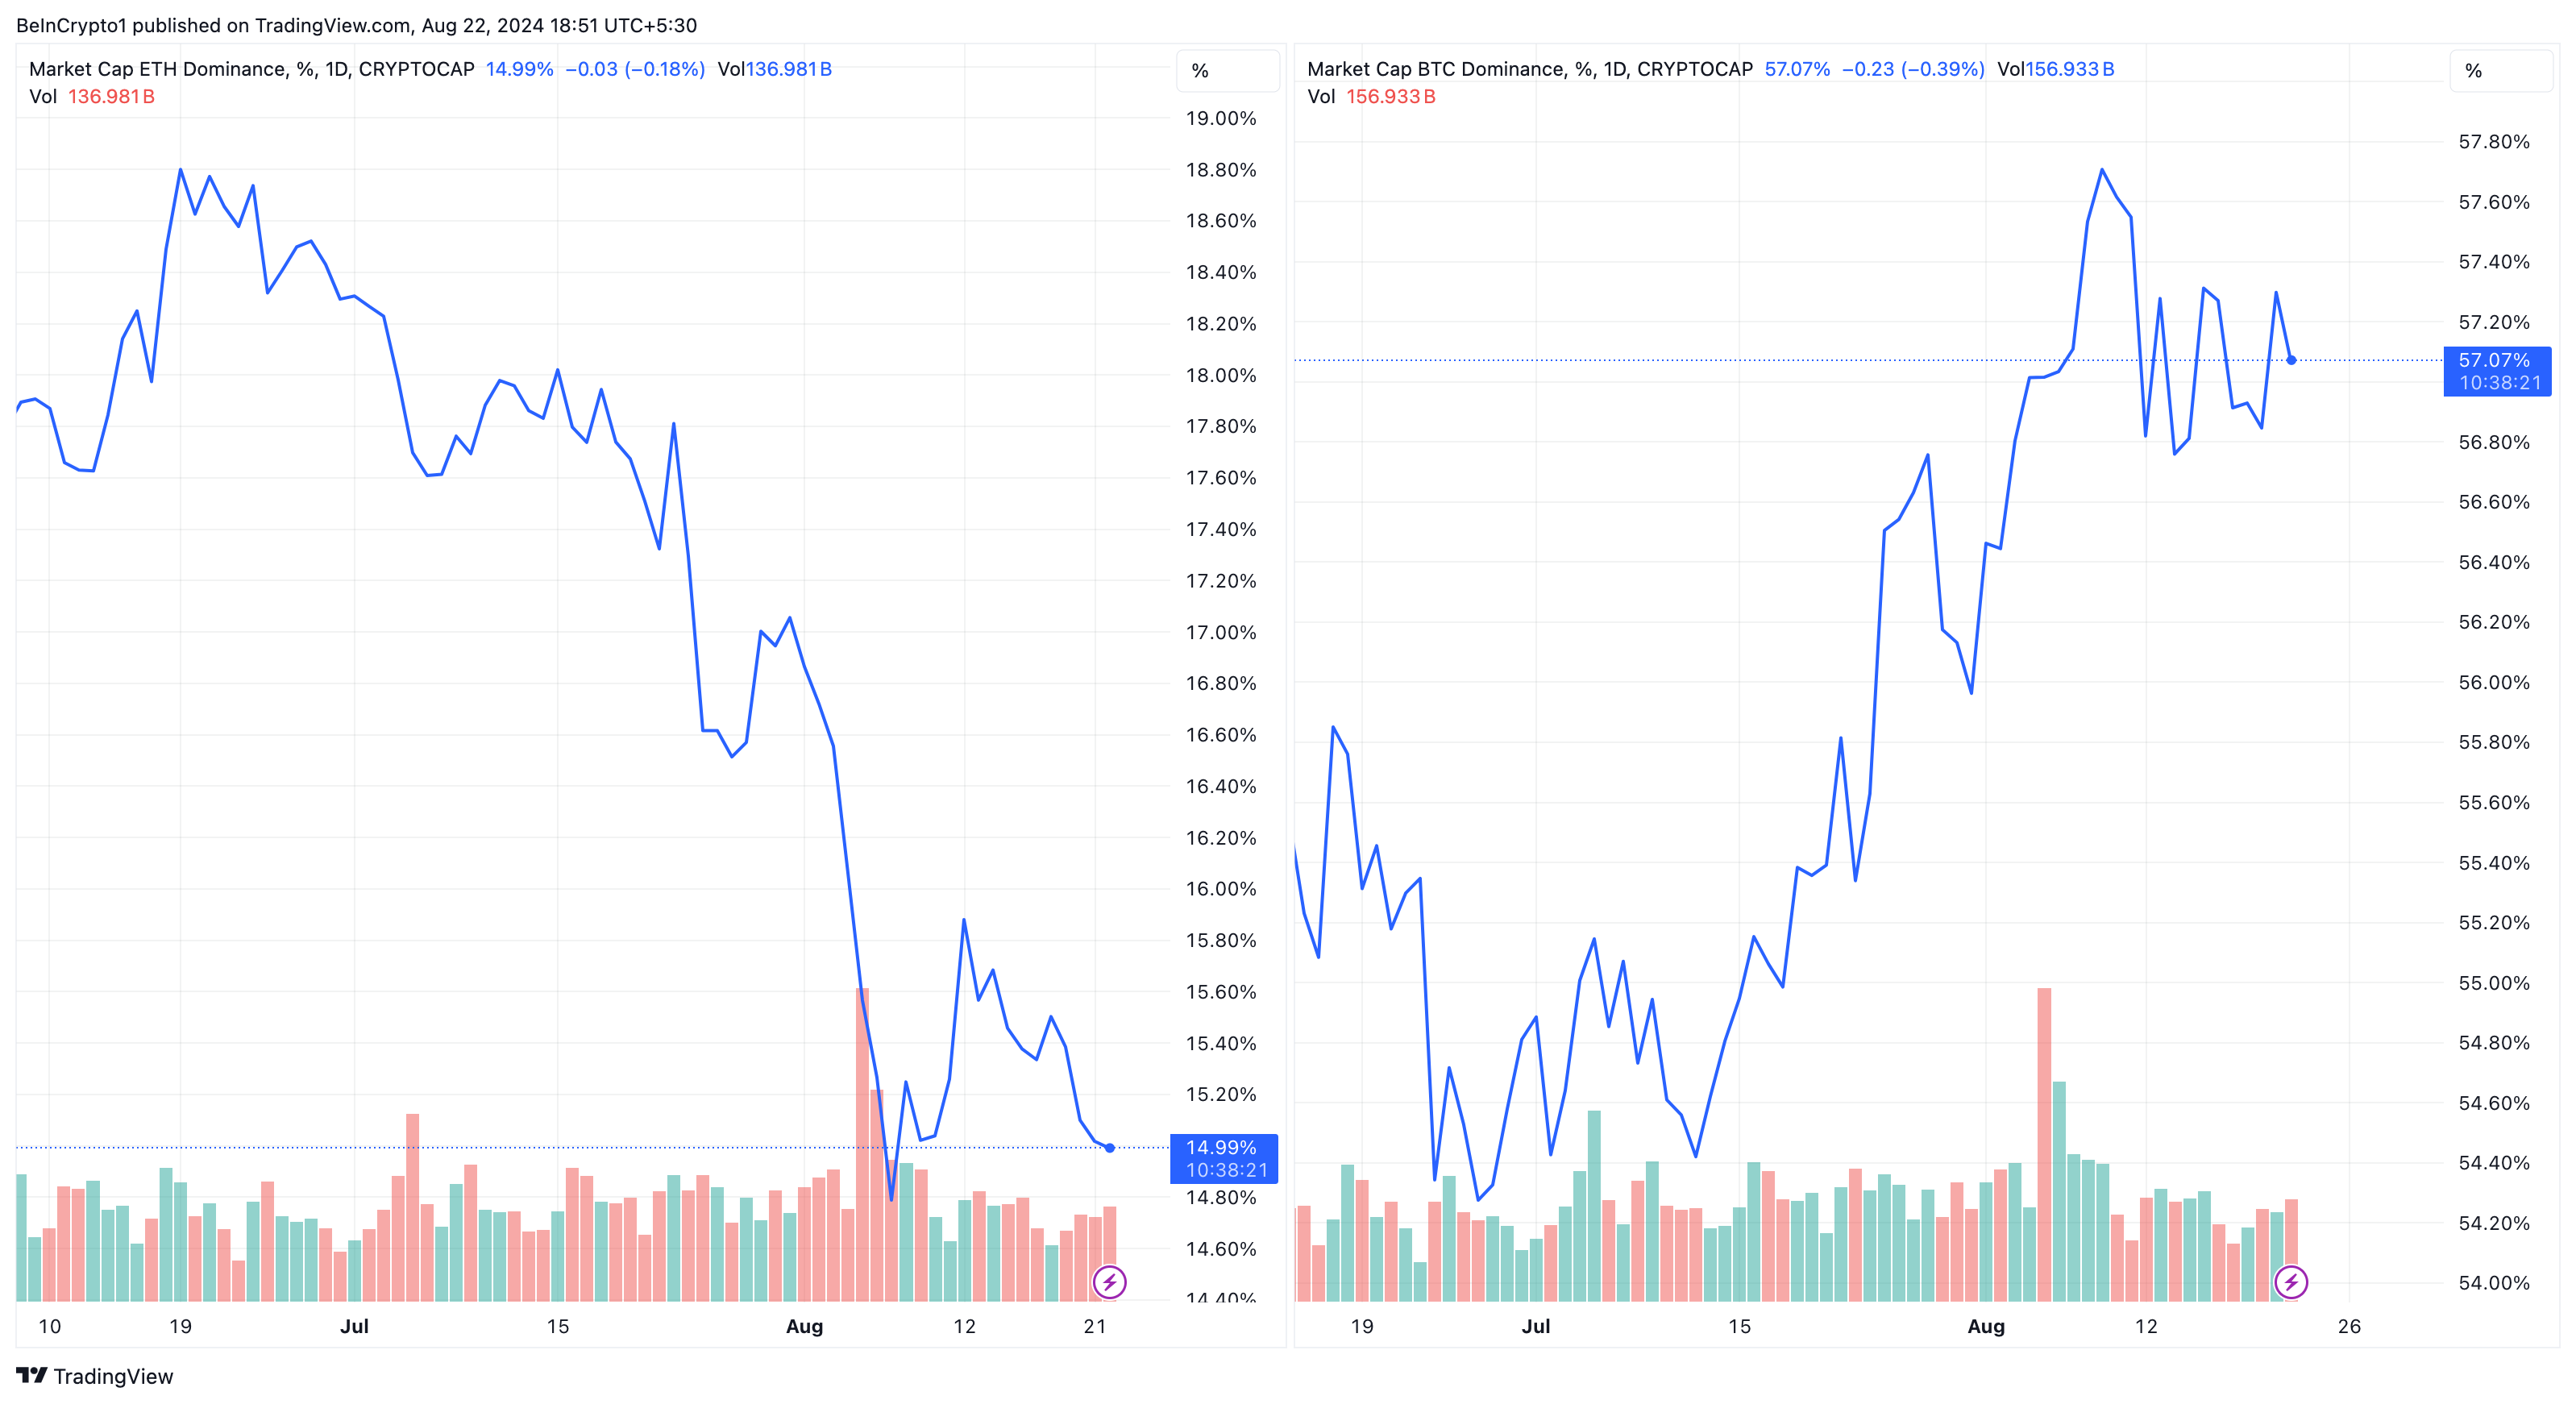
Bitcoin dominance, on the other hand, is over 57%. Furthermore, ETH’s underwhelming performance has also been attributed to the delay in this cycle’s altcoin season.
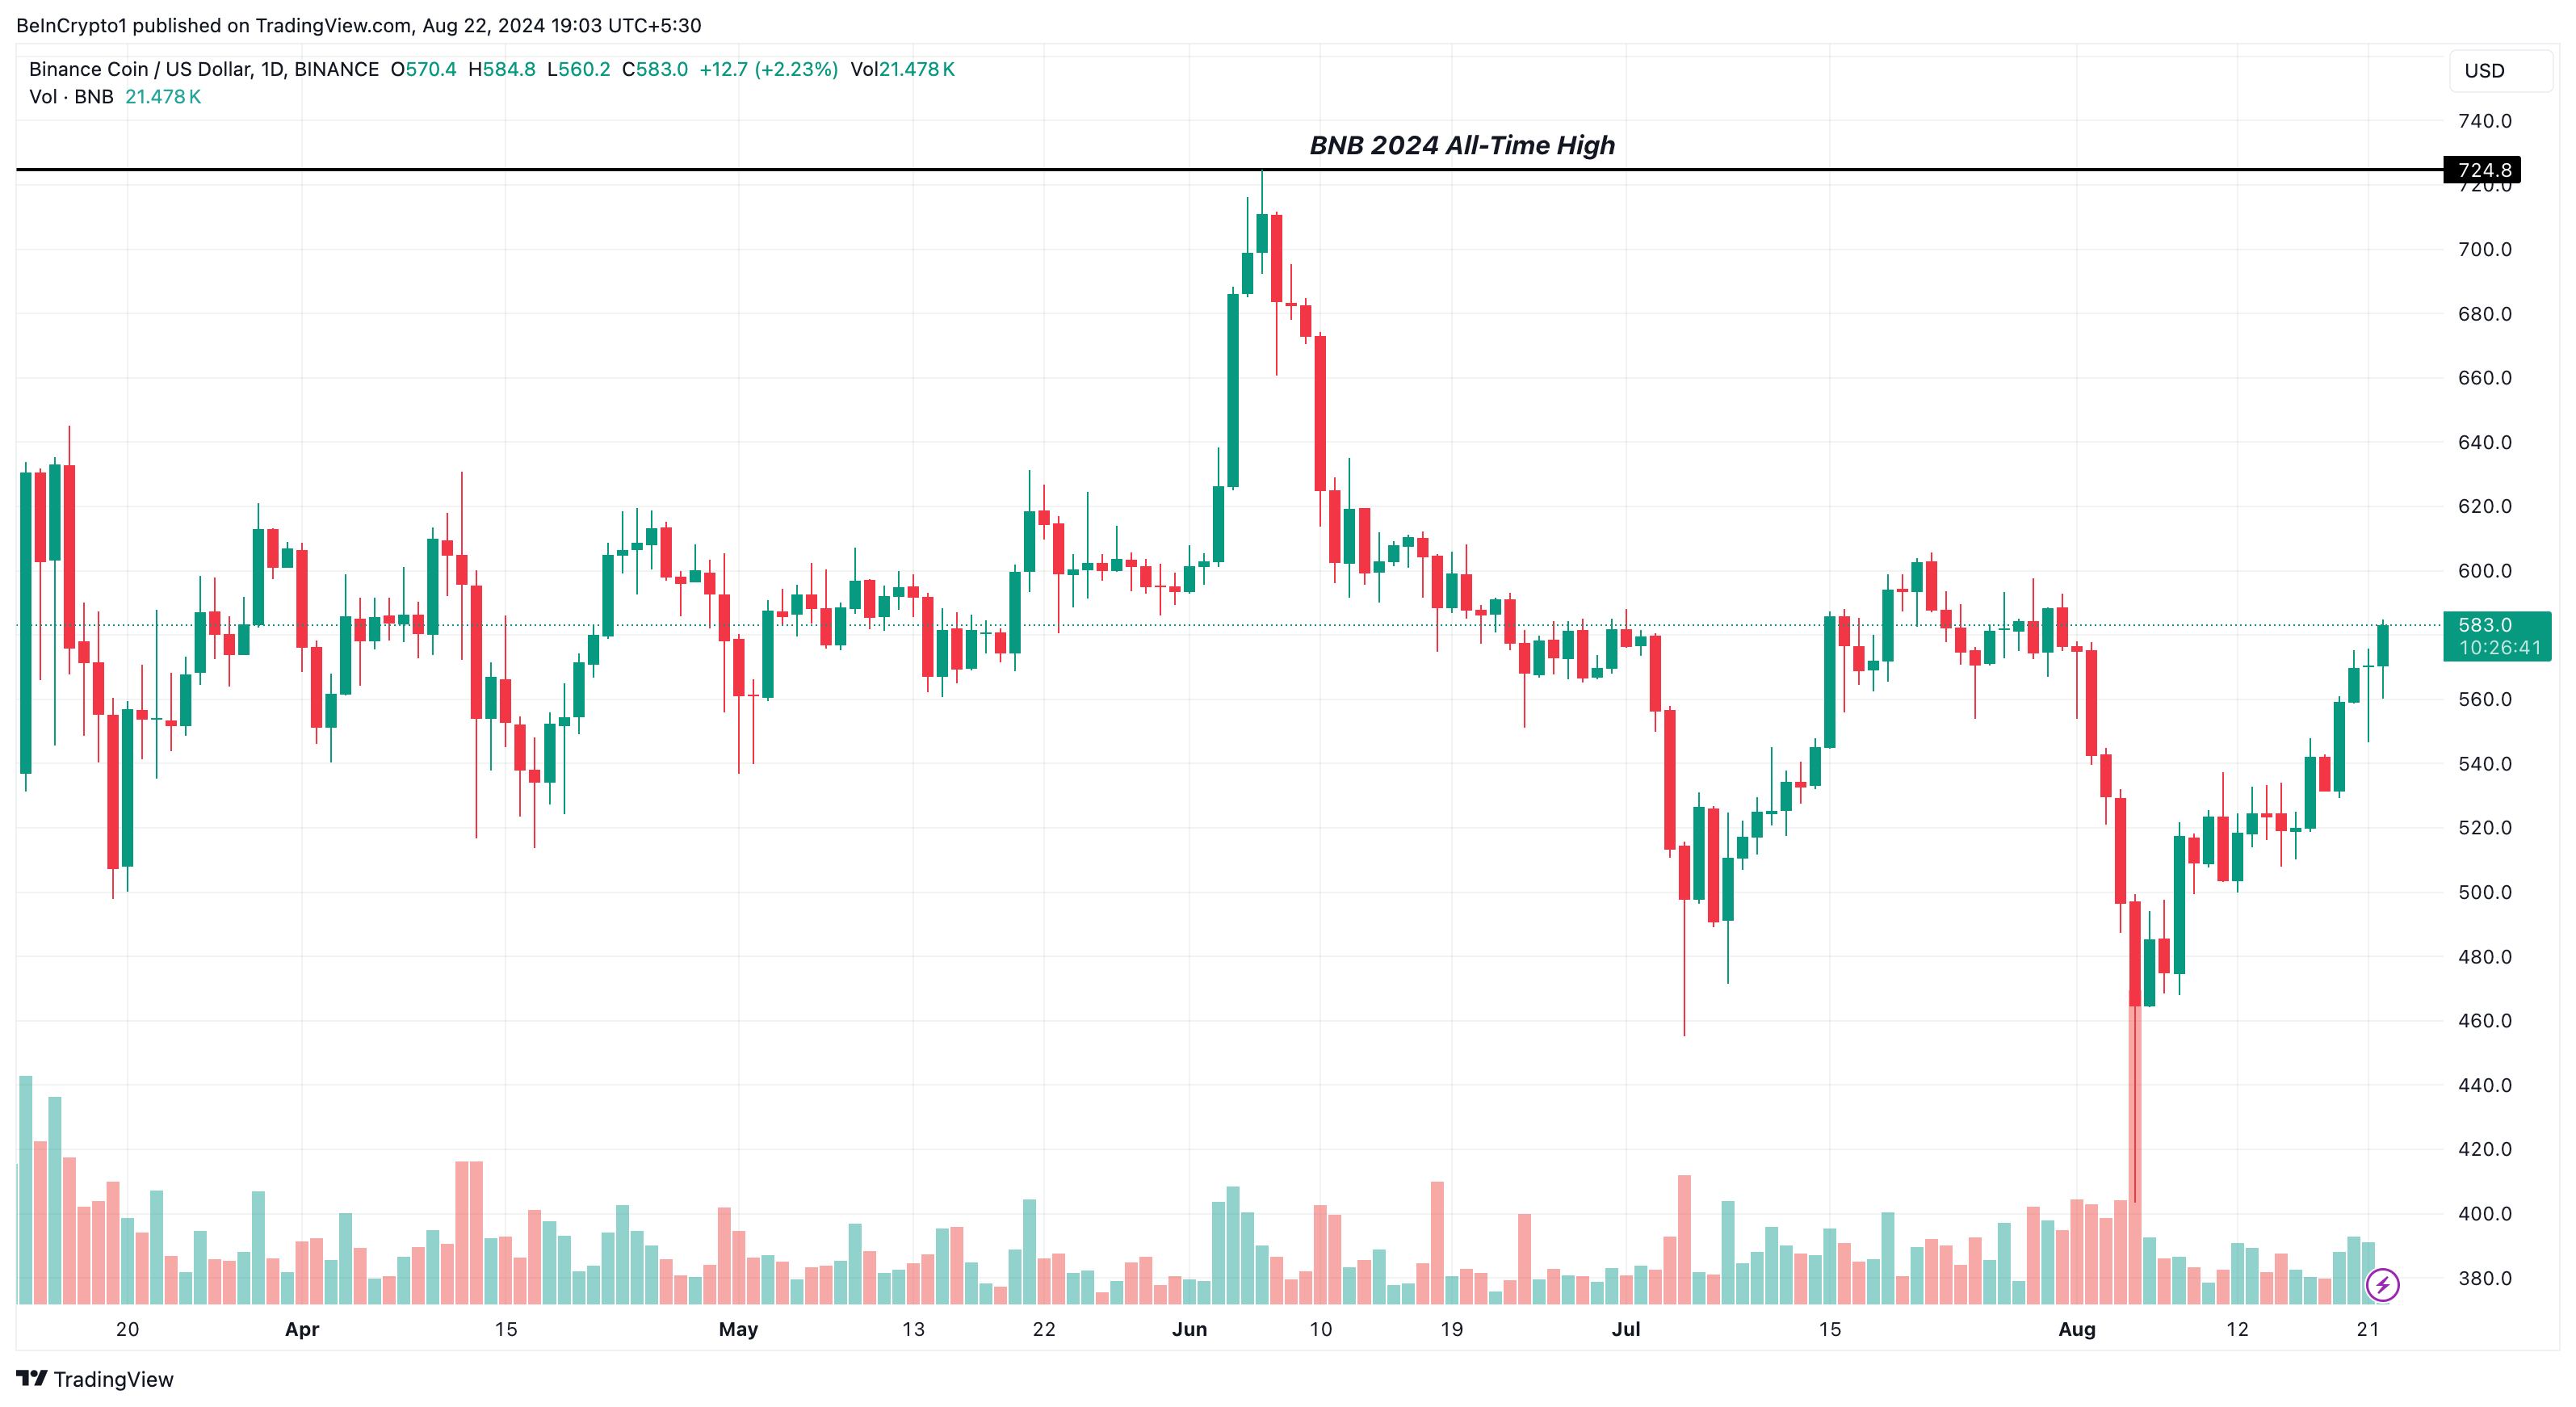
It is worth noting that the cryptocurrency’s rally was one of the major factors that drove many other altcoins to incredible peaks last time. But recently, BNB appears to be the only top altcoin from the last cycle that had surpassed its previous all-time high.
Meme Coins, Celebs Already Tasted the Bull Market
While altcoins continue to underperform, two notable events suggest that this bull market might be halfway through. The first one is the incredible returns from meme coins. Last time, several meme coins on Ethereum and the Binance Smart Chain produced many out-of-the-blue millionaires.
This time, the blockchains offering such seem to be Solana and, most recently, Justin Sun-led Tron. Second on the list is the involvement of celebrities. In 2021, stars like Logan Paul, Paris Hilton, and Snoop Dogg, among others, bought into the NFT hype.
Meanwhile, the NFT craze appears to be over, but celebrities have also been involved with the market. People like Andrew Tate and Iggy Azalea have launched DADDY and MOTHER meme coins, respectively.
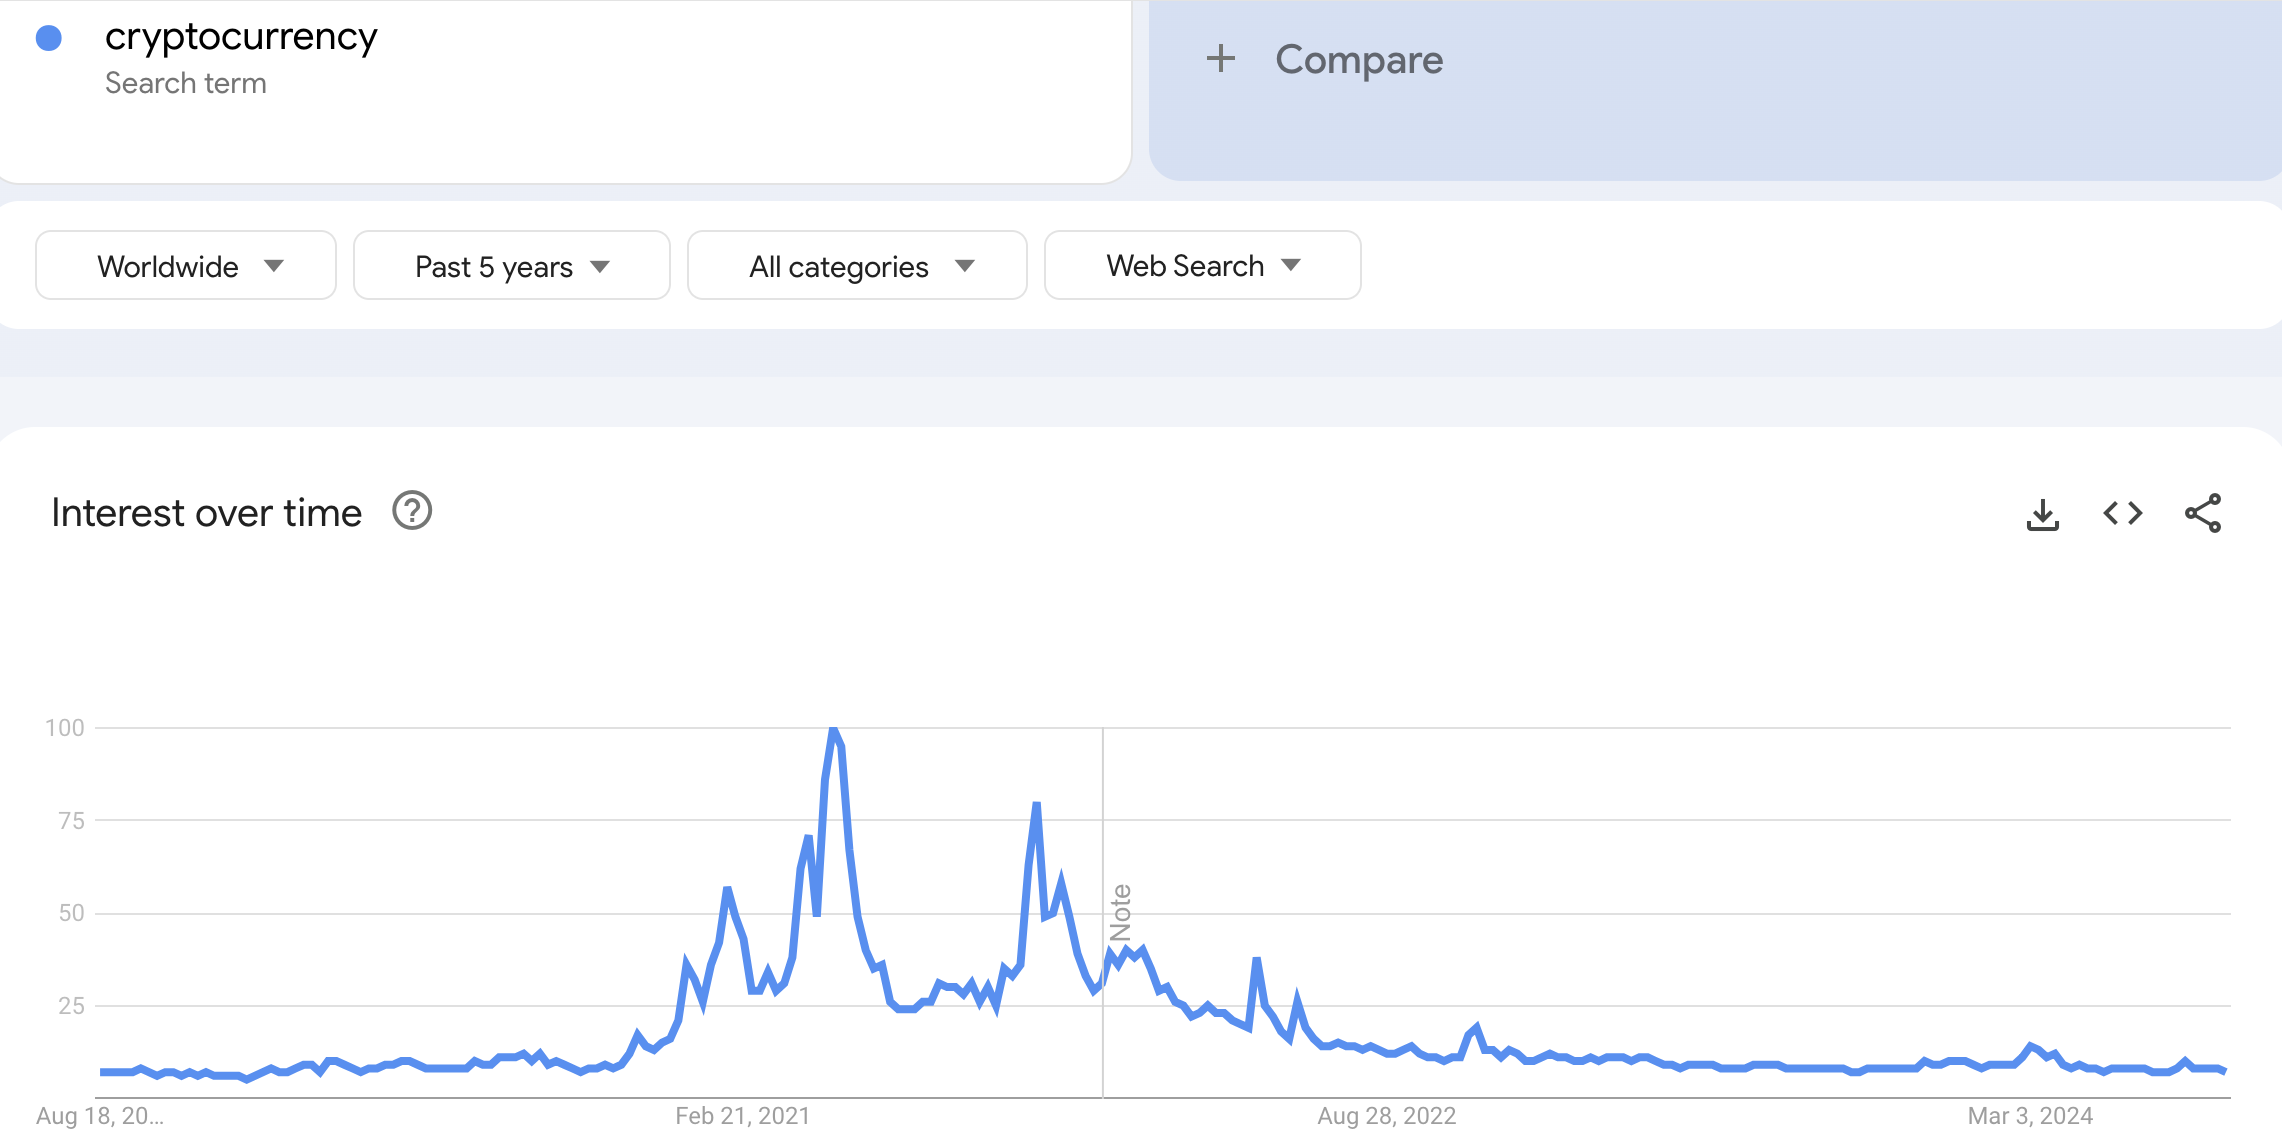
Another metric to consider for gauging the crypto bull market is retail investor interest. Whenever retail investor interest declines, it suggests the bull market is ongoing but hasn’t peaked.
Google Trends data shows searches for “cryptocurrency” hit their highest level in 2021, scoring a perfect 100. However, searches have been consistently lower this year, signaling reduced retail activity.
A bull market typically sees a surge in retail investors as they drive the demand. The current dip in interest suggests that this cycle hasn’t reached its peak yet. The lack of widespread retail FOMO points to more potential upside as the cycle matures.
Long-Term Data Shows the Uptrend Might Kick Off Again
Additionally, Glassnode-provided Long-Term Holder Realized Profit/Loss Ratio comes into play. As the name suggests, this metric tracks the behavior of long-term holders, telling if they are booking profits or enduring losses.
As of this writing, this metric has declined from its peak in March, indicating that holders have reduced profit-taking activity. This fall is similar to the 2021 cycle when Bitcoin’s price went down before restarting another uptrend.
Read more: 7 Must-Have Cryptocurrencies for Your Portfolio Before the Next Bull Run
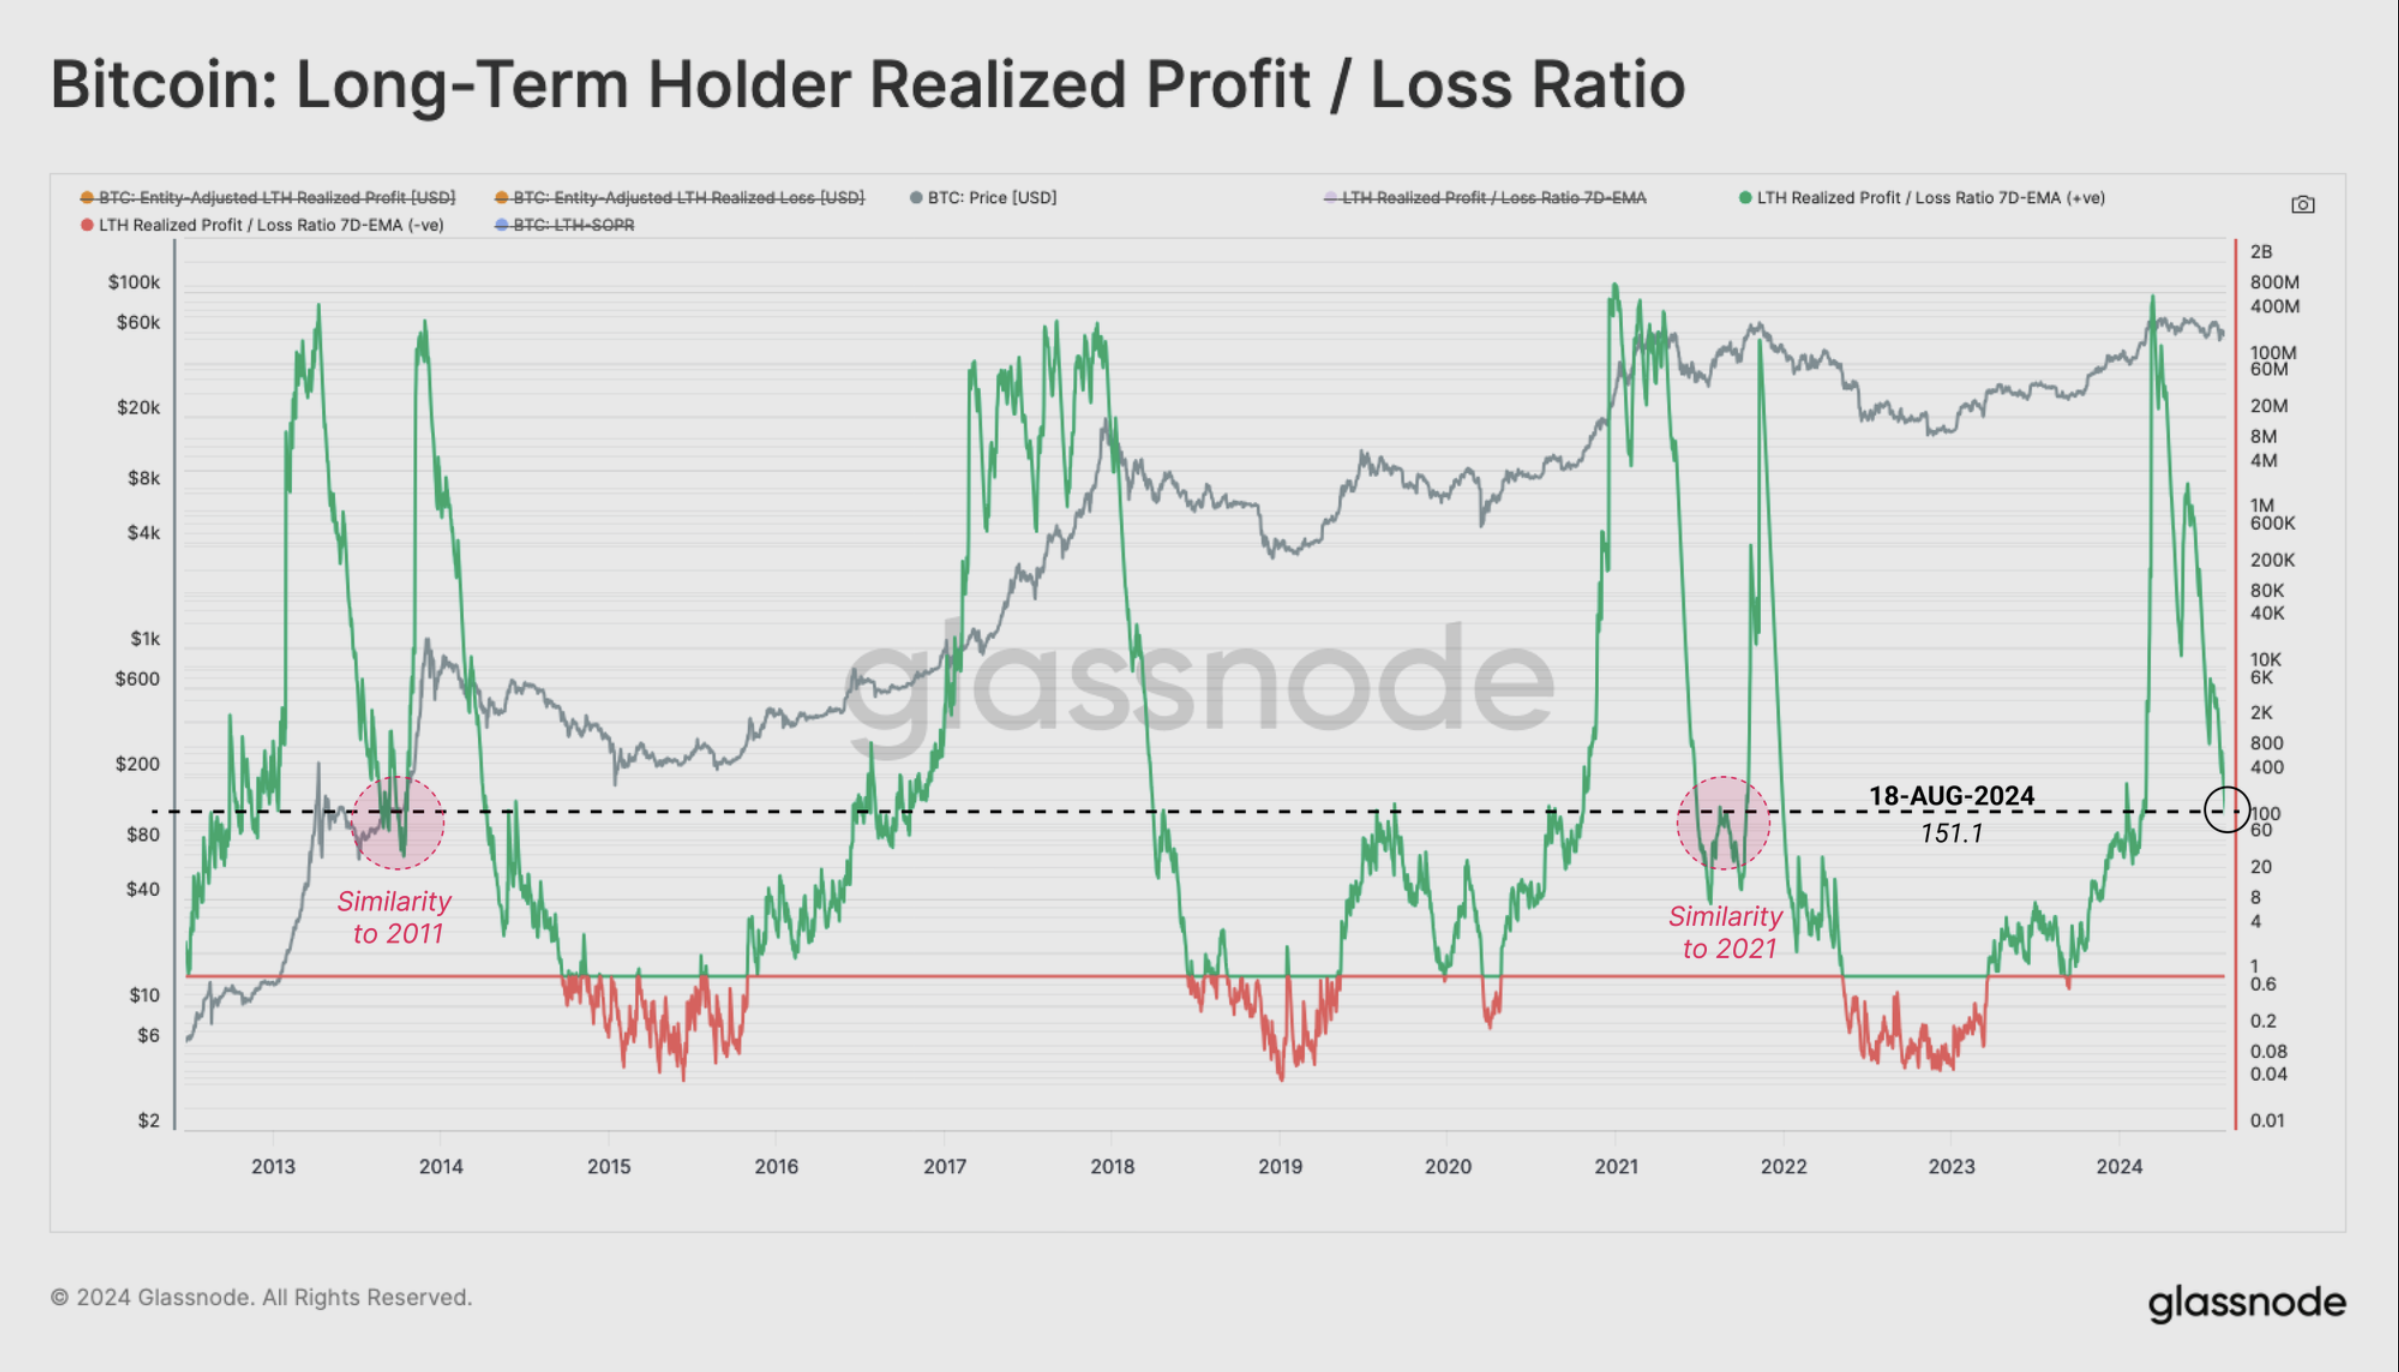
Therefore, if past performances impact future trends, then BTC, as well as other cryptos, might reach new highs. The on-chain analytic platform also agrees in its report dated August 20.
“Notably, during the March 2024 ATH, this metric reached a similar altitude to prior market tops. In both the 2013 and 2021 cycles, the metric declined to similar levels prior to resuming an uptrend in price,” Glassnode stated.
In summary, while some investors remain skeptical about the current market conditions, several indicators point to this still being a bull market despite recent volatility. The analysis suggests that prices may continue to rise, pushing Bitcoin, Ethereum, and other altcoins to new highs and fueling further momentum in this cycle.
However, caution is still advised. Heightened volatility and periodic drawdowns can lead to sudden price shifts. If realized losses persist and dominate the market, the current cycle could transition into a bear phase.
Disclaimer
In line with the Trust Project guidelines, this price analysis article is for informational purposes only and should not be considered financial or investment advice. BeInCrypto is committed to accurate, unbiased reporting, but market conditions are subject to change without notice. Always conduct your own research and consult with a professional before making any financial decisions. Please note that our Terms and Conditions, Privacy Policy, and Disclaimers have been updated.


Onyxcoin (XCN) is down nearly 10% over the past seven days, cooling off after a sharp 200% rally between April 9 and April 11. Momentum indicators suggest that the bullish trend may be losing strength, with both the RSI and ADX showing signs of fading conviction.
While XCN’s EMA lines remain in a bullish formation, early signs of a potential reversal are emerging as short-term averages begin to slope downward. The coming days will be key in determining whether Onyxcoin can stabilize and resume its climb—or if a deeper correction is on the horizon.
Onyxcoin Shows Early Signs of Stabilization, but Momentum Remains Uncertain
Onyxcoin’s Relative Strength Index (RSI) is currently sitting at 43. Readings above 70 typically indicate that an asset is overbought and could be due for a pullback, while readings below 30 suggest it may be oversold and poised for a potential rebound.
Levels between 30 and 70 are considered neutral, often reflecting consolidation or indecision in the market.

XCN’s RSI signals a neutral state but shows signs of gradual recovery. While not yet a clear bullish signal, yesterday’s upward move suggests that bearish momentum may be easing.
However, the fact that RSI failed to hit above 50 reflects lingering uncertainty and a lack of sustained buying pressure.
For now, XCN appears to be in a wait-and-see phase, where a continued climb in RSI could signal a shift toward renewed upside, but any further weakness might keep the price trapped in a consolidation range.
XCN Uptrend Weakens as ADX Signals Fading Momentum
Onyxcoin’s Average Directional Index (ADX) has declined to 11, down from 13.92 yesterday and 15.26 two days ago. This decline reflects a consistent weakening in trend strength.
The ADX is a key component of the Directional Movement Index (DMI) and is used to measure the strength—not the direction—of a trend on a scale from 0 to 100.
Values below 20 typically suggest that the market is trending weakly or not at all, while readings above 25 confirm a strong and established trend.

With the ADX now at 11, Onyxcoin’s trend is losing momentum, even though it technically remains in an uptrend. This low reading suggests the current bullish phase is fragile and may lack the conviction needed for sustained upward movement.
Combined with EMA lines that are beginning to flatten, the weakening ADX adds weight to the possibility that the trend could soon shift or stall.
If no surge in buying pressure emerges to reinforce the uptrend, XCN may enter a period of sideways movement or even a reversal in the short term.
Onyxcoin at a Crossroads as EMA Lines Hint at Possible Trend Reversal
XCN EMA lines remain bullish for now, with short-term averages still positioned above long-term ones.
However, the short-term EMAs have started to slope downward, raising the possibility of a looming death cross—a bearish crossover in which the short-term average falls below the long-term average.
If this crossover materializes, it would signal a shift in trend direction and could trigger a deeper pullback, after a 200% rally between April 9 and April 11, making it one of the best-performing altcoins of the previous weeks.
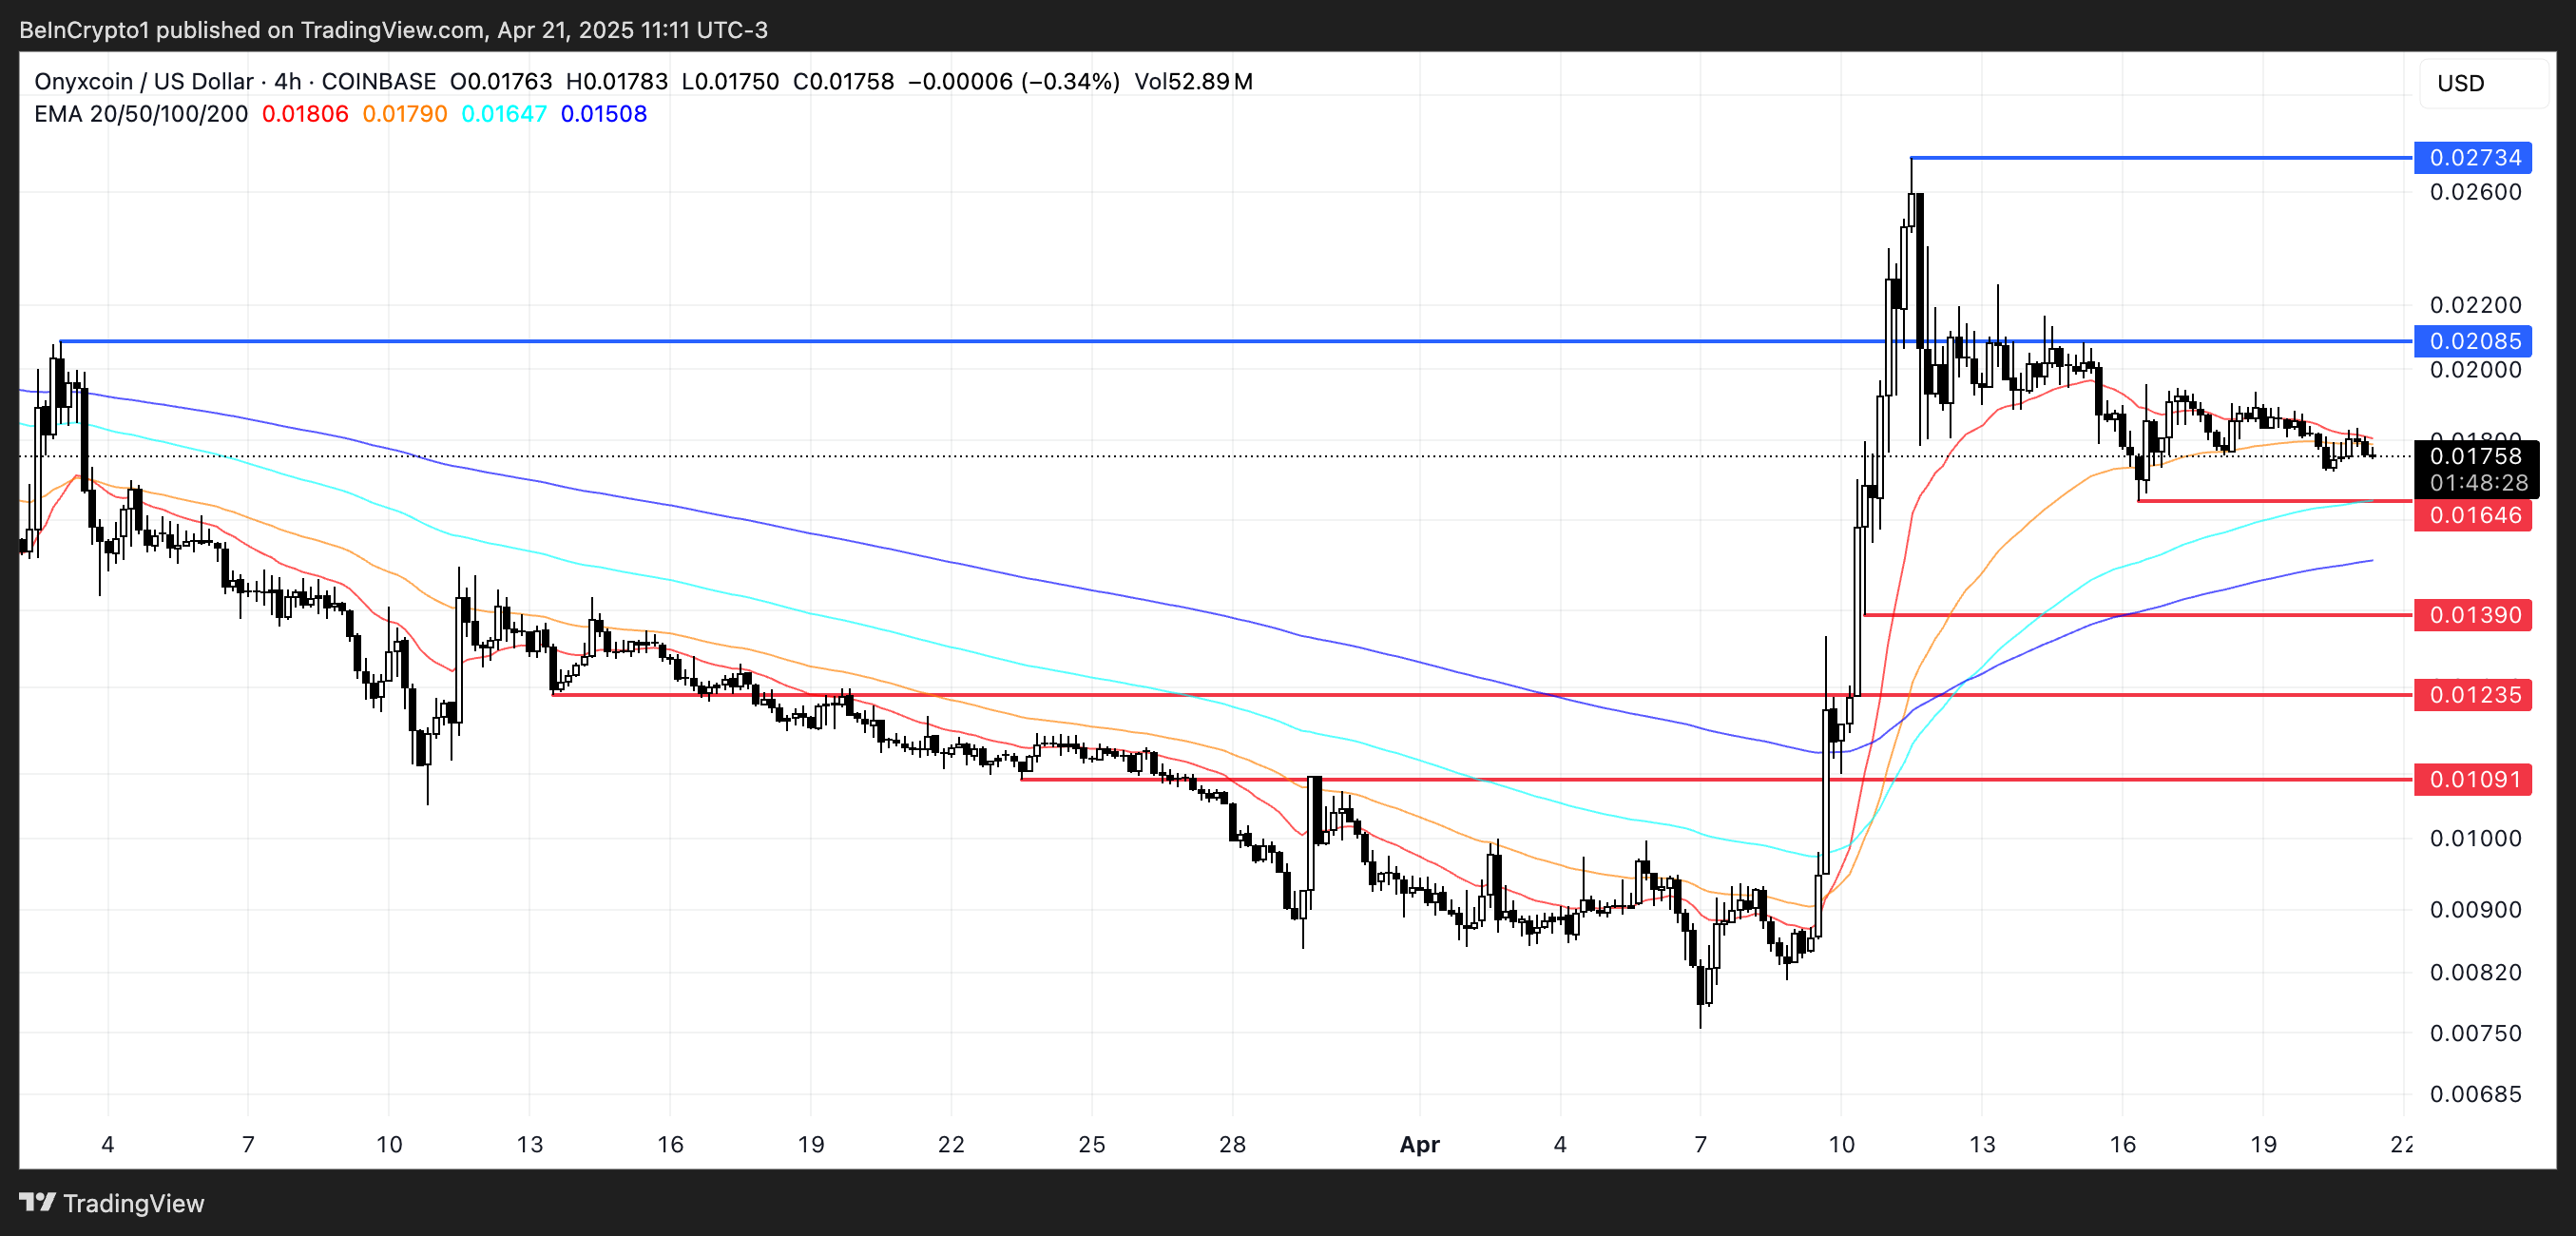
Key support levels to watch are $0.016, followed by $0.0139 and $0.0123. If bearish momentum accelerates, XCN could drop as low as $0.0109, marking a potential 38% correction from current levels.
On the flip side, if bulls manage to regain control and reinforce the existing uptrend, XCN could challenge the resistance at $0.020.
A breakout above that level would open the door for a potential rally toward $0.027, representing a 55% upside.
Disclaimer
In line with the Trust Project guidelines, this price analysis article is for informational purposes only and should not be considered financial or investment advice. BeInCrypto is committed to accurate, unbiased reporting, but market conditions are subject to change without notice. Always conduct your own research and consult with a professional before making any financial decisions. Please note that our Terms and Conditions, Privacy Policy, and Disclaimers have been updated.

The crypto market has shown consistent growth over the past few days, helping altcoins alongside Bitcoin to recover. However, relying solely on broader market cues or momentum will not sustain price growth.
BeInCrypto has analyzed three altcoins for investors to watch in April, as important developments are set to unfold this week.
Tutorial (TUT)
TUT price has remained stable throughout most of the month, currently hovering below the $0.027 resistance level. Successfully breaching this barrier is crucial for recovering the 53% losses incurred in March. A price rise above $0.027 could signal a positive trend and further upward movement in the coming weeks.
If this trend continues, TUT could push toward the next resistance level of $0.039, indicating strong momentum.
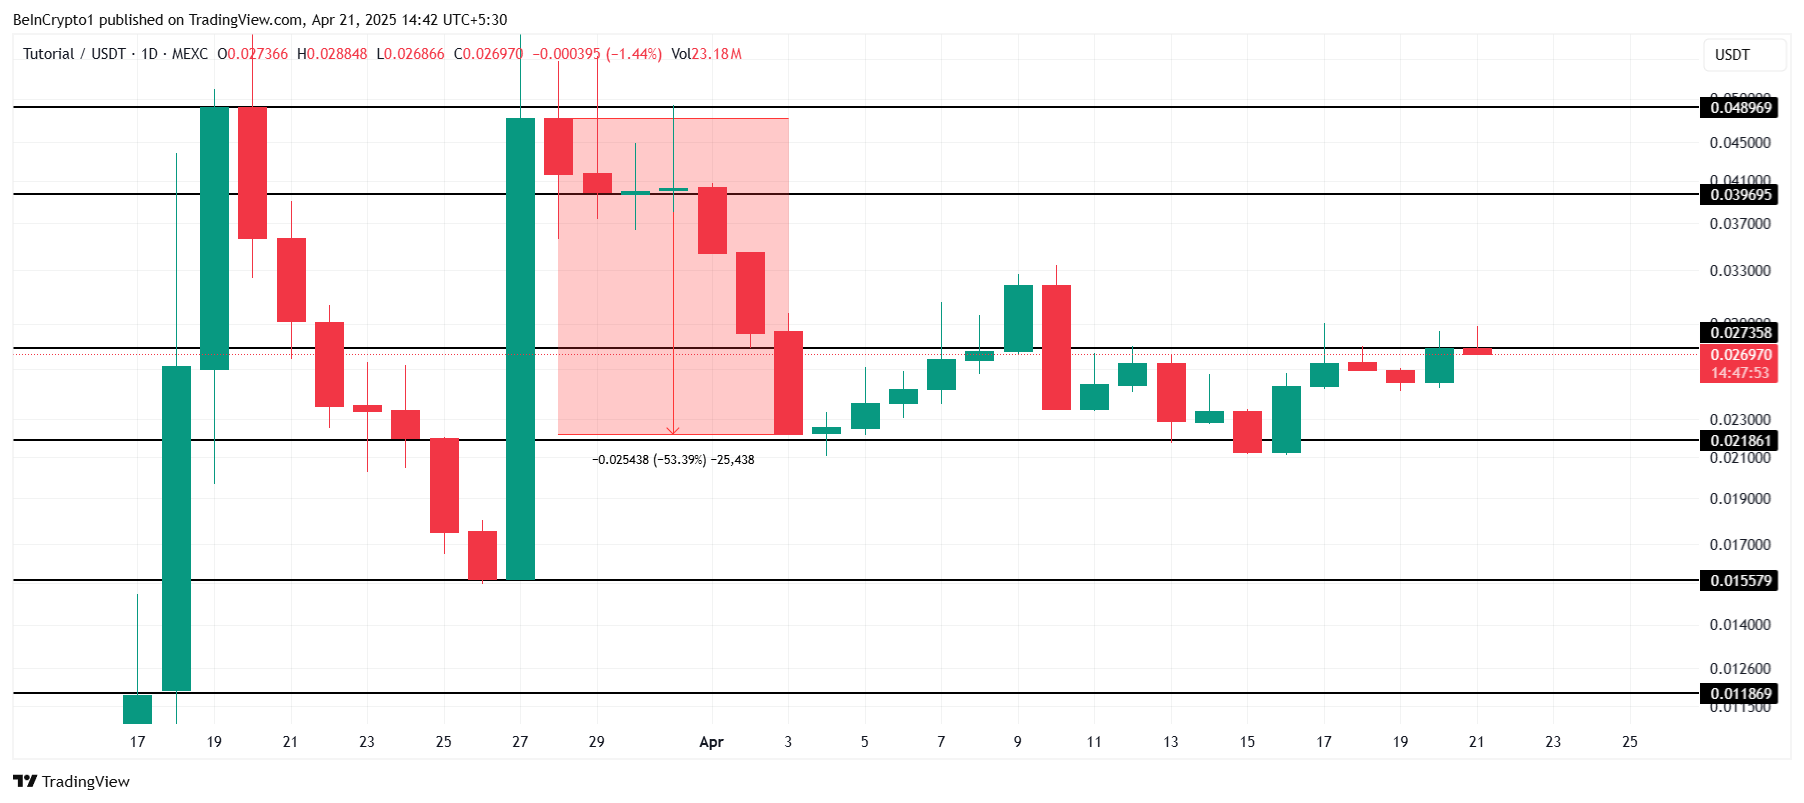
However, if TUT fails to break above the $0.027 resistance, the price could decline below $0.021. Such a drop would likely invalidate the bullish outlook and lead to further losses. In that scenario, the altcoin’s price might fall to $0.015, a significant setback for the token’s recovery.
Injective (INJ)
Injective’s price has surged by 17% in recent days, fueled by anticipation surrounding the upcoming Lyota Mainnet Upgrade. Set to go live on April 22, the upgrade is expected to enhance Injective’s infrastructure, performance, and transaction speeds. This has sparked optimism, driving the price higher in the short term.
Currently trading at $8.97, Injective is nearing the $9.11 resistance level. If it successfully breaches this barrier, the price could move beyond $10.00, potentially reaching $10.35. The positive sentiment surrounding the Lyota Mainnet Upgrade is likely to continue driving the token’s growth if it can surpass these levels.
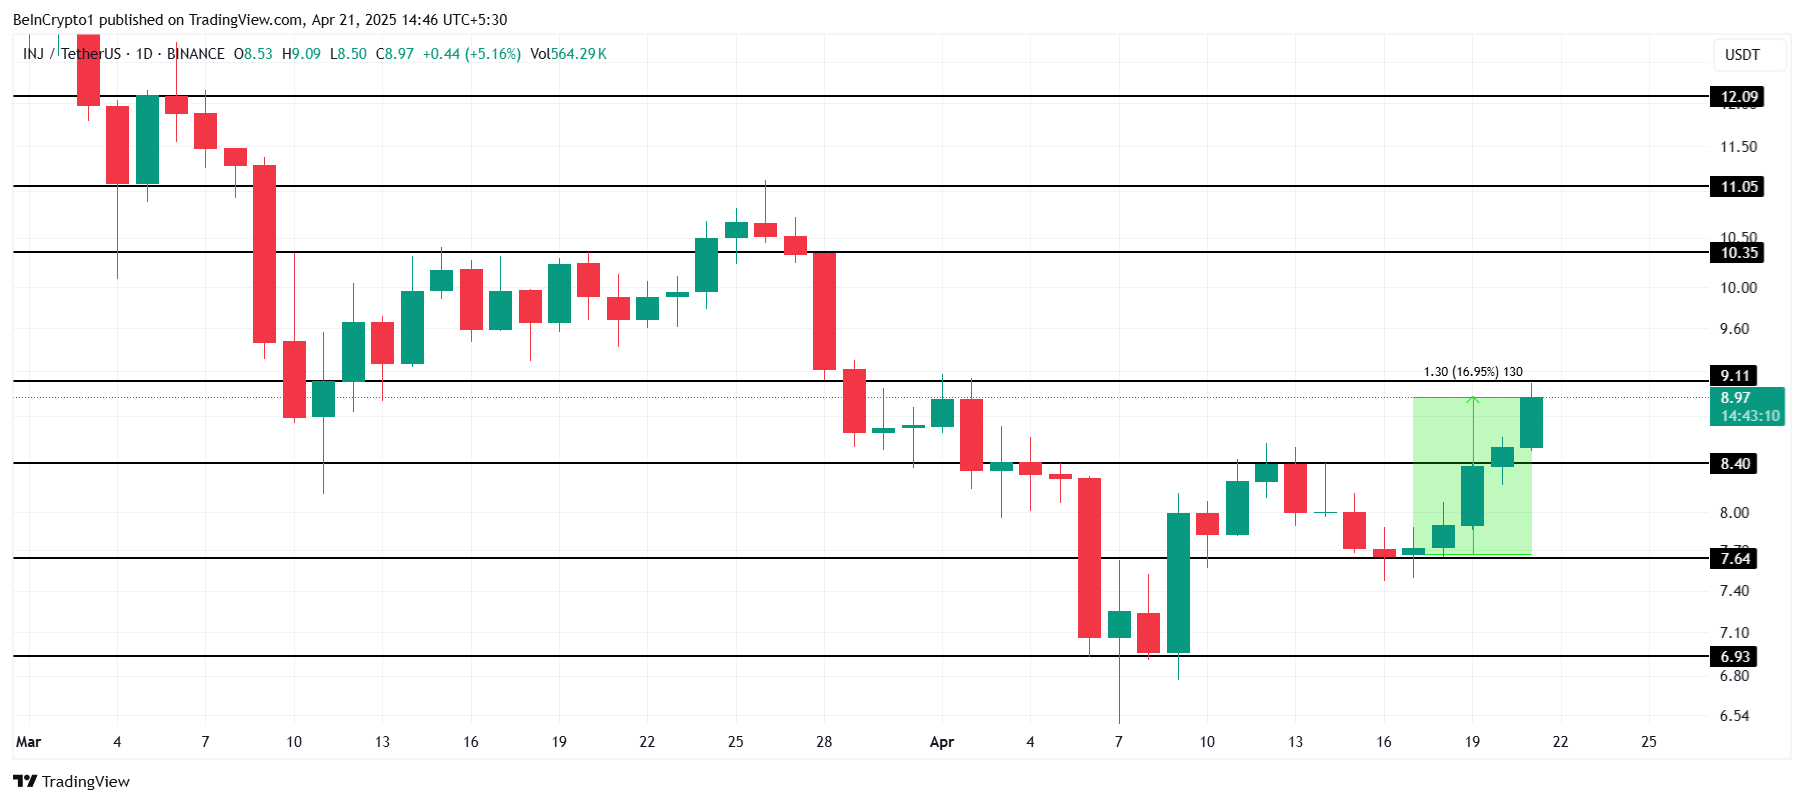
However, if Injective fails to break through the $9.11 resistance, as seen earlier in April, the price could fall below $8.40. This would signal a retreat and could see the token dip to $7.64, invalidating the bullish outlook and erasing recent gains.
BNB
BNB’s price currently stands at $604, experiencing a two-month downtrend. The altcoin is struggling to breach the resistance of $611. To push past this barrier, BNB needs strong support from the broader market or upcoming developments that could provide a catalyst for price movement and reversal.
One potential catalyst is the Lorentz opBNB mainnet hard fork, which is scheduled for today. The hard fork aims to enhance the chain’s speed and responsiveness. If successful, this could help BNB break the $611 resistance and push the price toward the next level of $647, spurring bullish sentiment.

However, if the hard fork’s impact fails to meet expectations, BNB could struggle to maintain upward momentum. In this case, the price may slip below the support of $576, potentially falling as low as $550. This would invalidate the current bullish outlook and likely continue the downtrend.
Disclaimer
In line with the Trust Project guidelines, this price analysis article is for informational purposes only and should not be considered financial or investment advice. BeInCrypto is committed to accurate, unbiased reporting, but market conditions are subject to change without notice. Always conduct your own research and consult with a professional before making any financial decisions. Please note that our Terms and Conditions, Privacy Policy, and Disclaimers have been updated.

MANTRA CEO, JP Mullin, is burning 150 million OM tokens from his own allocation and engaging other ecosystem partners to burn an additional 150 million tokens. This 300 million OM token burn aims to restore investor trust in the project and stabilize the altcoin’s price dynamics.
OM is attempting to recover from one of the most dramatic crashes in recent crypto history. On April 13, it lost over 90% of its value in a single hour. The collapse, which erased more than $5.5 billion in market cap, triggered widespread accusations of insider activity and manipulation within the Real-World Assets (RWA) sector.
Understanding MANTRA’s Token Burn
Mantra, once one of the biggest players in the Real-World Assets (RWA) sector, suffered a dramatic collapse on April 13, with its token crashing over 90% in less than an hour and wiping out more than $5.5 billion in market capitalization.
The plunge followed a rapid surge earlier this year, when OM rose from $0.013 to over $6, pushing its fully diluted valuation to $11 billion. The crash was reportedly triggered by a $40 million token deposit into OKX by a wallet allegedly linked to the team, sparking fears of insider selling.
Panic spread quickly as rumors of undisclosed OTC deals, delayed airdrops, and excessive token supply concentration fueled mass liquidations across exchanges.
Despite co-founder John Patrick Mullin denying any wrongdoing and blaming centralized exchanges for forced closures, investors and analysts raised concerns about potential manipulation by market makers and CEXs, drawing comparisons to past collapses like Terra LUNA.

In an effort to rebuild trust, Mullin has announced the permanent burn of his 150 million OM team allocation. The tokens, originally staked at mainnet launch in October 2024, are now being unbonded and will be fully burned by April 29, reducing OM’s total supply from 1.82 billion to 1.67 billion.
This move also lowers the network’s staked amount by 150 million tokens, which could impact on-chain staking APR.
Additionally, MANTRA is in talks with partners to implement a second 150 million OM burn, potentially cutting the total supply by 300 million tokens.
OM Price Faces Critical Test as Token Burn Battles Lingering Market Doubt
Despite MANTRA’s ongoing token burn efforts, it’s still uncertain whether the move will be enough to fully restore investor confidence in OM.
From a technical standpoint, if momentum begins to recover, OM could test the immediate resistance at $0.59. A successful breakout at that level may pave the way for further gains toward $0.71, with additional key hurdles at $0.89 and $0.997 standing between the token and a return to the psychologically important $1 mark.
However, reclaiming these levels will likely require sustained buying interest and broader sentiment recovery across the Real-World Assets (RWA) sector.

On the downside, if the token burn fails to shift sentiment or if selling pressure continues, OM risks resuming its decline.
The first key support lies at $0.51, and a breakdown below that level could send the price further down to $0.469.
Given the scale of the recent crash and the lingering distrust among investors, the path to recovery remains fragile—OM now sits at a critical crossroads between a potential rebound and further erosion of its market value.
Disclaimer
In line with the Trust Project guidelines, this price analysis article is for informational purposes only and should not be considered financial or investment advice. BeInCrypto is committed to accurate, unbiased reporting, but market conditions are subject to change without notice. Always conduct your own research and consult with a professional before making any financial decisions. Please note that our Terms and Conditions, Privacy Policy, and Disclaimers have been updated.

OM Price Reacts as MANTRA Announces Major 300M Token Burn Update

Onyxcoin (XCN) Shows Reversal Signs After 200% Rally

Ethereum Price Eyes $2,700 As Wyckoff Accumulation Nears Completion

Expert Reveals Pi Network’s Team Efforts To Stabilize Price Amid Token Unlocks

3 Altcoins to Watch in the Fourth Week of April 2025
Public Companies are Buying Bitcoin Again After a Brief Pause

2.52 Million Altcoins Are Ruining Crypto’s Future

Animoca Brands Valuation Tanks 75% In Two Years, Here’s Why

Crypto exchange BingX hacked for $43 million

Are The Big Players Losing Interest?

Hong Kong’s Securities Association Tips Authorities On Crypto Self-Regulation

Coinbase cbBTC Set to go Live on Solana
2.52 Million Altcoins Are Ruining Crypto’s Future
Animoca Brands Valuation Tanks 75% In Two Years, Here’s Why
Crypto exchange BingX hacked for $43 million
Are The Big Players Losing Interest?
Hong Kong’s Securities Association Tips Authorities On Crypto Self-Regulation
Coinbase cbBTC Set to go Live on Solana
-
 Bitcoin14 hours ago
US Economic Indicators to Watch & Potential Impact on Bitcoin
-

 Bitcoin24 hours ago
Bitcoin LTH Selling Pressure Hits Yearly Low — Bull Market Ready For Take Off?
-

 Bitcoin20 hours ago
Here Are The Bitcoin Levels To Watch For The Short Term
-

 Market17 hours ago
Bitcoin Price Breakout In Progress—Momentum Builds Above Resistance
-
 Altcoin12 hours ago
Expert Reveals Why BlackRock Hasn’t Pushed for an XRP ETF
-

 Altcoin17 hours ago
Expert Says Solana Price To $2,000 Is Within Reach, Here’s How
-

 Market15 hours ago
Solana Rallies Past Bitcoin—Momentum Tilts In Favor of SOL
-

 Market14 hours ago
Vitalik Buterin Proposes to Replace EVM with RISC-V