
Market
What’s Next for 1.04 Million BTC as Bitcoin Price Hits $60,000?

Bitcoin’s price recently bounced back from the crucial support level at $53,980 and is now approaching the $60,000 mark. After hitting a low of $52,270, the cryptocurrency is showing strength, supported by favorable market conditions.
Currently trading at $60,048, BTC is targeting the critical resistance at $61,725. Breaking this level will be essential for sustaining its upward momentum, and investors are closely monitoring Bitcoin’s next price move.
Bitcoin Has a Shot
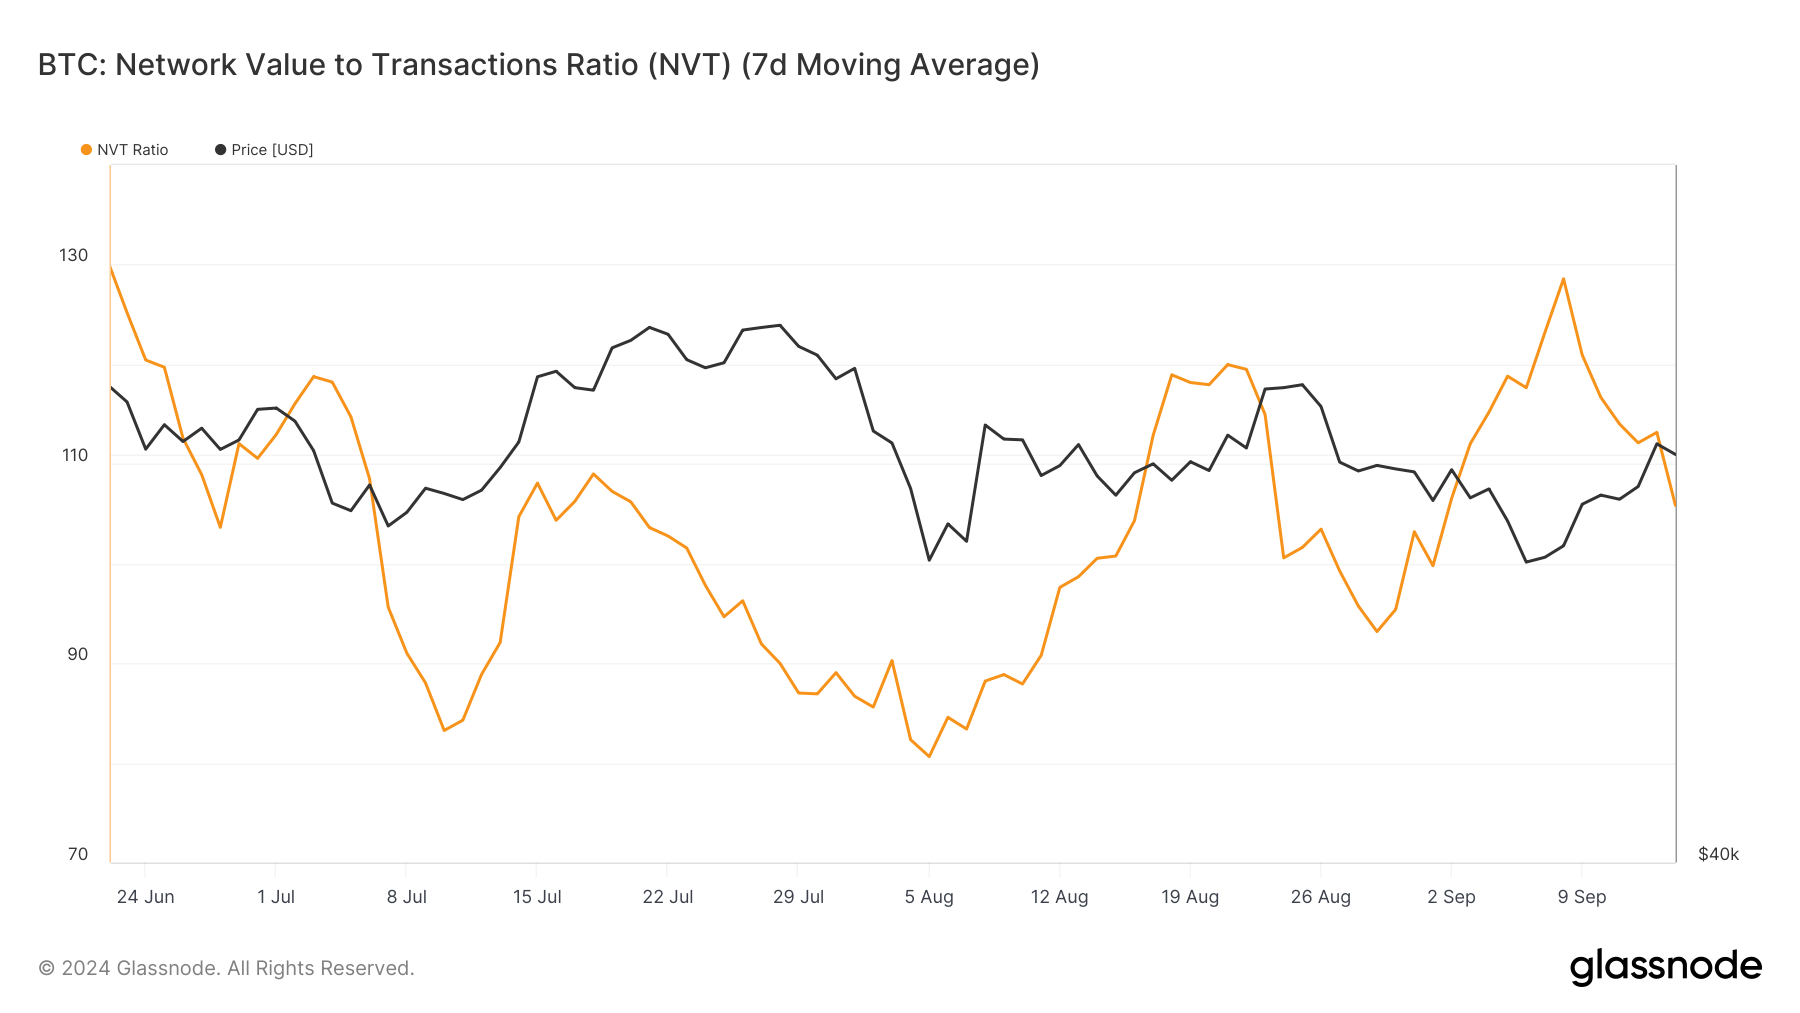
Bitcoin’s Network Value to Transactions (NVT) Ratio, a key metric for evaluating whether the asset is overvalued or undervalued, has shown a short-term decline. While the macro NVT remains on the rise, indicating potential overvaluation in the broader market, the recent dip suggests Bitcoin has a chance of breaking through the $61,725 resistance. If BTC flips this level into support, it could lead to further price gains and boost bullish sentiment among investors.
The short-term NVT drop indicates that network activity may be better aligning with Bitcoin’s valuation, pointing to a healthier price increase. With favorable macro conditions, a successful breach of $61,725 could mark the start of a new upward trend.
Read more: Bitcoin Halving History: Everything You Need To Know
Bitcoin’s macro momentum is showing promising signs, particularly with the Global In/Out of the Money (GIOM) indicator. This indicator reveals that 1.04 million BTC, worth over $62 billion, is on the verge of profitability if Bitcoin can surpass $61,725.
The majority of this supply was purchased between $58,854 and $61,231. This positions these holders for significant gains if Bitcoin breaks through this critical barrier.
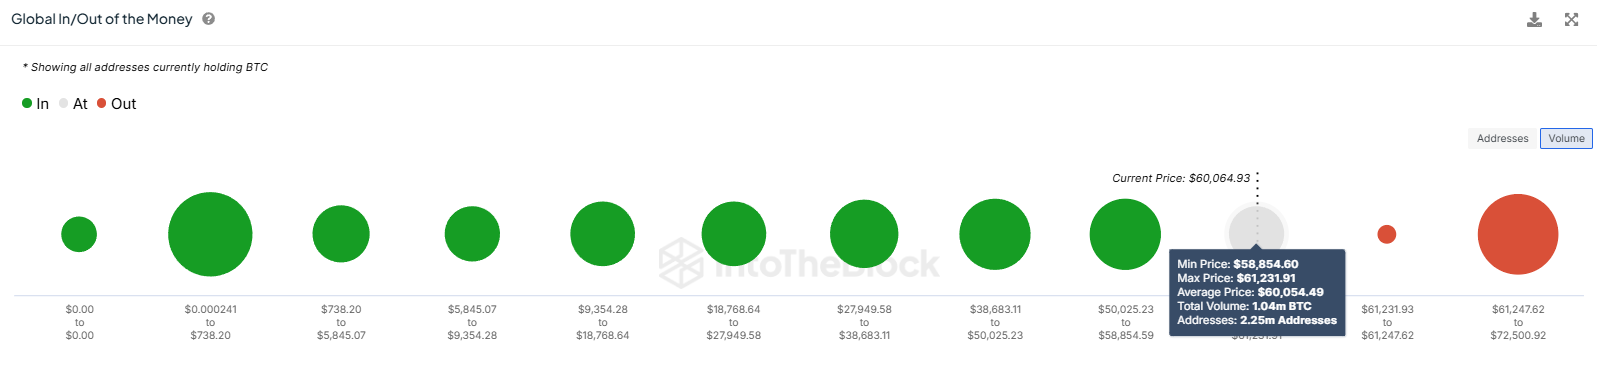
If Bitcoin can breach $61,725, the bullish momentum is likely to accelerate as more BTC holders move into profit territory. This could spur additional buying pressure, further driving up Bitcoin’s price and reinforcing its bullish outlook. However, the challenge lies in overcoming this key resistance level, which has historically proven difficult to break.
BTC Price Prediction: Holdup Ahead
Bitcoin is currently trading at $60,048 as market conditions improve. After rebounding from the $57,720 support level, the cryptocurrency appears ready to challenge the $61,725 resistance. If Bitcoin breaks through this barrier, it could signal the start of a new bullish run, with a potential target of $65,000.
Reclaiming $65,000 as support would be a key milestone for Bitcoin, especially after failing to do so in late August. A successful break above this level could attract more buying interest and push the price higher. However, Bitcoin’s ability to sustain this momentum hinges on flipping $61,725 into support.
Read more: Bitcoin (BTC) Price Prediction 2024/2025/2030
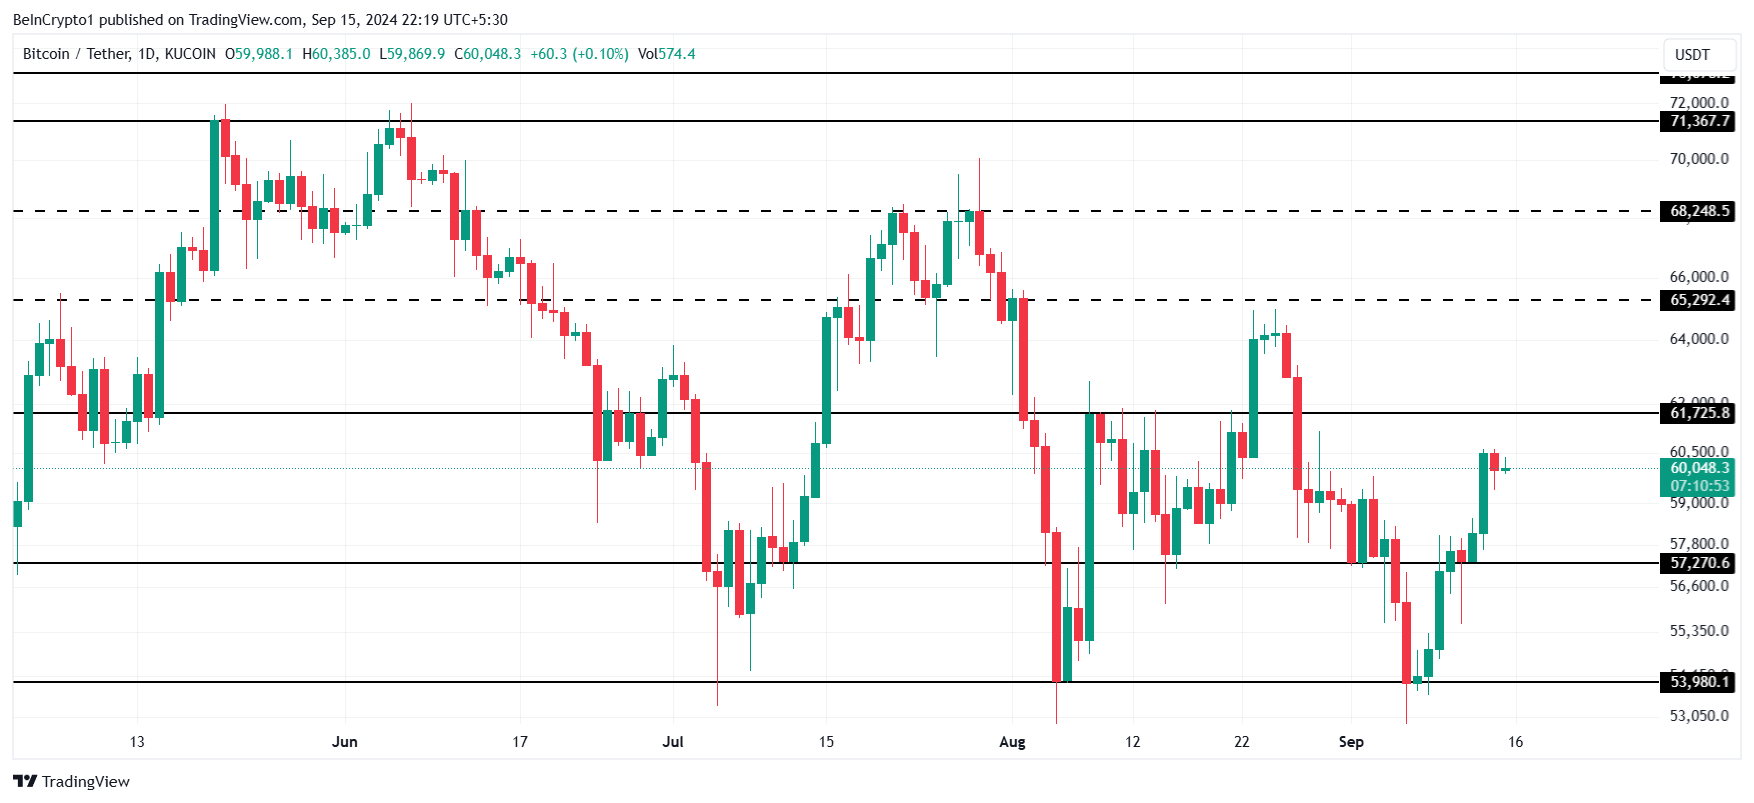
If Bitcoin fails to breach the $61,725 resistance, it could consolidate below this level, weakening the bullish outlook. In that case, Bitcoin might struggle to gain new upward momentum, leading to a period of price stagnation as investors await clearer signals.
Disclaimer
In line with the Trust Project guidelines, this price analysis article is for informational purposes only and should not be considered financial or investment advice. BeInCrypto is committed to accurate, unbiased reporting, but market conditions are subject to change without notice. Always conduct your own research and consult with a professional before making any financial decisions. Please note that our Terms and Conditions, Privacy Policy, and Disclaimers have been updated.


Aayush Jindal, a luminary in the world of financial markets, whose expertise spans over 15 illustrious years in the realms of Forex and cryptocurrency trading. Renowned for his unparalleled proficiency in providing technical analysis, Aayush is a trusted advisor and senior market expert to investors worldwide, guiding them through the intricate landscapes of modern finance with his keen insights and astute chart analysis.
From a young age, Aayush exhibited a natural aptitude for deciphering complex systems and unraveling patterns. Fueled by an insatiable curiosity for understanding market dynamics, he embarked on a journey that would lead him to become one of the foremost authorities in the fields of Forex and crypto trading. With a meticulous eye for detail and an unwavering commitment to excellence, Aayush honed his craft over the years, mastering the art of technical analysis and chart interpretation.
As a software engineer, Aayush harnesses the power of technology to optimize trading strategies and develop innovative solutions for navigating the volatile waters of financial markets. His background in software engineering has equipped him with a unique skill set, enabling him to leverage cutting-edge tools and algorithms to gain a competitive edge in an ever-evolving landscape.
In addition to his roles in finance and technology, Aayush serves as the director of a prestigious IT company, where he spearheads initiatives aimed at driving digital innovation and transformation. Under his visionary leadership, the company has flourished, cementing its position as a leader in the tech industry and paving the way for groundbreaking advancements in software development and IT solutions.
Despite his demanding professional commitments, Aayush is a firm believer in the importance of work-life balance. An avid traveler and adventurer, he finds solace in exploring new destinations, immersing himself in different cultures, and forging lasting memories along the way. Whether he’s trekking through the Himalayas, diving in the azure waters of the Maldives, or experiencing the vibrant energy of bustling metropolises, Aayush embraces every opportunity to broaden his horizons and create unforgettable experiences.
Aayush’s journey to success is marked by a relentless pursuit of excellence and a steadfast commitment to continuous learning and growth. His academic achievements are a testament to his dedication and passion for excellence, having completed his software engineering with honors and excelling in every department.
At his core, Aayush is driven by a profound passion for analyzing markets and uncovering profitable opportunities amidst volatility. Whether he’s poring over price charts, identifying key support and resistance levels, or providing insightful analysis to his clients and followers, Aayush’s unwavering dedication to his craft sets him apart as a true industry leader and a beacon of inspiration to aspiring traders around the globe.
In a world where uncertainty reigns supreme, Aayush Jindal stands as a guiding light, illuminating the path to financial success with his unparalleled expertise, unwavering integrity, and boundless enthusiasm for the markets.

The Solana-based meme coin FARTCOIN has once again claimed its spot as the market’s top gainer, surging to a two-month high of $0.73.
It has seen an impressive 39% price increase over the past 24 hours, reflecting a notable uptick amid an otherwise declining market.
FARTCOIN Defies the Odds, Soars to Two-Month High
FARTCOIN plunged to a year-to-date low of $0.19 on March 10. This presented a buying opportunity for the meme coin holders, who have since increased their buy orders for the token. Trading at a two-month high of $0.72 as of this writing, FARTCOIN’s value has since soared by 279% in the past month.
On the daily chart, FARTCOIN’s triple-digit rally has pushed its price above the Leading Span A (green line) of its Ichimoku Cloud. The strengthening bullish momentum is now driving the altcoin toward the Leading Span B (red line) of this indicator, a breakout of which would further validate FARTCOIN’s current bull run.
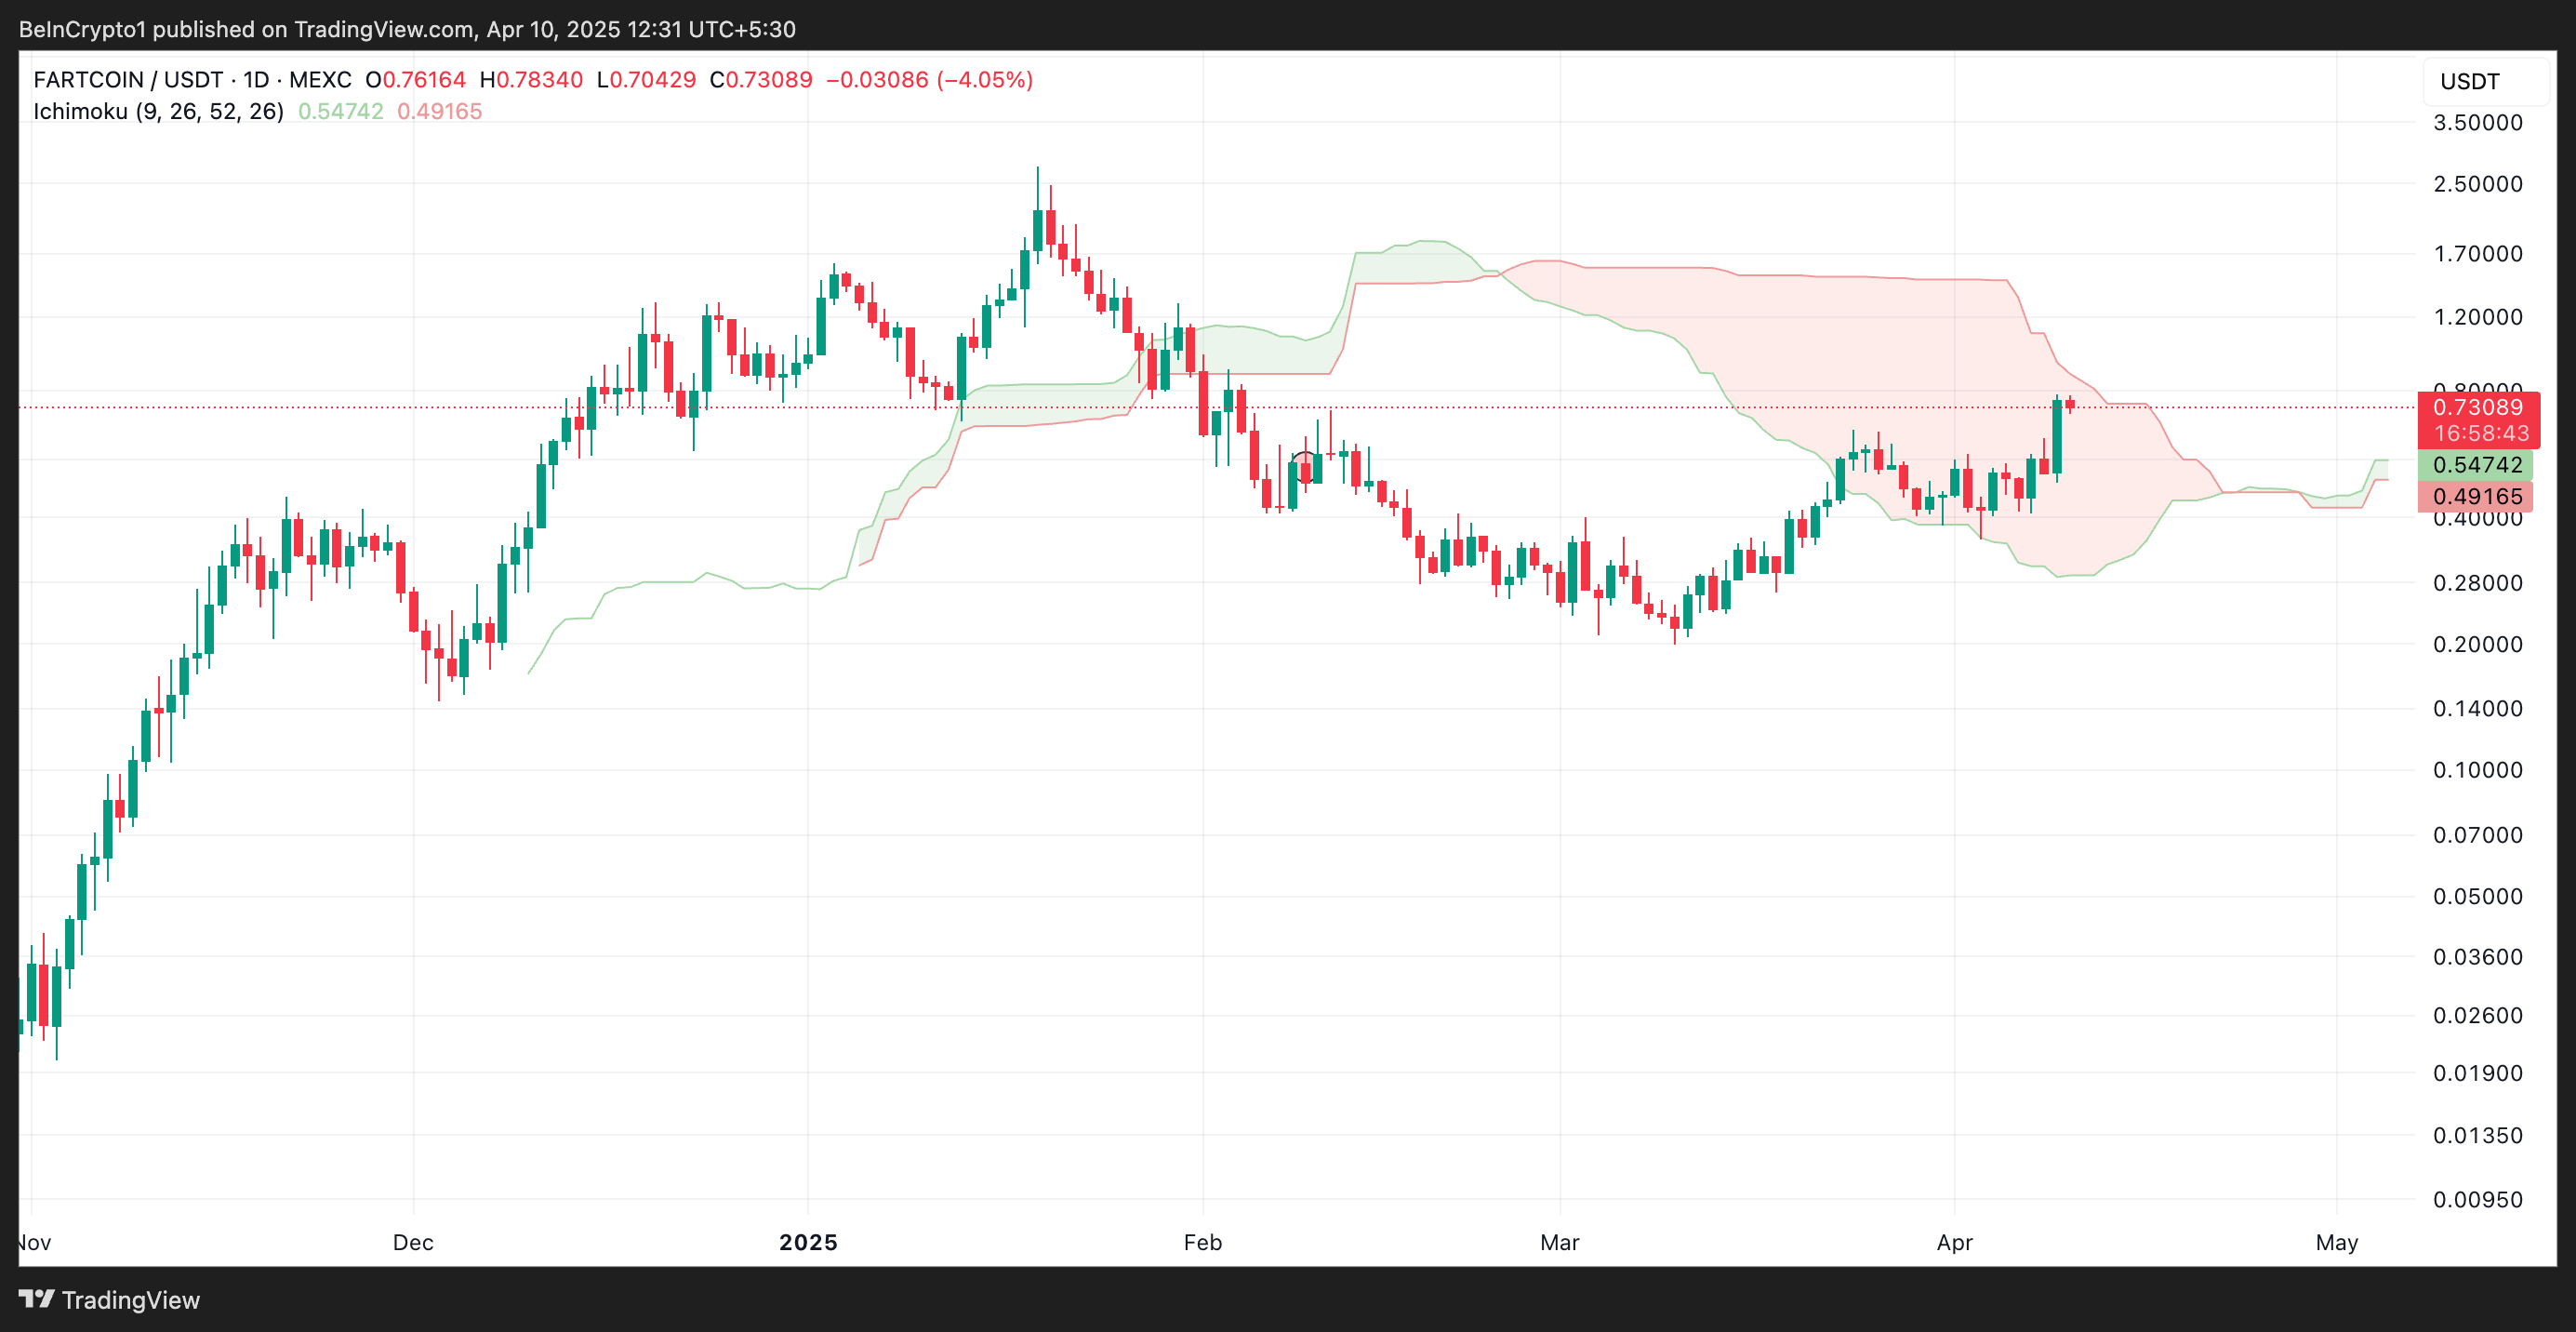
The Ichimoku Cloud tracks the momentum of an asset’s market trends and identifies potential support/resistance levels.
When an asset’s price breaks above Leading Span A and is poised to break above Leading Span B, it signals a strengthening bullish trend. This hints at the potential for further upward movement as FARTCOIN moves into a more favorable market position.
Further, the altcoin’s Chaikin Money Flow (CMF) remains above the zero line, confirming the preference for FARTCOIN accumulation over selloffs. At press time, this momentum indicator, which measures how money flows into and out of an asset, is at 0.13.
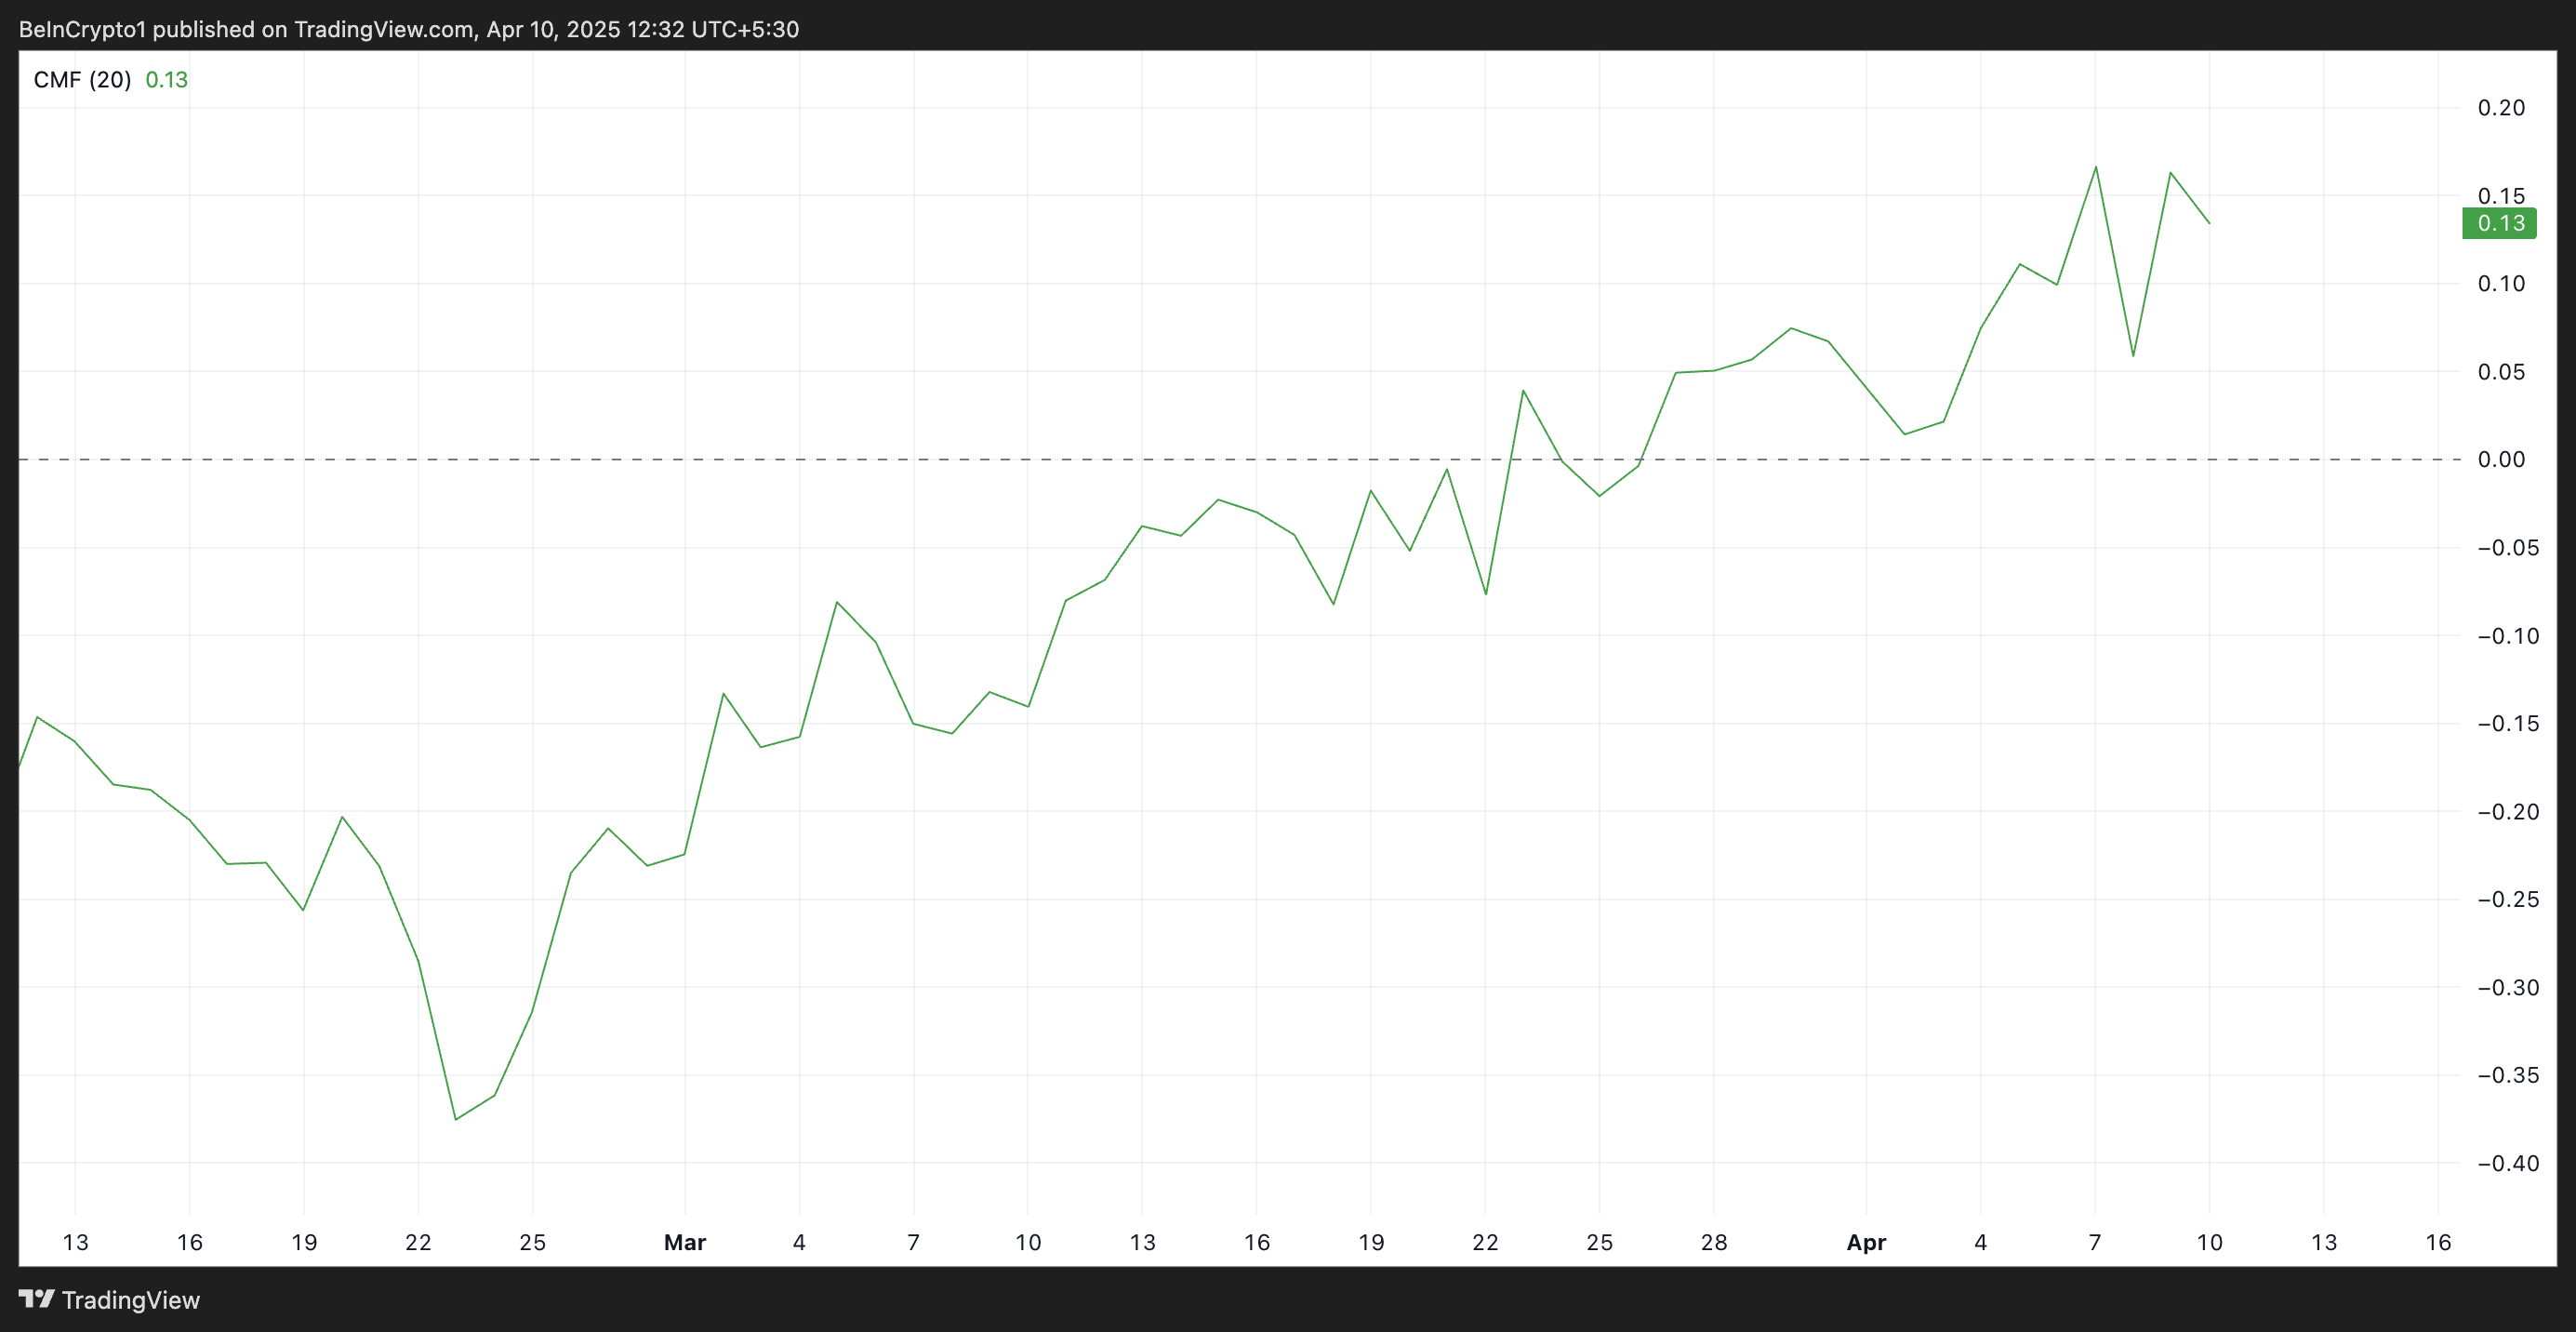
A positive CMF reading during a rally like this indicates strong buying pressure and market participation, as the volume of buy orders outweighs sell orders. This suggests that FARTCOIN’s rally is supported by solid demand, reinforcing the sustainability of the upward movement.
FARTCOIN is on Track for $1
Since its rally began on March 10, FARTCOIN has traded within an ascending parallel channel. This bullish pattern confirms the growing demand for the meme coin.
If buying pressure strengthens, FARTCOIN could extend its gains. In that case, its price could break above the Leading Span B, which currently forms a dynamic resistance above its price. A successful break above this level could propel the token toward $1.
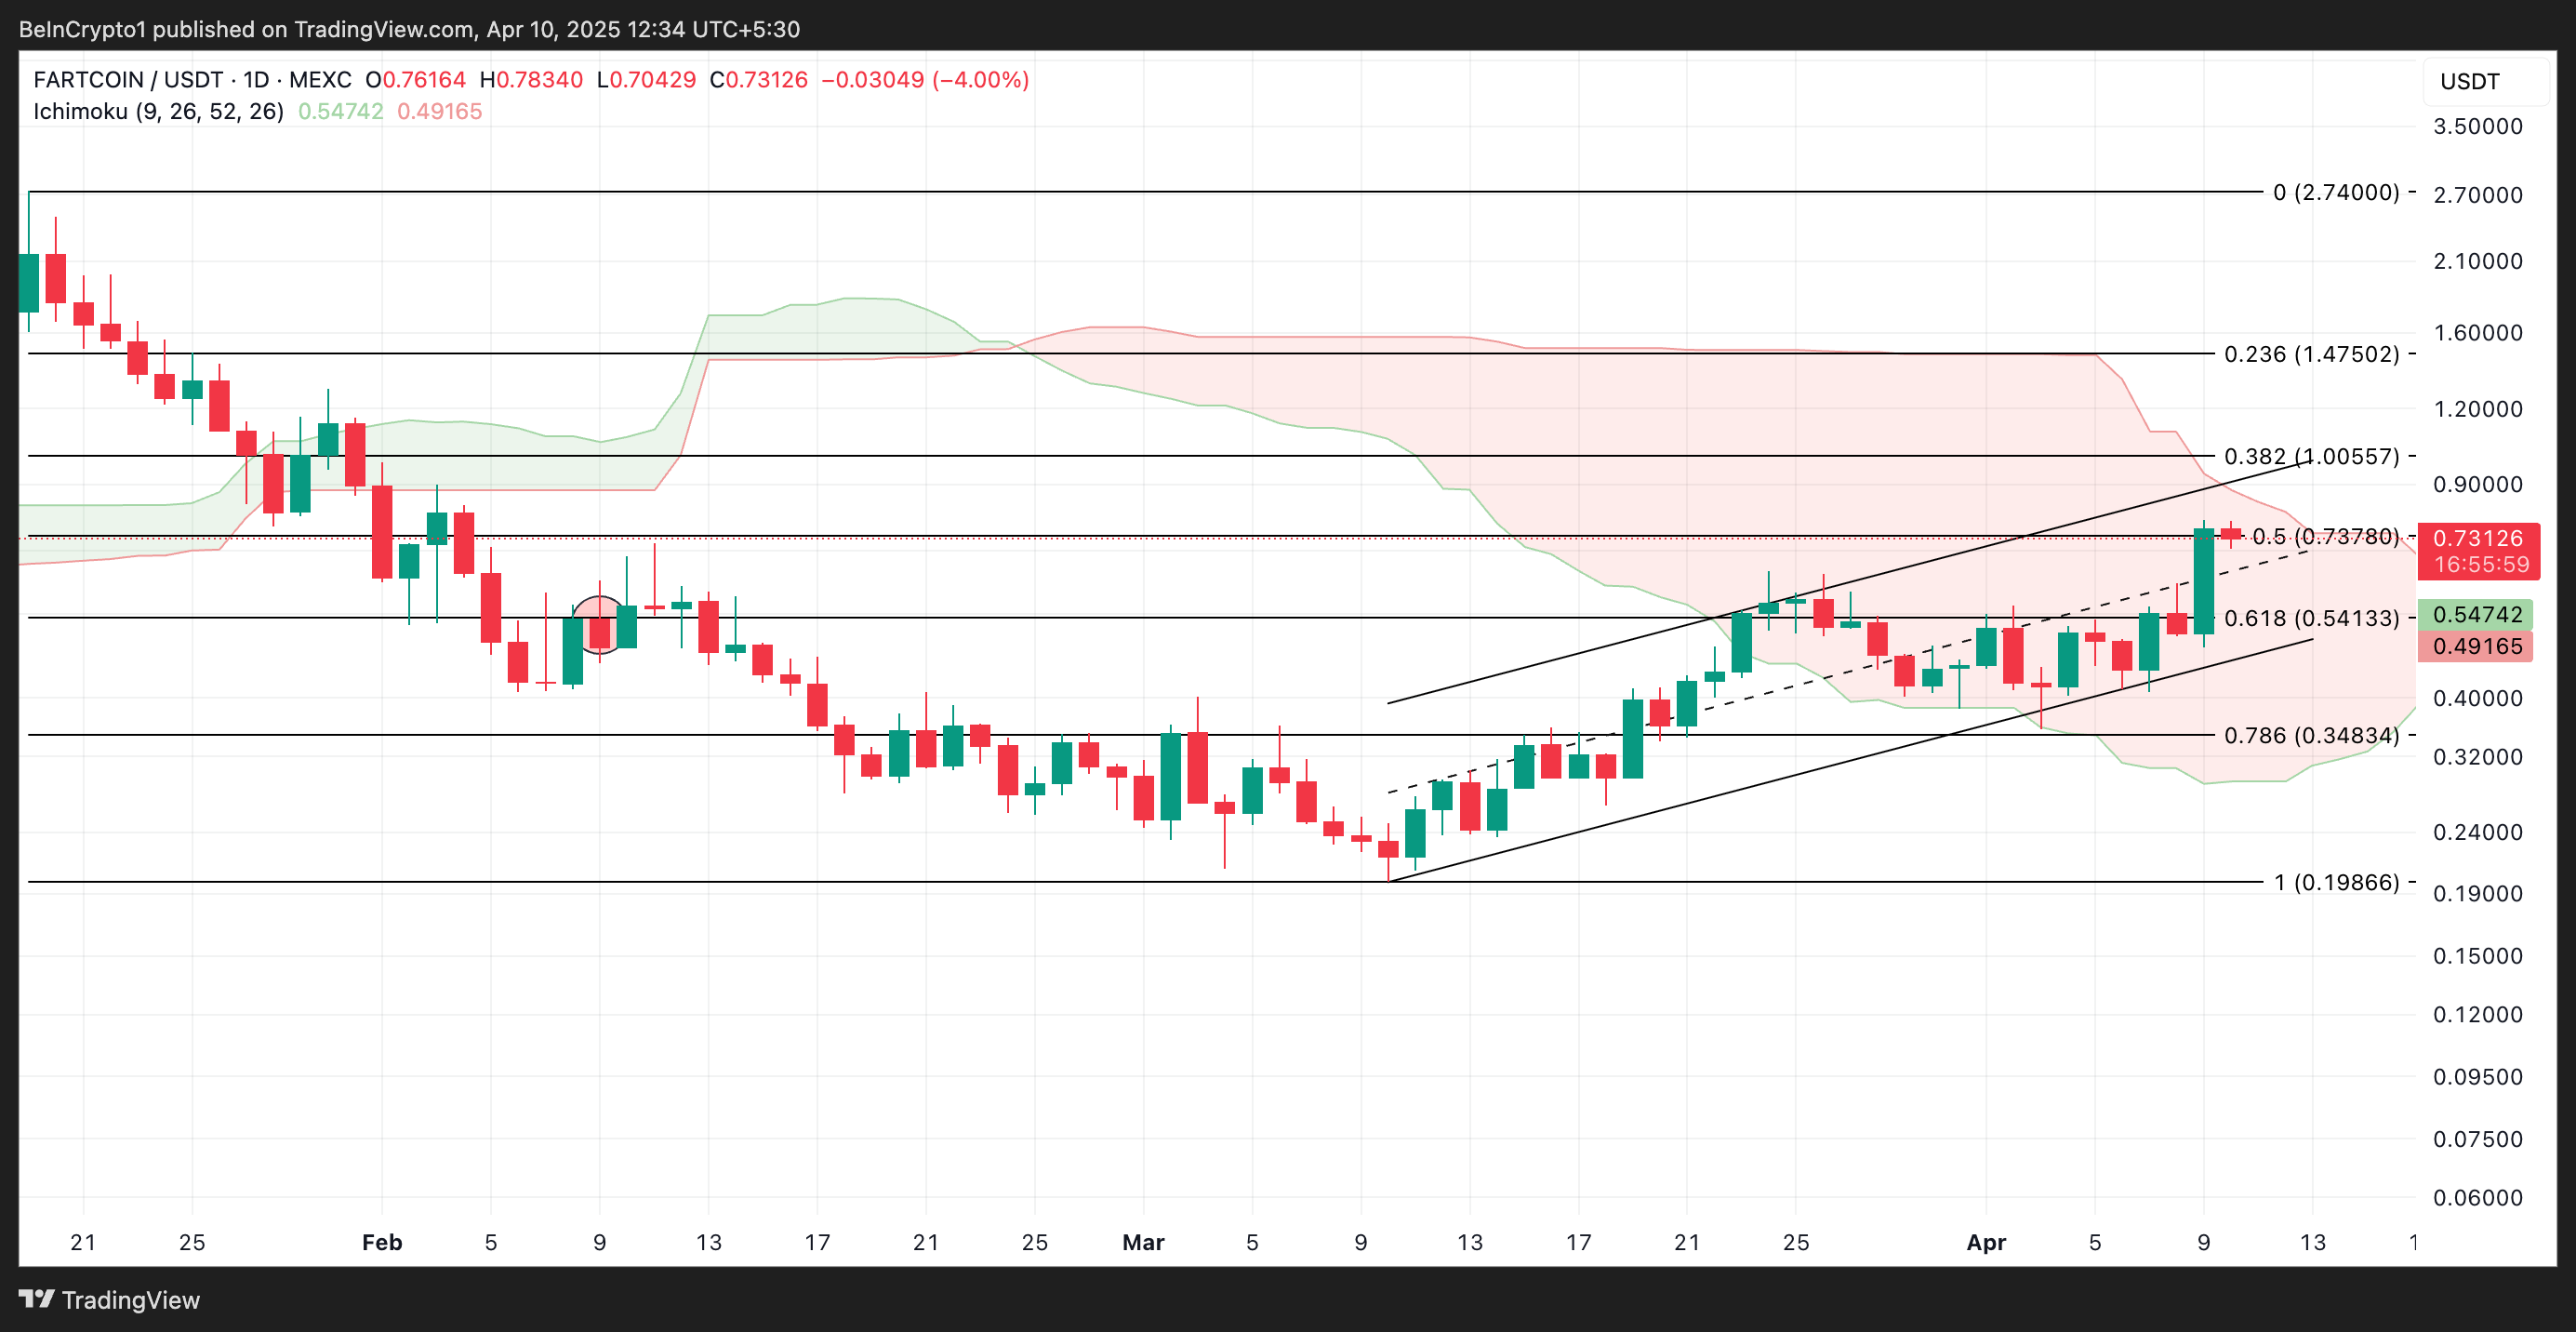
However, if profit-taking resumes, this bullish projection will be invalidated. In that scenario, meme coin FARTCOIN’s price could dip to $0.54.
Disclaimer
In line with the Trust Project guidelines, this price analysis article is for informational purposes only and should not be considered financial or investment advice. BeInCrypto is committed to accurate, unbiased reporting, but market conditions are subject to change without notice. Always conduct your own research and consult with a professional before making any financial decisions. Please note that our Terms and Conditions, Privacy Policy, and Disclaimers have been updated.

Despite breaking above $3 earlier this year, the XRP price has since gone on to disappoint investors with multiple crashes that have rocked the altcoin. This has seen the cryptocurrency lose almost 50% of its acquired value between late 2024 and early 2025. Nevertheless, this has failed to erode bullish sentiment, with predictions for higher prices dominating the community.
Time To Go Long On The XRP Price?
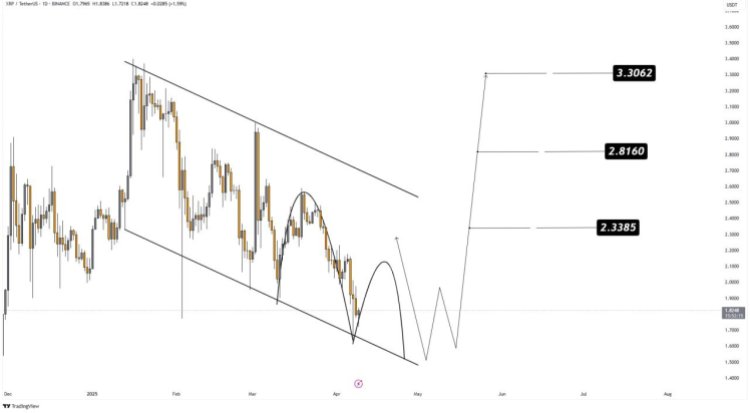
A crypto analyst on X (formerly Twitter) has renewed bullish hope after identifying an important formation on the XRP price chart. The analysis pointed out that the XRP Price is still moving within a descending channel, a formation that usually signals a bearish move.
However, the downtrend has pushed the altcoin’s price to the point where it is now testing the bottom trend line. This bottom trend line has been known to act as strong support previously and is expected to do so this time around.
With the support forming, it is likely that the XRP Price is gearing up for a bounce from this level. Furthermore, the crypto analyst points out that XRP is also forming a rounded bottom inside this descending channel. Such a rounded bottom could signal an end to the downtrend from here.
As the formation grows, the main level of support is now sitting at $1.6. So far, this level has held up quite nicely and bulls have been using it as a bounce-off point for recovery. Given this, the crypto analyst advises that entries for the XRP price are best at around $1.70 to $1.85.
This is not the only good news for the XRP price with support forming. If it holds and the altcoin does indeed bounce from this level toward $2, then the next important levels lie between $2 and $2.2. These serve as the levels for the bulls to beat to confirm a bullish continuation toward a possible all-time high.
If the bulls are successful, then three profit targets are placed by the crypto analyst. These include $2.3385, $2.8160, and $3.3062, pushing it toward January 2025 highs.
The Bearish Case
While the analysis is inherently bullish, there is still the possibility of invalidation that could send the XRP price tumbling further. As the analyst points out, the major support currently lies at $1.6. This means that bulls must hold this level. Otherwise, there is the risk of a much deeper correction as a liquidity sweep could send support further down to $1.3.
Nevertheless, with buy sentiments building once again, it is likely that XRP will follow the bullish scenario in this case.
Chart from TradingView.com

Solana (SOL) Jumps But Smacks Into $120 Resistance Wall—Can It Break Through?
Bullish Signal for Bitcoin in 2025?

Analyst Reveals How XRP Price Can Hit $22 If BTC Rallies To This Level

Meme Coin FARTCOIN Hits Two-Month High, Could It Reach $1?

Will Q2 2025 Mark the Return of Altcoin Season?

XRP Price Forms Rounded Bottom Within Descending Channel, Target Set Above $3

2.52 Million Altcoins Are Ruining Crypto’s Future

Animoca Brands Valuation Tanks 75% In Two Years, Here’s Why

Crypto exchange BingX hacked for $43 million

Are The Big Players Losing Interest?

Hong Kong’s Securities Association Tips Authorities On Crypto Self-Regulation

Coinbase cbBTC Set to go Live on Solana
2.52 Million Altcoins Are Ruining Crypto’s Future
Animoca Brands Valuation Tanks 75% In Two Years, Here’s Why
Crypto exchange BingX hacked for $43 million
Are The Big Players Losing Interest?
Hong Kong’s Securities Association Tips Authorities On Crypto Self-Regulation
Coinbase cbBTC Set to go Live on Solana
-
 Bitcoin13 hours ago
MicroStrategy Bitcoin Dump Rumors Circulate After SEC Filing
-

 Altcoin16 hours ago
NFT Drama Ends For Shaquille O’Neal With Hefty $11 Million Settlement
-
 Market12 hours ago
XRP Primed for a Comeback as Key Technical Signal Hints at Explosive Move
-

 Bitcoin22 hours ago
Will the Corporate Bitcoin Accumulation Trend Continue in 2025?
-
 Altcoin15 hours ago
Is Dogecoin Price Levels About To Bounce Back?
-
 Market22 hours ago
Paul Atkins SEC Confirmation Vote
-

 Market8 hours ago
Bitcoin Rallies After Trump Pauses Tariff—Crypto Markets Cheer the Move
-

 Market13 hours ago
SEC Approves Ethereum ETF Options Trading After Delays