Market
Weakening Momentum Could Signal Reversal

Aptos (APT) price has surged nearly 14% in the past seven days, yet signs of uncertainty are emerging as key indicators suggest a potential shift in momentum. While bulls have maintained some control during this recent rally, recent signals point to a weakening trend that could lead to consolidation or even a reversal.
With support and resistance levels becoming crucial, Aptos may be gearing up for a significant move in either direction. The market appears to be waiting for a clear signal before making a decisive move.
Current Trends Are Still Not Strong
Aptos (APT) DMI’s current values show a weak trend. The ADX is at 21.61, indicating low market momentum. The +DI is at 19.63, slightly above the -DI at 15.83. This suggests bulls have a small edge, but it isn’t enough to signal strong bullish action.
The Directional Movement Index (DMI) measures the strength and direction of a trend. It has three components: the ADX, +DI, and -DI.
The ADX tells us how strong the trend is. The +DI shows bullish strength, while the -DI reflects bearish strength. When the ADX is above 25, it signals a strong trend. Crossovers between the +DI and -DI suggest potential trend changes.
Read More: Aptos Crypto (APT): A Guide to What it Is and How it Works

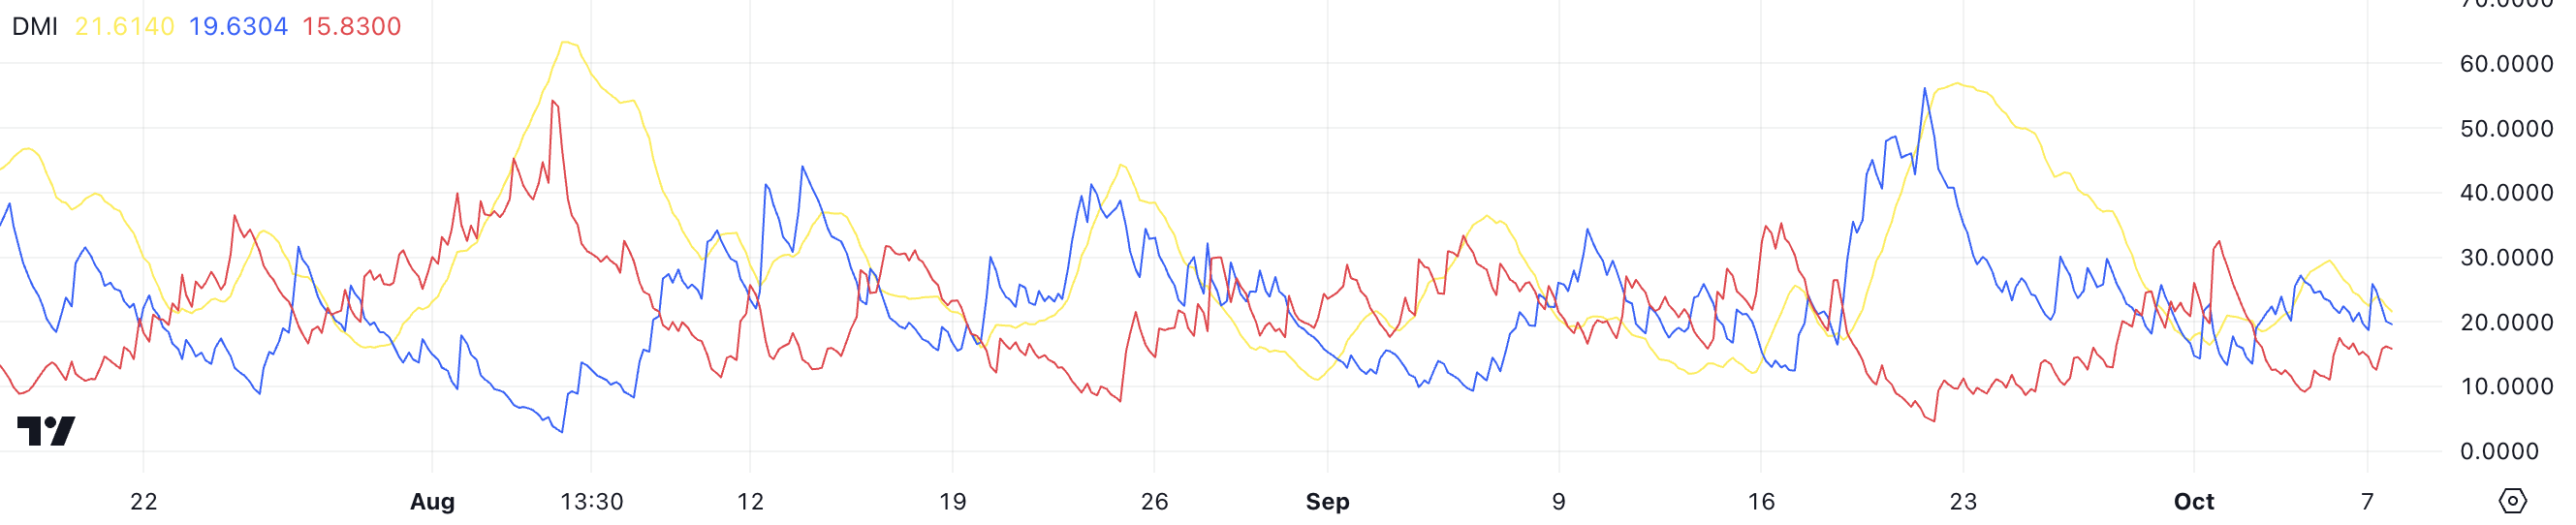
APT’s current DMI values highlight a lack of a strong market trend. The ADX below 25 means there is no significant upward or downward force.
While the +DI is slightly higher than the -DI, this advantage is weak. It doesn’t point to a clear bullish movement in the short term.
With no strong trend in place, APT appears to be in a consolidation phase. The price is likely to move sideways as neither bulls nor bears are in control. For now, APT’s DMI suggests that the market is waiting for a stronger signal before making any decisive moves.
This Metric Shows Mixed Signals For Aptos
Aptos (APT) Ichimoku Cloud currently signals a mixed trend. The price is at $8.57, slightly below its recent peak of $9. It remains above the Kumo (cloud), suggesting a potential bullish continuation.
However, the cloud ahead is thin, which implies weak support or resistance in the near future.
The Ichimoku Cloud indicator offers a comprehensive view of trend direction, momentum, and potential support/resistance. It includes five key lines: Tenkan-sen (blue) and Kijun-sen (red) for short- and medium-term momentum, Senkou Span A (green) and Senkou Span B (red) for future support/resistance, and the Chikou Span (green) for historical comparison.
When the price is above the cloud, it indicates a bullish trend, and below it, a bearish trend. Thicker clouds signal stronger support/resistance, while thinner clouds are weaker.

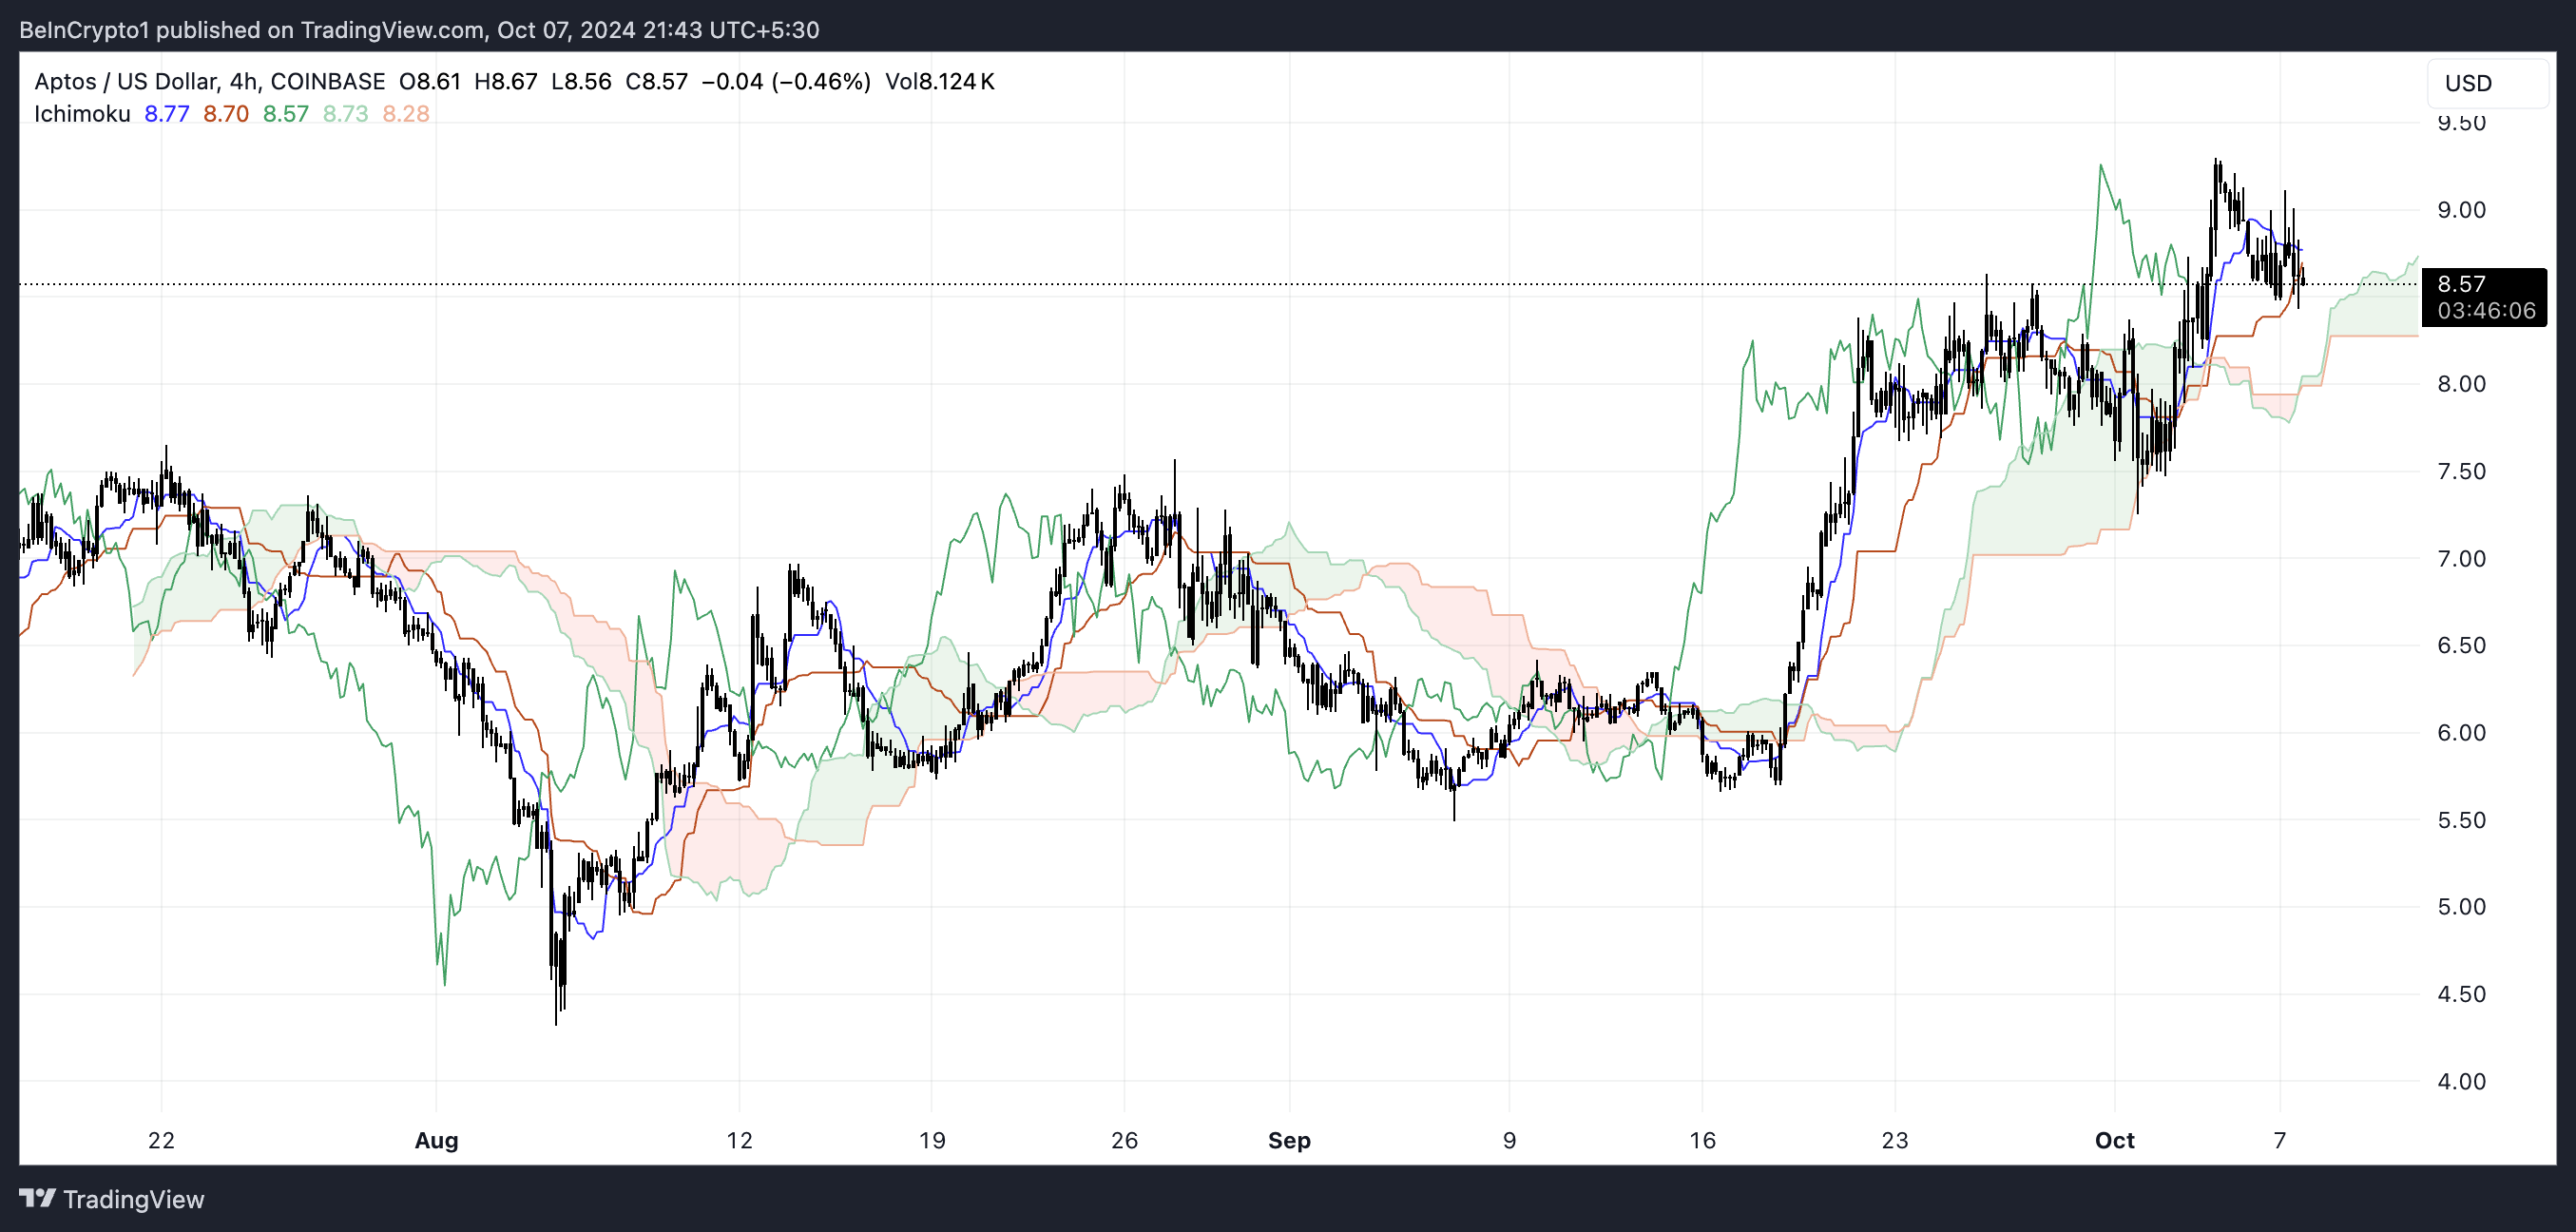
Currently, Aptos’s price remains above the cloud, keeping the overall sentiment bullish. However, the thin cloud ahead indicates weaker support between $8.50 and $8.00. The Tenkan-sen and Kijun-sen lines have flattened, suggesting potential consolidation if the price doesn’t break higher.
In summary, Aptos appears to be entering into a consolidation phase. While the price above the cloud shows bulls still have some control, the weak cloud and flattening momentum suggest the market is waiting for a clear move. A breakout above $9 or a drop below $8 would provide more clarity on the next direction.
Aptos Price Prediction: Potential Reversal as Short-Term Momentum Weakens
The Aptos price chart highlights important Exponential Moving Averages (EMAs), which are used to track trends by giving more weight to recent price movements. The shorter-term EMAs are beginning to slope downward, indicating a potential weakening of the short-term uptrend.
These EMAs help to indicate the broader trend, with shorter-term EMAs being more responsive to recent changes and longer-term EMAs providing overall trend direction. When shorter EMAs are above the longer ones, it typically signals an uptrend, while the reverse indicates bearish momentum.
Support and resistance levels are clearly defined. The major resistance lies at $9.30, a level that was tested but failed to break. On the downside, there is support at $7.25 and $7.50, with the latter aligning closely with the 200-day EMA, providing stronger potential support if the price falls.
Read More: Where To Buy Aptos (APT): 5 Best Platforms for 2024
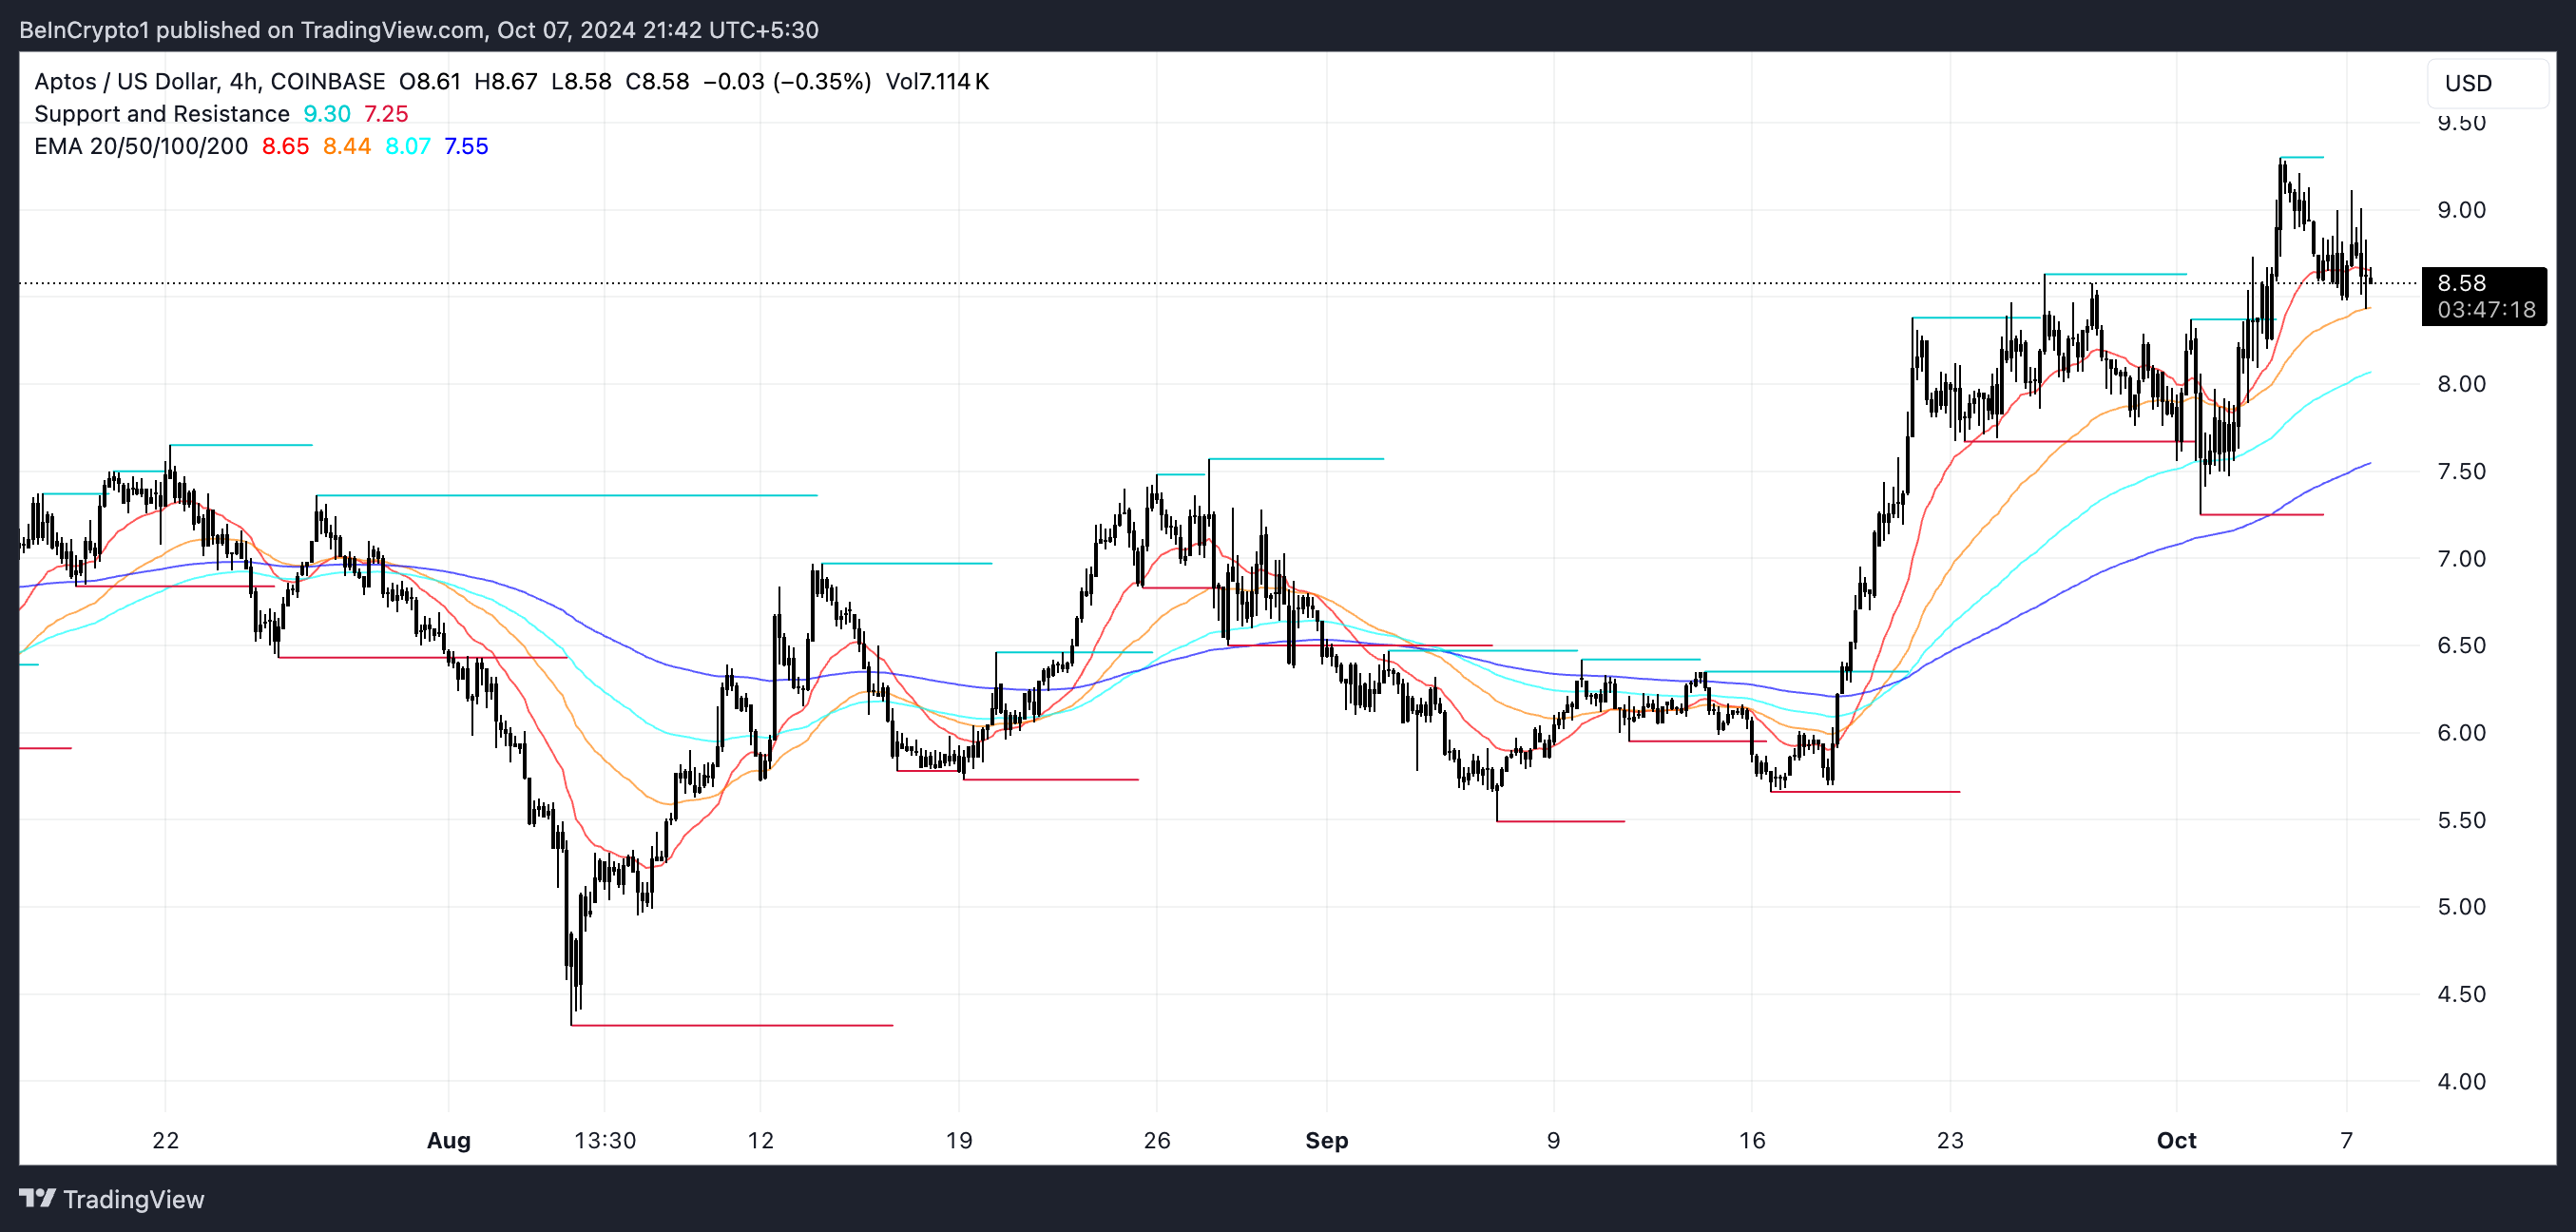
If the uptrend regains strength, breaking the $9.30 resistance could lead to a move higher, potentially testing the $9.50 area or beyond. To maintain the bullish trend, the shorter-term EMAs would need to stay above the longer-term EMAs and begin trending upward again.
However, if the trend reversal continues, as the sloping downward short-term EMAs suggest, Aptos price could move lower to test the $8.00 support. A breakdown below this level could open the door for further declines toward the $7.50 and $7.25 zones. The short-term momentum shows signs of weakening, increasing the likelihood of a reversal in the near future.
Disclaimer
In line with the Trust Project guidelines, this price analysis article is for informational purposes only and should not be considered financial or investment advice. BeInCrypto is committed to accurate, unbiased reporting, but market conditions are subject to change without notice. Always conduct your own research and consult with a professional before making any financial decisions. Please note that our Terms and Conditions, Privacy Policy, and Disclaimers have been updated.