Market
VIRTUAL Price Plummets 15% as Correction Worsens

VIRTUAL price is undergoing a sharp correction, dropping 58.7% in the last 30 days and 15% in the past 24 hours. Its market cap now sits at $1.23 billion, marking a significant decline as bearish momentum strengthens.
Technical indicators reflect this weakness, with ADX rising, confirming the downtrend, while BBTrend remains negative despite some improvement. As VIRTUAL continues trading below $2, the next move will depend on whether it can break resistance and recover or lose support and extend its decline.
VIRTUAL ADX Shows the Current Downtrend Is Getting Stronger
One of the leading AI agent tokens, Virtuals Protocol, has sustained a week-long decline driven by the latest DeepSeek hype. The token’s ADX (Average Directional Index) is currently at 22.5, rising from 15.3 just a day ago, indicating a strengthening trend.
The ADX measures the strength of a trend on a scale from 0 to 100, with readings below 20 signaling a weak trend and above 25 confirming a strong one.
Values between 20 and 25 suggest a transition phase, where momentum is building but not yet fully established.


With VIRTUAL in a downtrend, the rising ADX suggests that bearish momentum is intensifying. If ADX continues increasing above 25, it would confirm that the downward trend is gaining strength, making a recovery more difficult.
However, if ADX stabilizes or starts declining, it could indicate that selling pressure is weakening, potentially allowing the price to consolidate or reverse.
VIRTUAL BBTrend Has Been Negative Since January 20
VIRTUAL’s BBTrend is currently at -15.5, having remained negative since January 20, with a negative peak of -36.5 on January 30.
BBTrend (Bollinger Band Trend) is an indicator that measures trend strength and direction based on Bollinger Bands. Positive values indicate an uptrend, while negative values signal a downtrend, with more extreme readings suggesting stronger momentum in either direction.

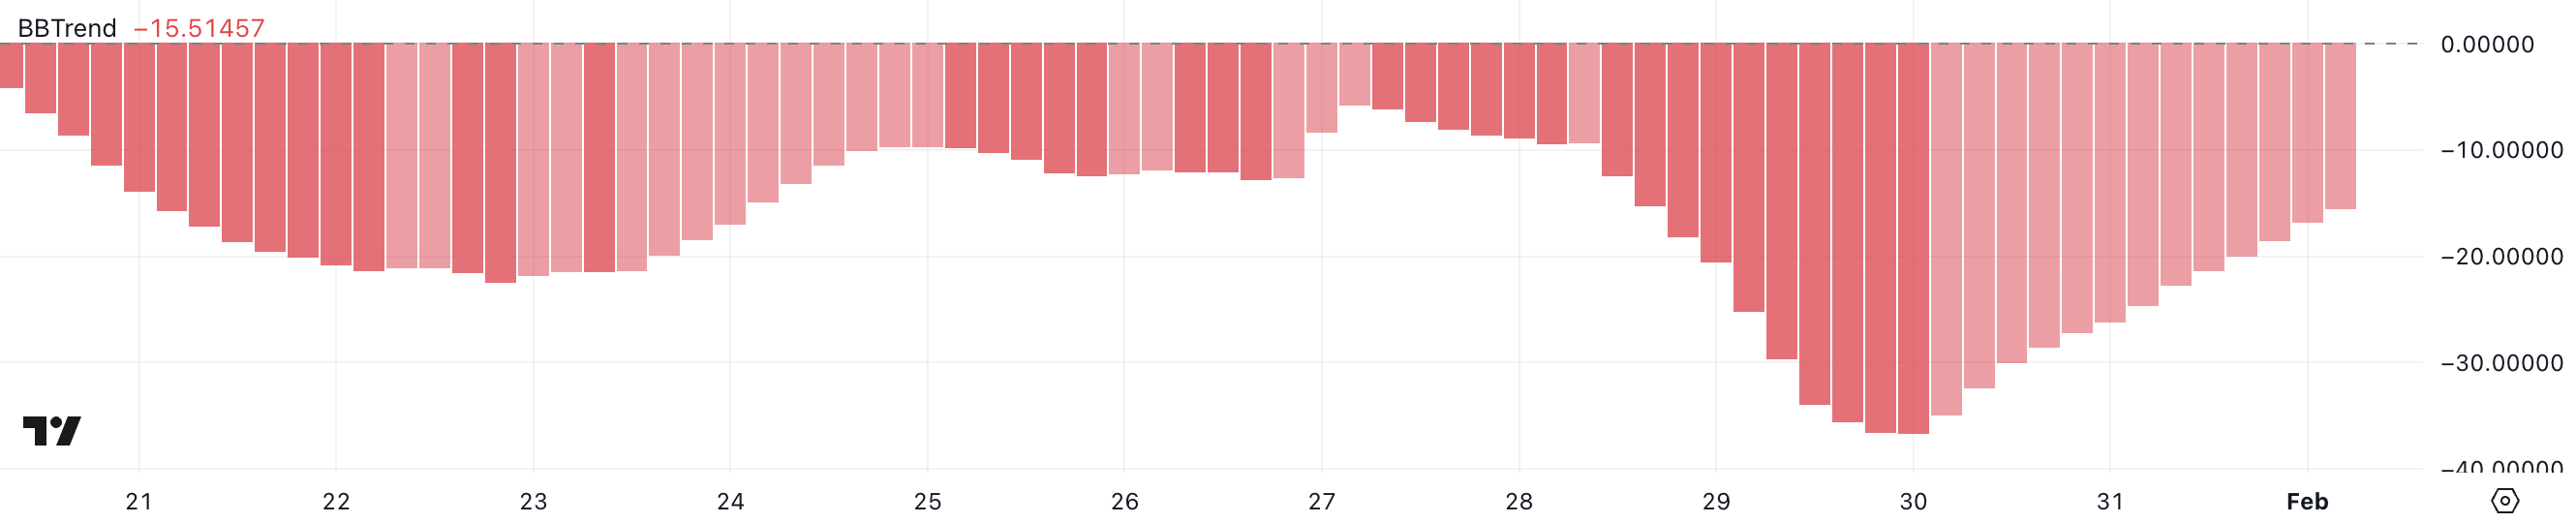
Although still negative, VIRTUAL‘s BBTrend improved from -36.5 to -15.5. This suggests that the downtrend is weakening. If BBTrend continues rising toward neutral (0), it could indicate that selling pressure is fading, allowing for stabilization or potential recovery.
However, if the BBTrend turns lower again, it would confirm that the bearish trend remains strong, increasing the likelihood of further downside.
VIRTUAL Price Prediction: Will VIRTUAL Continue Trading Below $2?
VIRTUAL price is currently trading within a range between support at $1.77 and resistance at $1.99, with price movement showing signs of consolidation. If the $1.99 resistance is broken, it could signal the start of a stronger uptrend, pushing VIRTUAL toward $2.22 and $2.42 as the next key levels.
A resurgence in crypto AI agents hype could further fuel momentum, potentially leading to a recovery toward $3.14, a level not seen in recent weeks.

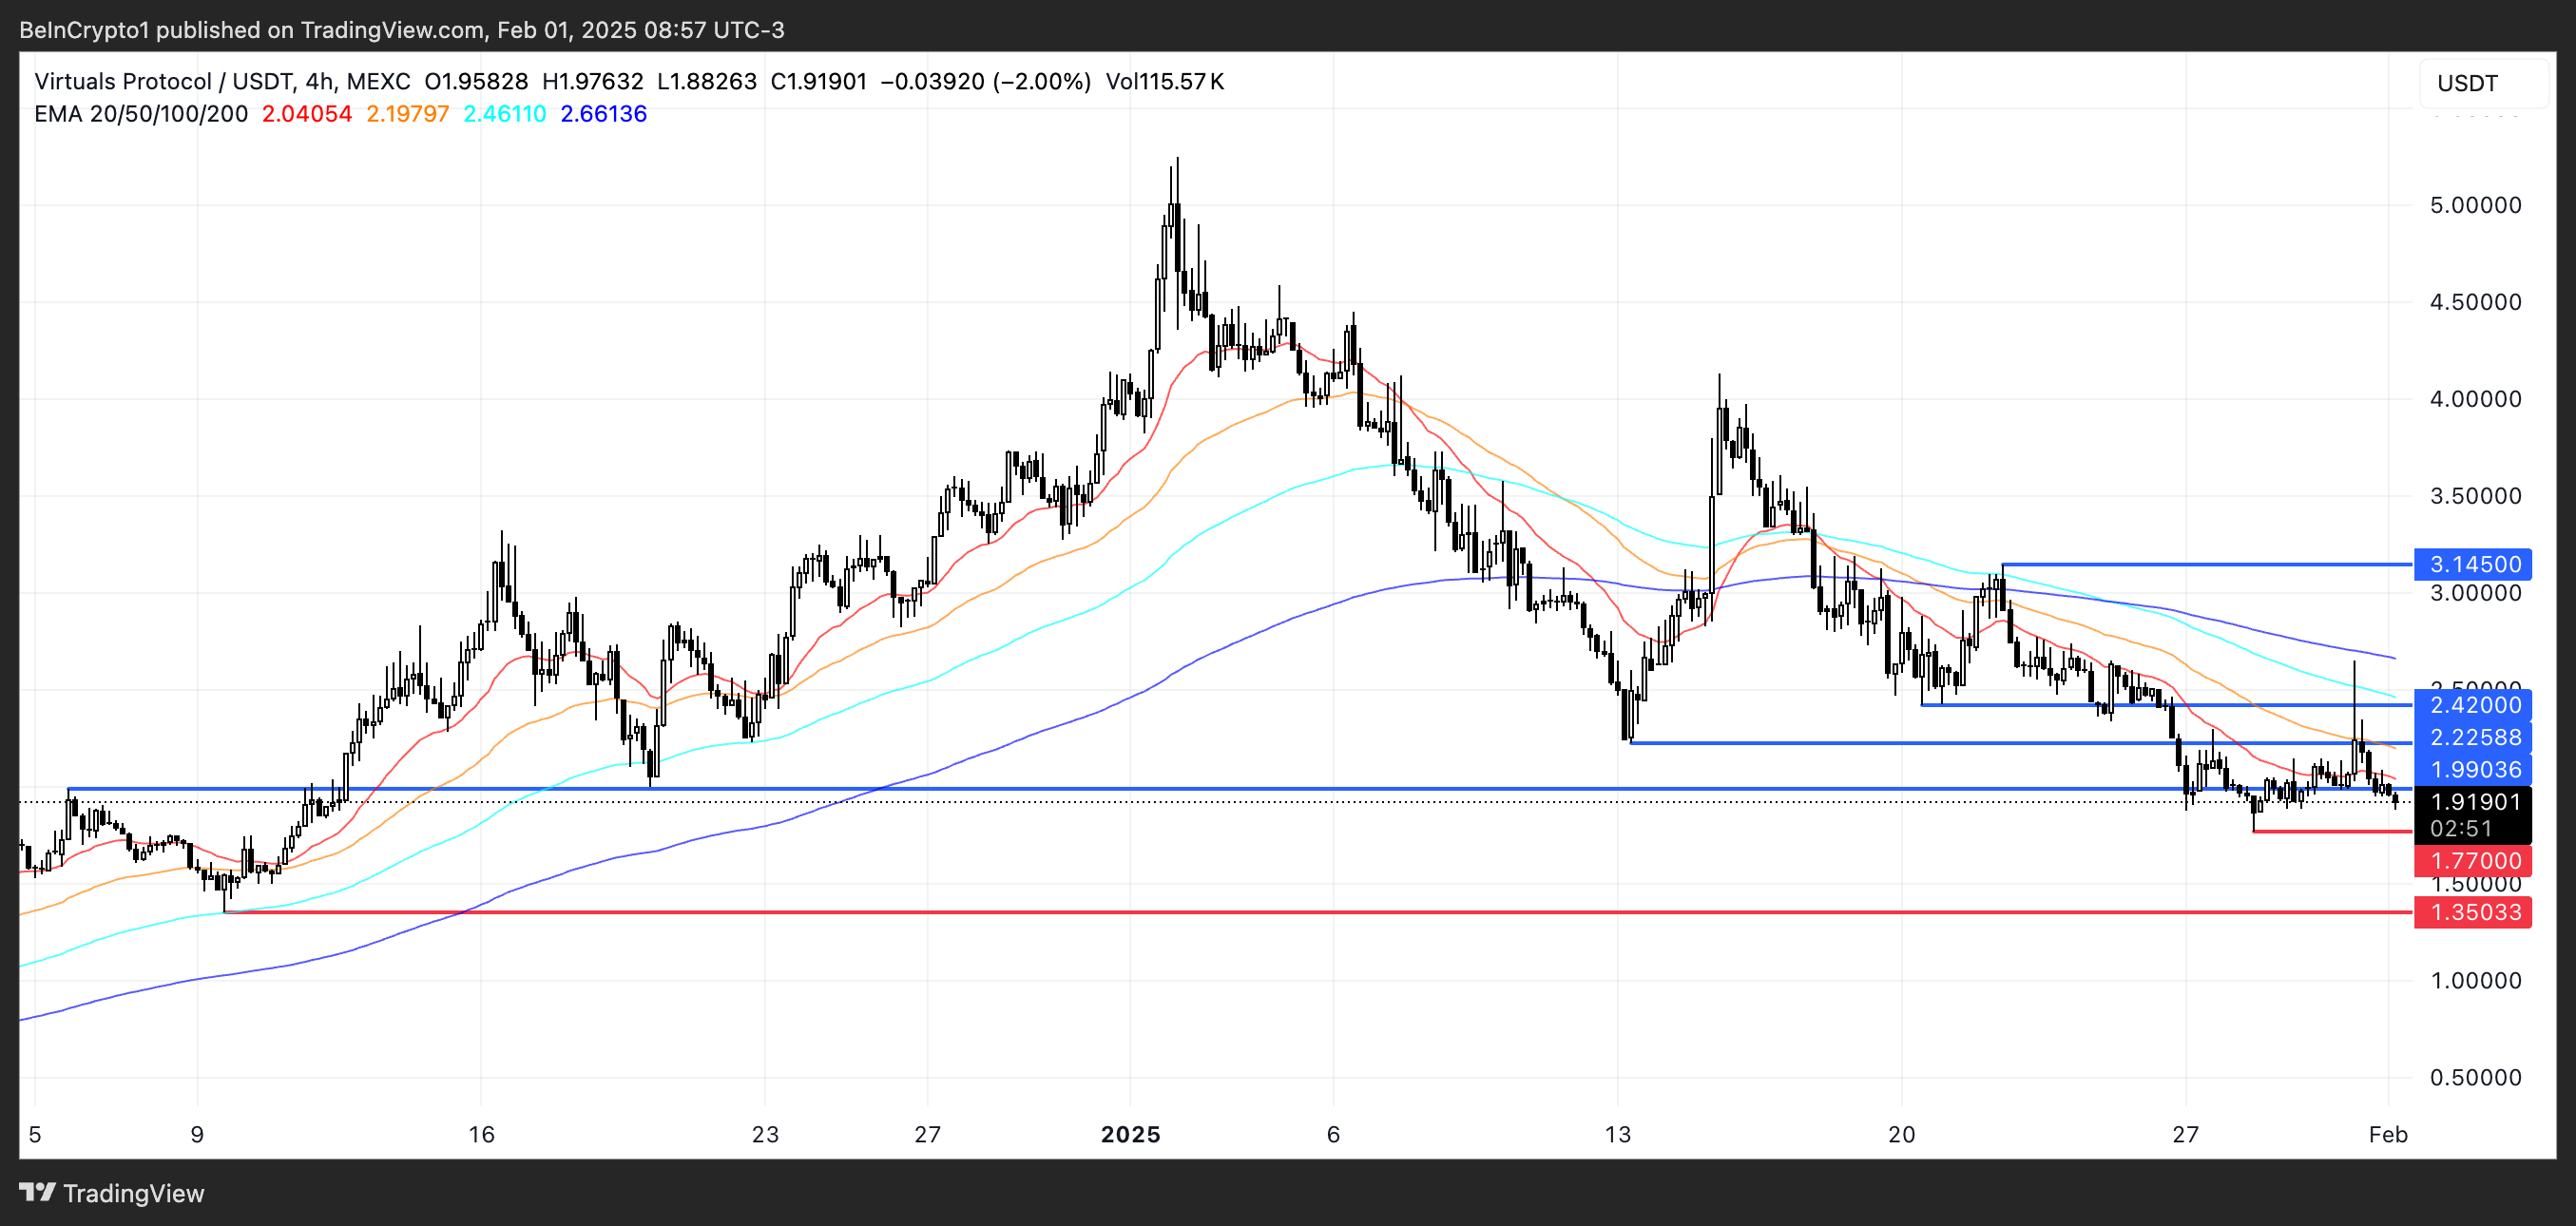
On the other hand, if support at $1.77 fails, VIRTUAL price could extend its downtrend, with $1.35 as the next major level to watch.
This would mark its lowest price since December 9, 2024, reinforcing bearish sentiment and making VIRTUAL even more distant from other AI coins, such as RENDER, FET, and TAO, in market cap.
Disclaimer
In line with the Trust Project guidelines, this price analysis article is for informational purposes only and should not be considered financial or investment advice. BeInCrypto is committed to accurate, unbiased reporting, but market conditions are subject to change without notice. Always conduct your own research and consult with a professional before making any financial decisions. Please note that our Terms and Conditions, Privacy Policy, and Disclaimers have been updated.