
Market
This is Why Retail Investors Are Ditching Crypto

Retail investors are currently displaying notable caution toward the crypto market. This behavior contrasts with past cycles when their involvement significantly influenced market trends.
Understanding the reasons behind this hesitance is crucial for predicting future market movements.
Retail Investors Are Not Here Yet
Retail investors are showing reluctance to engage with the crypto market, a trend that experts say may impact the market’s trajectory. Gustavo Faria, co-founder of Nosy, highlights key metrics indicating that retail participation remains low.
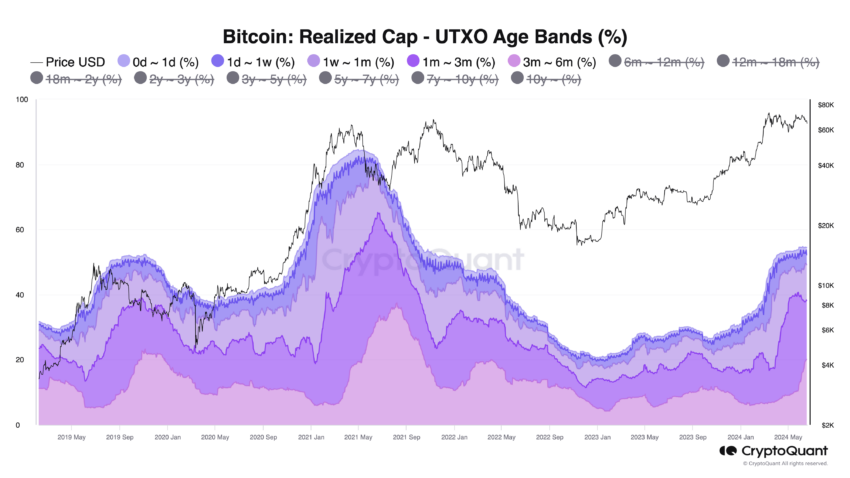
“A central characteristic of Bitcoin cycle tops is the dominance of coins with a holding period of less than 3 months,” says Faria.
Currently, short-term holders account for about 35% of the realized cap, compared to over 70% during previous market peaks. This suggests that long-term Bitcoin holders, often termed “smart money,” are maintaining their positions, providing a more stable market foundation.
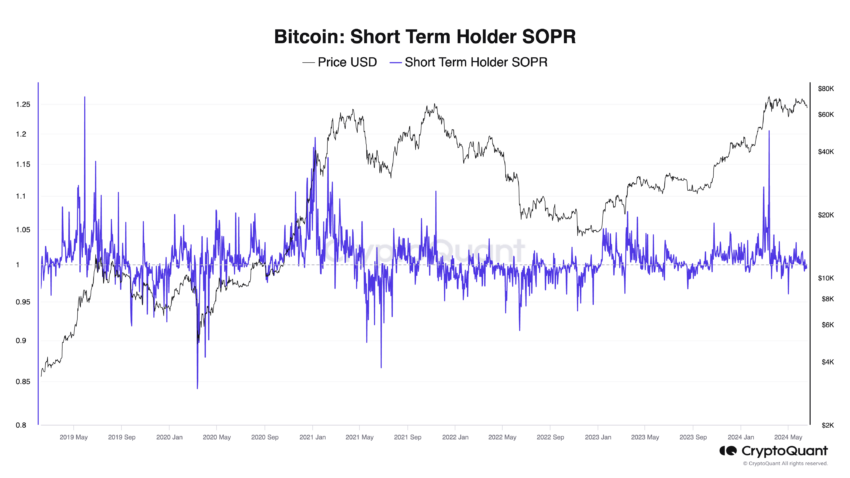
Historically, the Spent Output Profit Ratio (SOPR) of short-term holders has surpassed 1.10 during market peaks. In this cycle, the highest SOPR recorded was 1.05, indicating a more neutral market stance.
“This structure suggests that we have not yet reached the peak euphoria of this cycle,” Faria adds.
He believes the current market is strong, reducing the likelihood of an immediate transition to a bear market and signaling potential for further growth.
Read more: Bitcoin (BTC) Price Prediction 2024 / 2025 / 2030
Moreover, Anthony Sassano, an independent Ethereum educator, notes the peculiar nature of the current bull market, calling it the “weirdest ever.” He points out that the expected four-year cycle appears disrupted, with market behavior driven by crypto natives rather than retail investors.
Sassano highlights the absence of broad market growth, typically fueled by retail participation.
“Retail and new money were and are still not here – it’s all just crypto natives doing max PvP,” he observes.
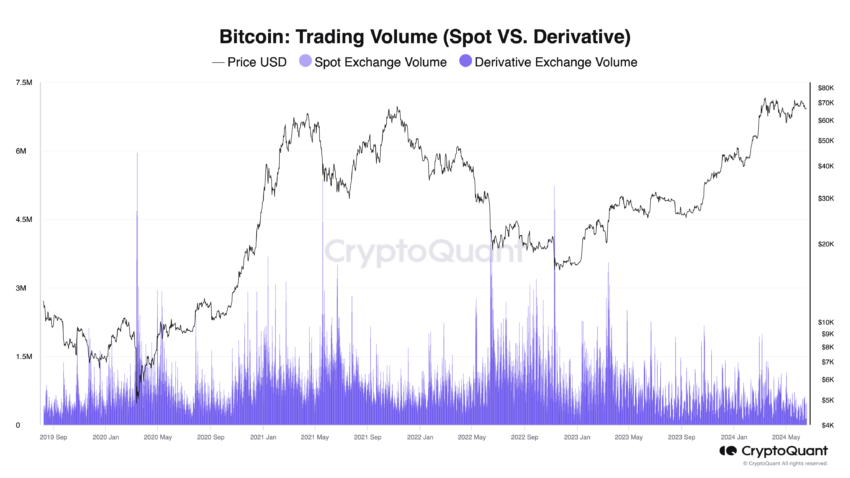
Adding to this perspective, crypto analyst Cyclop emphasizes the absence of retail enthusiasm. He points out that current trading volumes are significantly lower than those in 2021, despite Bitcoin’s higher price.
Cyclop suggests that this lack of retail involvement means the market has not yet reached the speculative frenzy seen in previous cycles.
“Normies are still not in crypto. My friends aren’t messaging me on WhatsApp. My mom doesn’t know that Bitcoin is at all-time highs,” he comments.
These insights suggest that retail investors are cautious, possibly due to the crypto market’s volatility. This hesitance, combined with the current market dynamics dominated by seasoned crypto participants, could limit the market’s growth potential.
Disclaimer
In adherence to the Trust Project guidelines, BeInCrypto is committed to unbiased, transparent reporting. This news article aims to provide accurate, timely information. However, readers are advised to verify facts independently and consult with a professional before making any decisions based on this content. Please note that our Terms and Conditions, Privacy Policy, and Disclaimers have been updated.


XRP is up 22% in the past seven days, with its price reclaiming ground above the $2 mark for the first time in months. The rally has sparked renewed interest, with technical indicators flashing signs of both strength and caution.
Momentum has cooled slightly, as shown by the RSI pulling back from near-overbought levels, but the broader setup remains bullish.
XRP RSI Has Cooled After Nearing Overbought Levels
XRP’s Relative Strength Index (RSI) is currently at 60.5, marking a notable cooldown from yesterday’s 67.8.
This comes after a sharp rise from 34.7 just six days ago, indicating that XRP recently went from oversold conditions to near-overbought levels before pulling back.
The move suggests a rapid shift in momentum that may now be stabilizing, potentially reflecting short-term profit-taking after a strong rally.

The RSI is a momentum oscillator that measures the speed and change of price movements, typically on a scale of 0 to 100.
Readings below 30 are considered oversold, suggesting potential undervaluation or exhaustion in selling pressure, while readings above 70 indicate overbought conditions, often signaling a possible correction or slowdown.
With XRP’s RSI now at 60.5, it sits in a neutral-to-bullish zone.
This level may suggest that while the recent bullish momentum has cooled, there could still be room for upside if buying interest resumes — but it also means the asset is no longer in an ideal “undervalued” zone for fresh entries.
XRP Ichimoku Cloud Shows a Bullish Setup
The Ichimoku Cloud for XRP currently shows a bullish setup, with the price positioned above both the blue conversion line (Tenkan-sen) and the red base line (Kijun-sen).
This alignment indicates that short-term and medium-term momentum remains in favor of the bulls. The leading span A (green cloud boundary) is above leading span B (red cloud boundary), forming a green cloud ahead—a classic sign of a bullish trend continuation.
Moreover, the price has stayed above the cloud for several sessions, reinforcing the positive momentum.
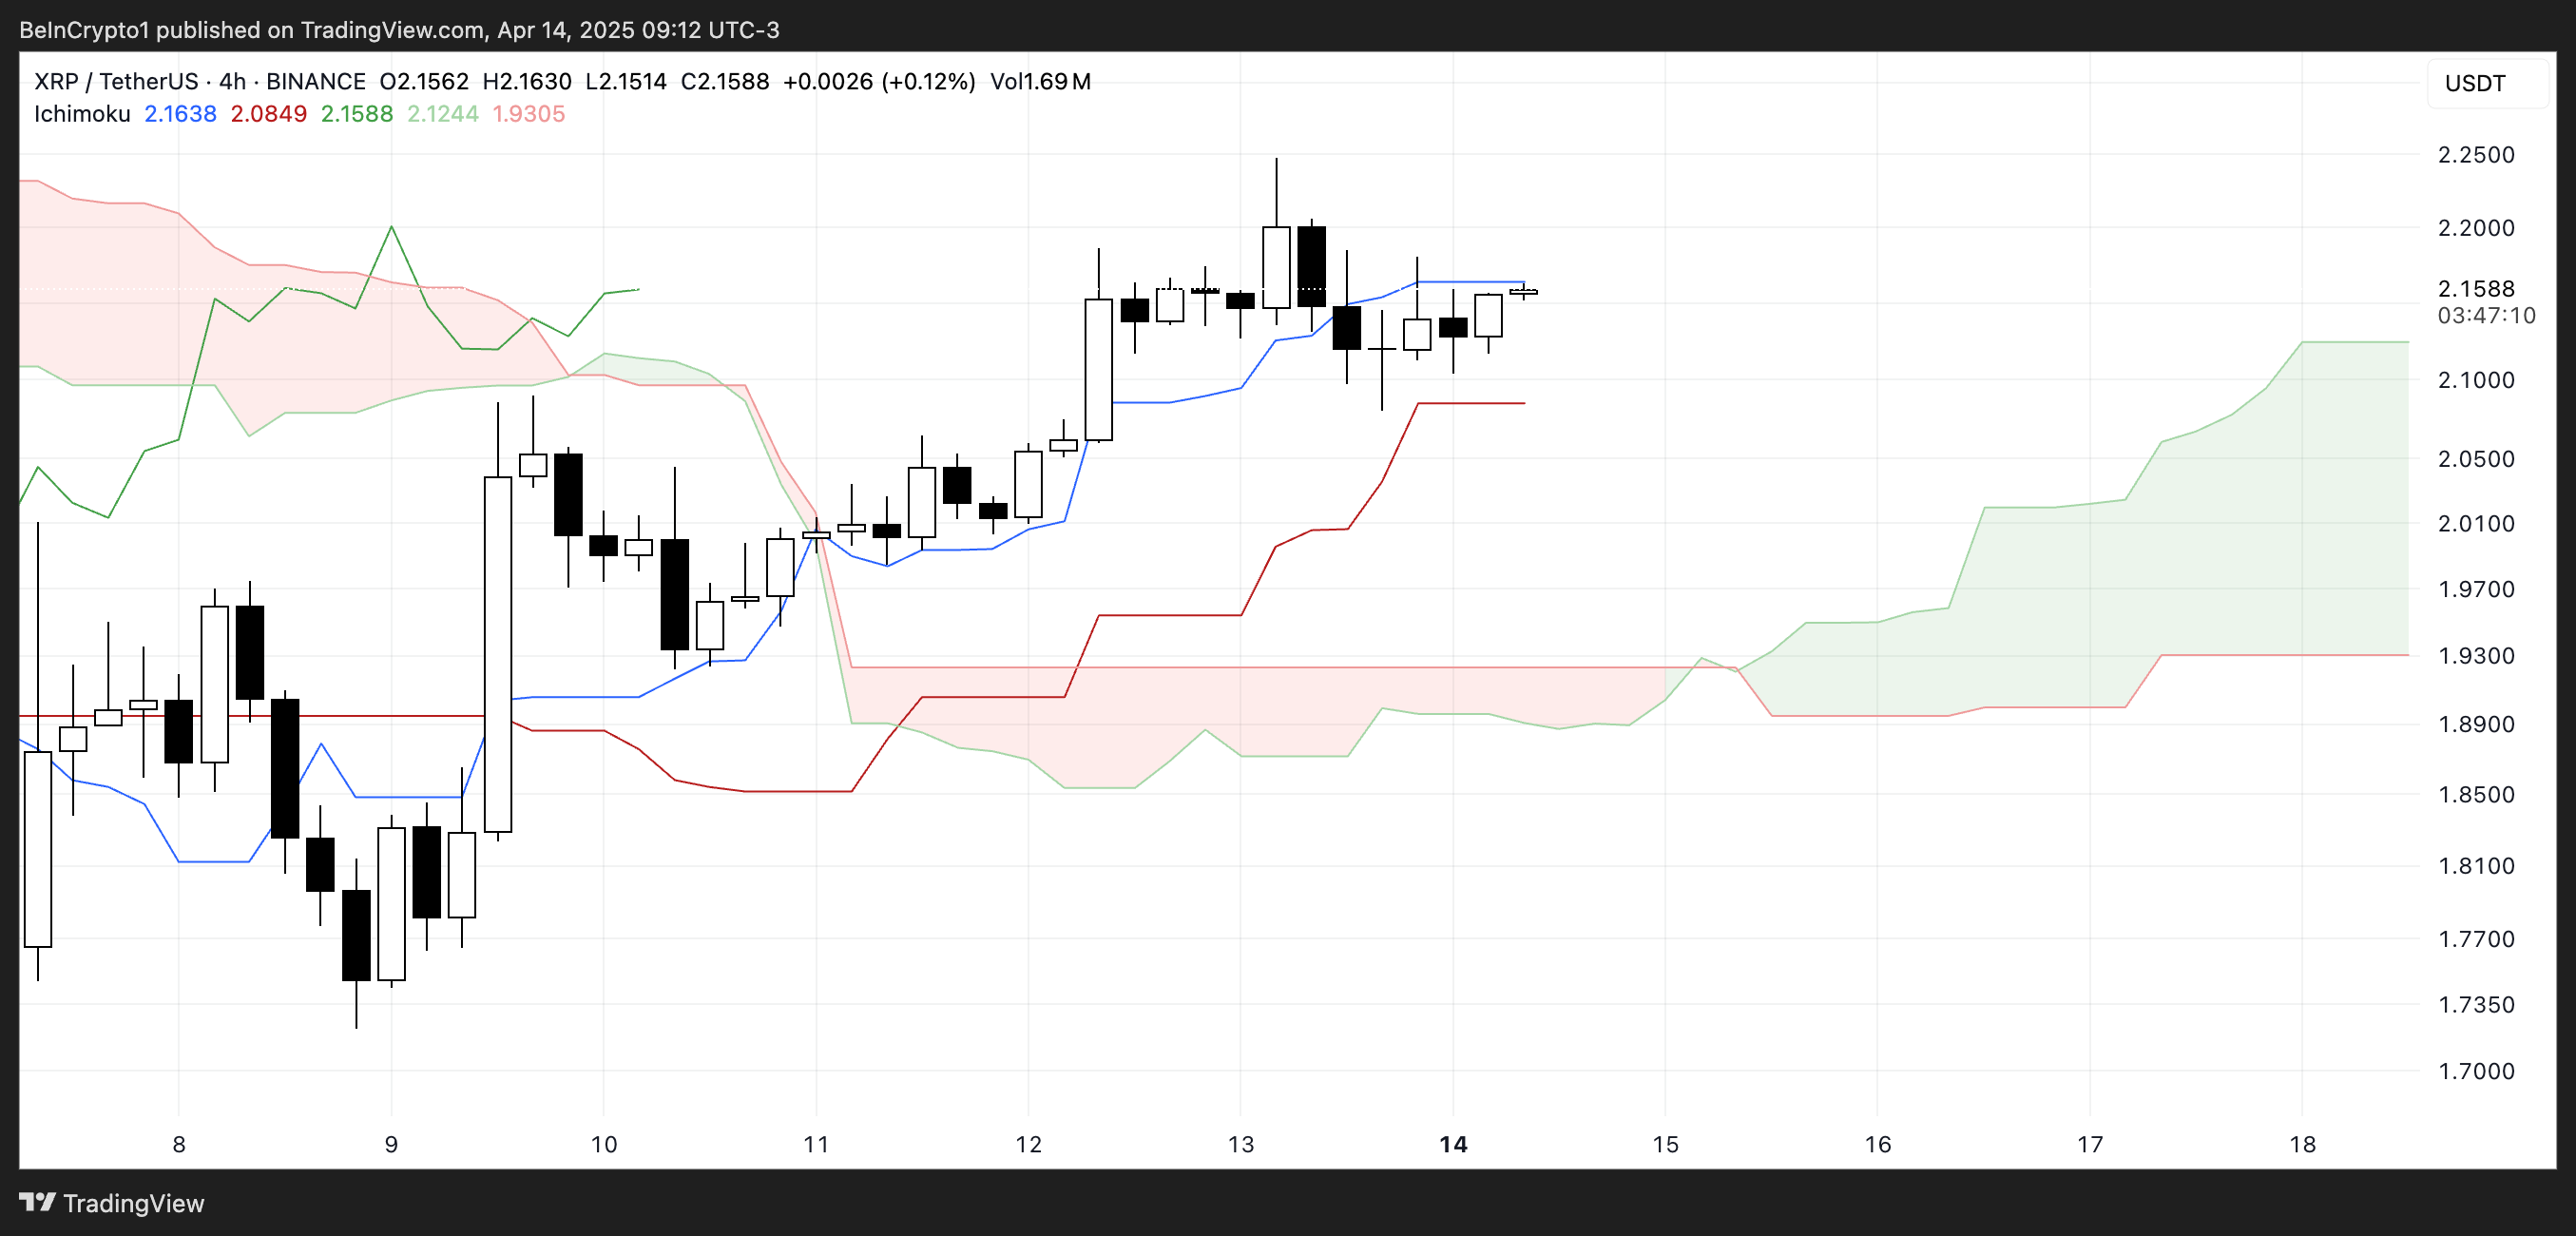
However, the narrowing gap between the Tenkan-sen and Kijun-sen, along with the flatlining of both lines, suggests that bullish momentum may be pausing or weakening in the short term.
If the price continues to consolidate sideways while staying above the cloud, it may indicate a healthy consolidation before a potential continuation higher.
But a drop below the Kijun-sen could trigger caution, as it would suggest a shift in momentum. For now, the overall cloud structure remains supportive of a bullish bias unless a deeper pullback pushes the price back into or below the cloud.
Will XRP Rise To Test $2.50 Soon?
XRP’s EMA lines are tightening, hinting at a potential golden cross formation — a bullish signal that occurs when the short-term EMA crosses above the long-term EMA.
This setup often marks the beginning of an upward trend, especially when supported by strong volume and positive momentum.
If the Golden Cross confirms, it could act as a catalyst for the XRP price to push toward higher resistance levels. The next key area to watch is around $2.23.
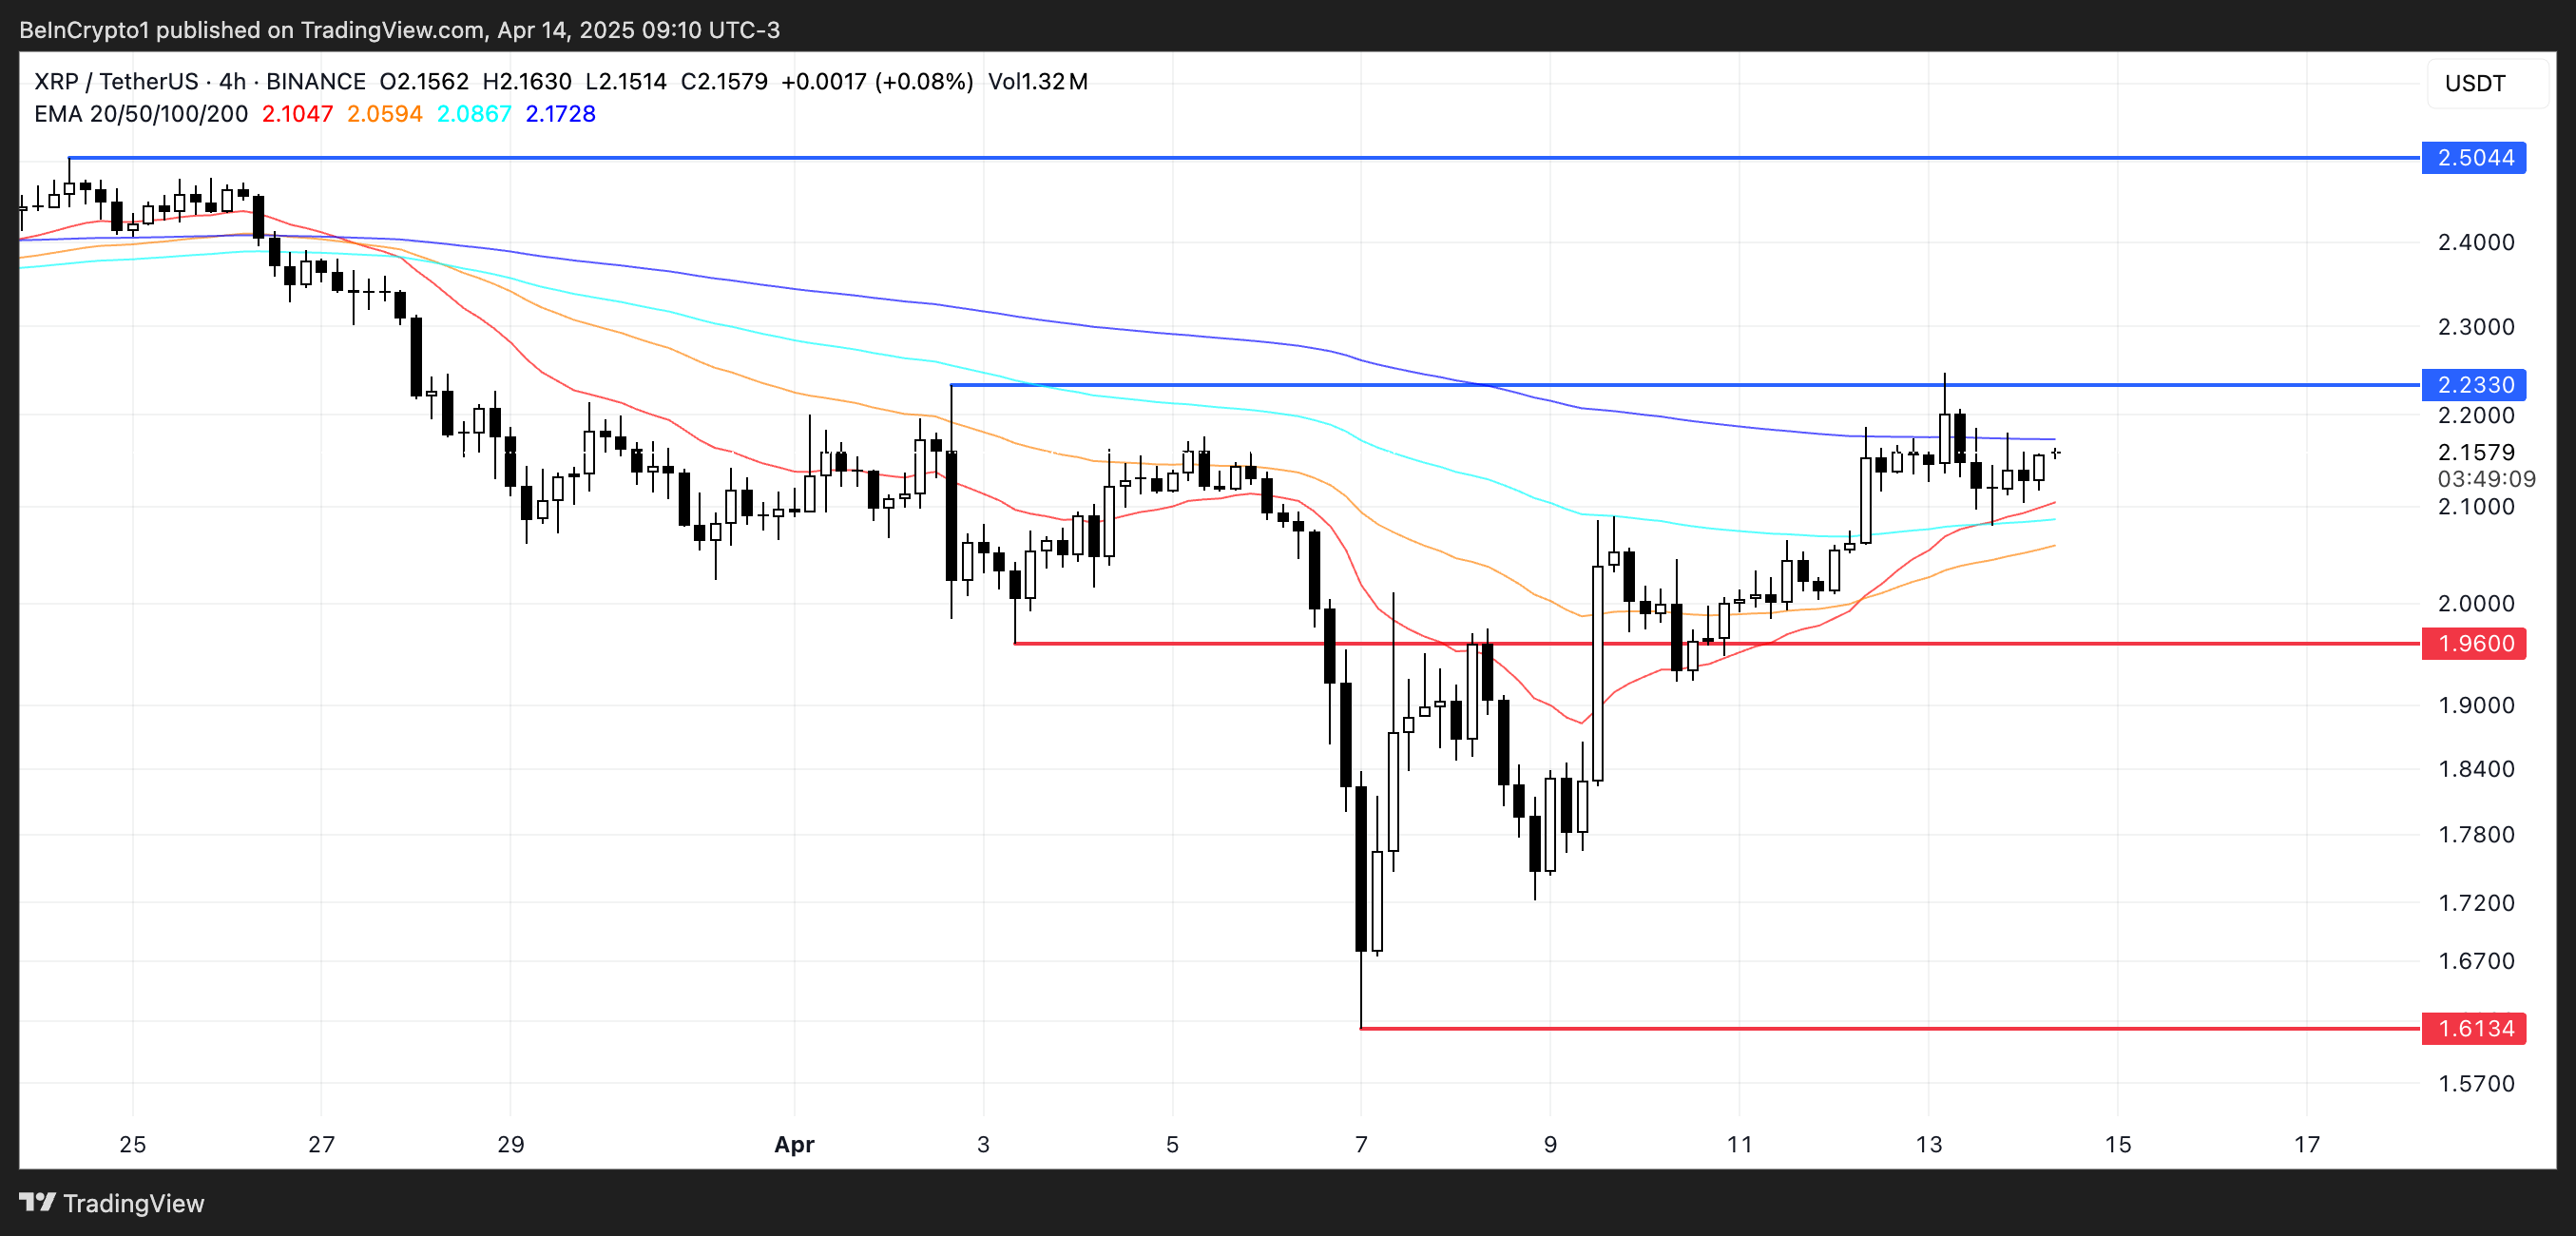
A clean breakout above that level could open the path toward $2.50, as bullish traders gain confidence.
However, the momentum needs to hold. If buying pressure fades and XRP fails to sustain its climb, a pullback could occur, with $1.96 acting as the first key support to monitor.
A breakdown below this level could shift sentiment bearish in the short term, potentially dragging the price down toward $1.61.
Disclaimer
In line with the Trust Project guidelines, this price analysis article is for informational purposes only and should not be considered financial or investment advice. BeInCrypto is committed to accurate, unbiased reporting, but market conditions are subject to change without notice. Always conduct your own research and consult with a professional before making any financial decisions. Please note that our Terms and Conditions, Privacy Policy, and Disclaimers have been updated.
Cardano (ADA) is up 10% over the past seven days, with its market cap reaching $23 billion and daily trading volume approaching $700 million. This surge in momentum has brought renewed attention to ADA, as key indicators begin to align in favor of a potential breakout.
The ADX has crossed the crucial threshold signaling trend strength, and whale activity is showing early signs of recovery after hitting a yearly low. With a golden cross formation also on the horizon, ADA could be gearing up for its next major move.
Cardano ADX Shows The Uptrend Could Get Stronger
Cardano’s ADX (Average Directional Index) has climbed to 25.97, rising sharply from 17.41 just two days ago. This significant uptick suggests that ADA’s price action is gaining strength, with early signs pointing toward a developing uptrend.
The increase in ADX reflects growing momentum behind the recent moves. That potentially signals that the asset is transitioning out of a low-volatility consolidation phase into a more directional trend.

The ADX is a technical indicator used to measure the strength—not direction—of a trend, typically on a scale from 0 to 100.
Readings below 20 indicate a weak or non-existent trend, while values above 25 suggest a strengthening trend. With ADA’s ADX now at 25.97, the indicator has crossed the key threshold that separates choppy, indecisive price action from a more structured directional move.
This shift could mean that Cardano is in the early stages of a sustained uptrend, especially if supported by rising volume and other bullish signals in the coming sessions.
ADA Whales Are Buying Again
The number of Cardano whale addresses—those holding between 1 million and 10 million ADA—fell steadily from April 6 to April 12, dropping from 2,418 to 2,384. That market its lowest level since February 2023.
However, a slight rebound occurred yesterday, with the count rising modestly to 2,389.
While this uptick may hint at renewed accumulation, the overall number remains significantly lower compared to recent weeks, suggesting that major holders are still showing caution.

Tracking whale activity is crucial because these large holders can exert considerable influence over price movements due to the sheer size of their positions.
A steady decline in whale wallets typically indicates reduced confidence or profit-taking. On the other hand, an increase can signal accumulation and potential upward pressure on price. Although the latest rebound in ADA whale numbers is a positive sign, the total remains relatively subdued.
This could mean that, despite ADA’s attempts to form an uptrend, large players are not yet fully convinced of its sustainability. This would limit the strength of any immediate breakout unless more whale accumulation follows.
Cardano Could Form A Golden Cross Soon
Cardano’s EMA lines are gradually aligning in a way that suggests a potential golden cross could form soon.
If this crossover is confirmed, it may give Cardano price the momentum needed to test resistance around $0.709.
A successful breakout at that level could push the price higher toward the next target at $0.77.

However, Cardano remains in a delicate position, currently trading just above two nearby support levels at $0.629 and $0.61. If either of these levels is tested and lost, it could invalidate the bullish setup and trigger renewed selling pressure.
A breakdown below both supports would likely reverse the current momentum, with ADA potentially sliding toward $0.51.
Disclaimer
In line with the Trust Project guidelines, this price analysis article is for informational purposes only and should not be considered financial or investment advice. BeInCrypto is committed to accurate, unbiased reporting, but market conditions are subject to change without notice. Always conduct your own research and consult with a professional before making any financial decisions. Please note that our Terms and Conditions, Privacy Policy, and Disclaimers have been updated.

The crypto market’s volatility continues, compounded by the absence of bullish signals from broader financial markets. While altcoins are becoming less dependent on external developments, they are increasingly relying on internal network progress to drive price movement.
BeInCrypto has analyzed three altcoins to watch, focusing on whether key events could trigger a price shift in the third week of April.
Filecoin (FIL)
FIL price has bounced off the support of $2.26, currently trading at $2.50. This rebound follows the altcoin’s 27% decline at the end of March, and traders are anticipating a recovery. The support level of $2.26 has proven crucial in halting further losses and enabling a potential uptrend.
Upcoming developments, such as the FIP 0097 proposal, could further boost FIL’s price. The transition to FEVM supporting transient storage and aligning with Ethereum’s EIP-1153 promises cleaner contracts, lower costs, and better compatibility. These improvements could drive FIL past the $2.63 resistance level, potentially reaching $2.99.

If FIL fails to break through the $2.63 barrier, the altcoin may fall back to $2.26. Losing this key support would invalidate the bullish outlook, risking a further drop to $2.00. Investors will closely monitor these levels for signs of a reversal or continued decline.
EigenLayer (EIGEN)
Another one of the key altcoins to watch before April ends, the EIGEN price is poised to breach the $0.86 resistance this week, driven by the upcoming Slashing upgrade. The upgrade will introduce a free marketplace where Operators can earn rewards for their work, and AVSs can launch verifiable services.
If EIGEN capitalizes on the momentum from the Slashing upgrade, it could surpass the $0.86 and $0.92 resistance levels. With continued upward movement, the altcoin could reach $1.00 and beyond. Investors are closely monitoring the effects of this update on price performance.
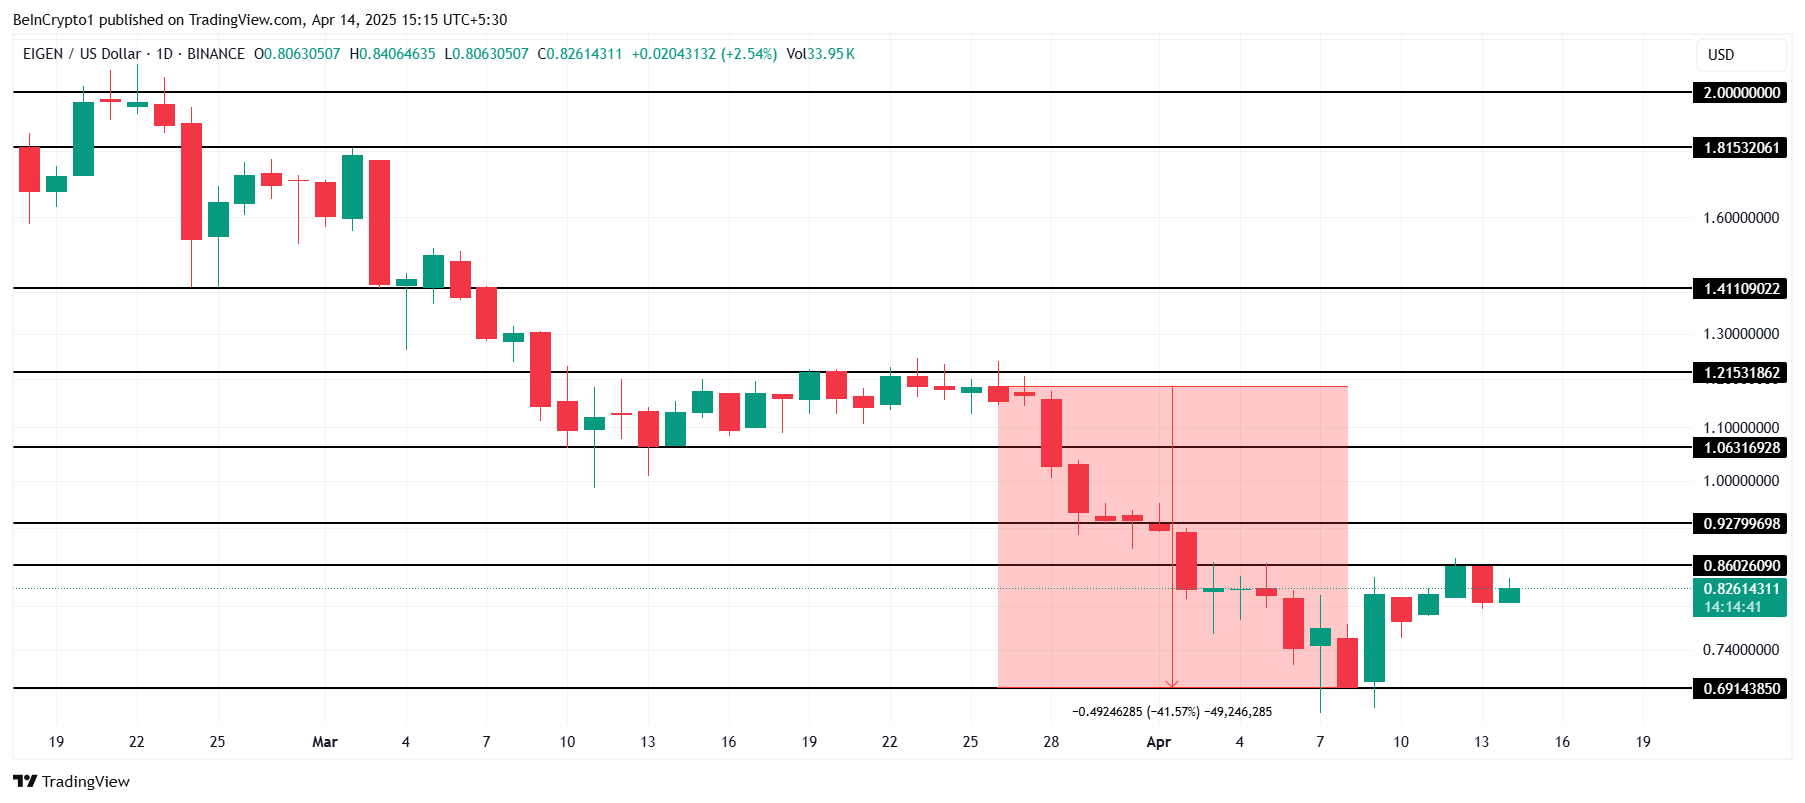
However, if EIGEN fails to breach $0.86, the price may fall back to the support level of $0.69. This would invalidate the bullish outlook and delay the recovery from the 41.5% losses incurred at the end of March.
OFFICIAL TRUMP (TRUMP)
TRUMP price recently hit an all-time low of $7.14 but has since recovered to $8.33. Despite this recovery, the likelihood of a continued rally is uncertain due to the upcoming token unlock on April 18. This event could create additional selling pressure on the altcoin in the coming days.
The first token unlock in three months, set to release 40 million TRUMP worth $331 million, will flood the market. This unlock will also initiate the daily release of 492,000 TRUMP tokens. Investors are concerned that this increased supply may further weigh on the price.
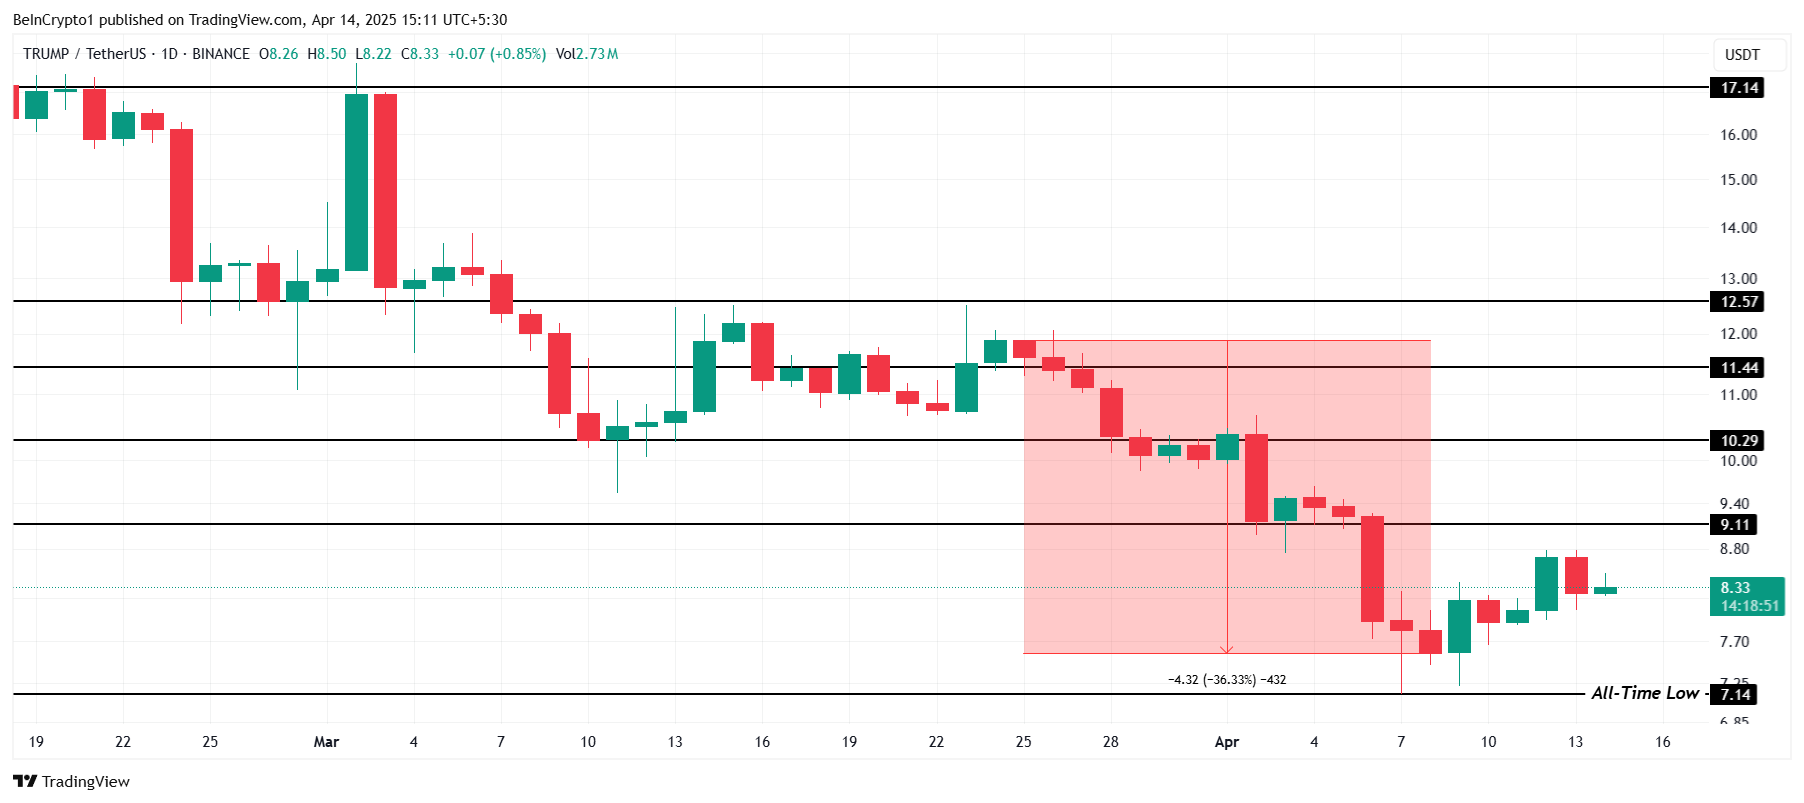
The surge in supply could prove bearish for TRUMP, which is already facing low demand. This may push the price back down to $7.14 or lower, potentially creating a new all-time low. However, if the price breaches $9.11, the bearish outlook would be invalidated, and recovery could occur.
Disclaimer
In line with the Trust Project guidelines, this price analysis article is for informational purposes only and should not be considered financial or investment advice. BeInCrypto is committed to accurate, unbiased reporting, but market conditions are subject to change without notice. Always conduct your own research and consult with a professional before making any financial decisions. Please note that our Terms and Conditions, Privacy Policy, and Disclaimers have been updated.

XRP Jumps 22% in 7 Days as Bullish Momentum Builds

Ethereum Price Threatened With Sharp Drop To $1,400, Here’s Why

Cardano (ADA) Eyes Rally as Golden Cross Signals Momentum

3 Altcoins to Watch in the Third Week of April 2025

Tether Deploys Hashrate in OCEAN Bitcoin Mining Pool

Canada Approves Multiple Spot Solana ETFs To Launch This Week


-
 Altcoin22 hours ago
Mantra Team Responds As The OM Token Price Crashes Over 80% In 24 Hours
-

 Market14 hours ago
Bitcoin’s Price Under $85,000 Brings HODlers Profit To 2-Year Low
-

 Market20 hours ago
MANTRA’s OM Token Crashes 90% Amid Insider Dump Allegations
-
 Altcoin9 hours ago
XRP Price Climbs Again, Will XRP Still Face a Death Cross?
-
 Altcoin8 hours ago
Analyst Predicts Dogecoin Price Rally To $0.29 If This Level Holds
-

 Market11 hours ago
XRP Outflows Cross $300 Million In April, Why The Price Could Crash Further
-

 Market10 hours ago
FLR Token Hits Weekly High, Outperforms Major Coins
-

 Bitcoin9 hours ago
Crypto Outflows Hit $795 Million On Trump’s Tariffs & Market Fear
 Arabic
 Chinese (Simplified)
 Dutch
Dutch English
 French
 German
 Italian
 Portuguese
 Russian
 Spanish
 Vietnamese