
Market
This Crypto Analyst Correctly Predicted XRP Price Crash Below $2, Here’s The Rest Of The Forecast

Reason to trust
![]()
Strict editorial policy that focuses on accuracy, relevance, and impartiality
Created by industry experts and meticulously reviewed
The highest standards in reporting and publishing
Strict editorial policy that focuses on accuracy, relevance, and impartiality
Morbi pretium leo et nisl aliquam mollis. Quisque arcu lorem, ultricies quis pellentesque nec, ullamcorper eu odio.
A new XRP price forecast has emerged, offering insights into the cryptocurrency’s next bearish move. A crypto analyst who previously predicted XRP‘s crash below $2 has provided a more comprehensive outlook, outlining key support and resistance areas that will determine XRP’s next target.
According to TradingView crypto analyst, ‘MMBTrader,’ the XRP price is set to dump below the $2 threshold. As of writing, CoinMarketCap reports that XRP is trading at $2.2, reflecting a modest 3% increase in value in the last 24 hours.
XRP Price Projected To Crash To $1.5
Related Reading
The TradingView crypto expert has identified a Head and Shoulder pattern on the XRP daily chart, consisting of three peaks: left shoulder, head, and right shoulder. Typically, a classic Head and Shoulder pattern is considered one of the most common indicators of a potential price breakdown, with the price of a cryptocurrency expected to reverse from bullish to bearish.
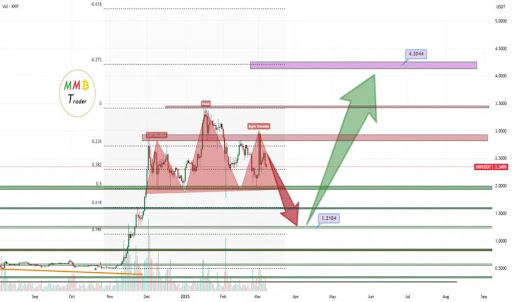
Looking at the price chart, a break below the pattern’s neckline around the $1.95 price point would confirm XRP’s bearish position. If the cryptocurrency fails to hold the $1.95 support level, a sharp drop, possibly up to 50%, is expected. This massive crash would effectively place the price around the $1.5 level or even as low as $1.2.
While he expects a possible crash to $1.5, MMBTrader also projects an alternative bullish scenario in which the XRP price initiates a strong rebound. The analyst revealed that if the cryptocurrency consolidates near $2 without breaking lower, then a bounce to new highs could follow.
Additionally, the TradingView expert believes that the asset could also experience a significant rally toward $5 after its projected 50% price crash. He highlights that if XRP can hold the support level near $1.5, then a strong reversal could occur, potentially triggering a bullish move between $4 and $4.5.
Whales Scoop Up $385 Million Amid Market Downtrend
While XRP experiences slow momentum due to the market’s recent decline, whales are seizing the opportunity to buy the dip, accumulating a significant amount of the token. According to crypto analyst Brett, an XRP whale has executed a large-scale transaction, buying over 167 million XRP, valued at $368.4 million, in a single purchase.
Related Reading
Brett revealed that this whale purchase was made as the market panicked over increasing volatility and price declines. Over the past few weeks, XRP has struggled to recover from bearish trends, joining the ranks of top cryptocurrencies like Bitcoin and Ethereum, which recorded a major price crash earlier in February.
CoinMarketCap’s data shows that the the altcoin’s price has fallen by 11.6% in just one week. This decline comes as the broader crypto market faces massive liquidations totaling hundreds of millions of dollars.
Featured image from Adobe Stock, chart from Tradingview.com


- US Bitcoin ETFs collectively manage $115 billion in assets
- Since mid-February, Bitcoin ETFs have witnessed total outflows of nearly $5 billion
- Bitcoin’s decline continues as selling pressure intensifies
Even as Bitcoin’s price has tumbled 25% since the start of 2025, a staggering 95% of investors in US spot Bitcoin ETFs have held firm, resisting the urge to sell.
Despite market volatility and macroeconomic uncertainties, Bloomberg data suggests that the overwhelming majority of ETF holders remain unfazed, showcasing strong conviction in Bitcoin’s long-term potential.
Bitcoin ETFs show resilience
Bloomberg ETF strategist James Seyffart reported that inflows into Bitcoin ETFs have slightly declined to $35 billion, down from their $40 billion peak.
However, this still represents over 95% of investor capital remaining in ETFs, even as Bitcoin’s price struggles.
Institutional investors, including Goldman Sachs, continue to maintain significant exposure, with more than $1.5 billion invested in Bitcoin ETFs.
As of now, US Bitcoin ETFs collectively manage $115 billion in assets, underscoring the staying power of both retail and institutional investors despite the crypto market downturn.
Bitcoin ETF outflows persist
Since mid-February, Bitcoin ETFs have witnessed total outflows of nearly $5 billion.
On March 13 alone, outflows reached $135 million, according to Farside Investors.
However, BlackRock’s iShares Bitcoin Trust (IBIT) remains an exception, attracting net inflows of $45.7 million amid the broader sell-off.
Bitcoin price faces pressure
Bitcoin’s decline continues as selling pressure intensifies due to macroeconomic concerns, including the Trump administration’s ongoing tariff battle.
While BTC briefly surged above $84,000 following the release of US CPI data on Wednesday, it failed to hold above key resistance levels.
At press time, Bitcoin is trading at $81,953, down 1.56% on the day, with daily trading volume dropping 22% to under $30 billion.
According to Coinglass data, 24-hour liquidations have spiked to $75 million, with $52 million in long positions being wiped out.
CryptoQuant CEO Ki Young Ju noted that Bitcoin demand appears “stuck” at current levels but emphasized that it is still “too early to call it a bear market.”
Long-term Bitcoin holders continue accumulating
Despite Bitcoin ETF outflows, on-chain data reveals that long-term holders are accumulating more BTC.
Crypto analyst Ali Martinez reported that these investors have added over 131,000 BTC to their wallets in the past month alone, signaling confidence in Bitcoin’s long-term trajectory.
With Bitcoin’s price volatility and ETF outflows persisting, the coming weeks could be crucial in determining whether investors’ diamond hands will hold firm or if selling pressure will intensify.

Reason to trust
![]()
Strict editorial policy that focuses on accuracy, relevance, and impartiality
Created by industry experts and meticulously reviewed
The highest standards in reporting and publishing
Strict editorial policy that focuses on accuracy, relevance, and impartiality
Morbi pretium leo et nisl aliquam mollis. Quisque arcu lorem, ultricies quis pellentesque nec, ullamcorper eu odio.
Bitcoin price started a recovery wave above the $80,500 zone. BTC is now rising and might aim for a move above the $84,000 and $85,000 levels.
- Bitcoin started a decent recovery wave above the $81,000 zone.
- The price is trading above $81,500 and the 100 hourly Simple moving average.
- There was a break below a short-term bullish trend line with support at $83,000 on the hourly chart of the BTC/USD pair (data feed from Kraken).
- The pair could start another increase if it clears the $82,500 and $84,000 levels.
Bitcoin Price Eyes Steady Increase
Bitcoin price remained stable above the $78,000 level. BTC formed a base and recently started a recovery wave above the $80,500 resistance level.
The bulls pushed the price above the $82,000 resistance level. However, the bears were active near the $84,000 resistance zone. A high was formed at $84,200 and the price corrected some gains. There was a move below the $83,000 level.
The price dipped below the 50% Fib retracement level of the upward move from the $76,818 swing low to the $84,200 high. Besides, there was a break below a short-term bullish trend line with support at $83,000 on the hourly chart of the BTC/USD pair.
Bitcoin price is now trading above $81,200 and the 100 hourly Simple moving average. On the upside, immediate resistance is near the $82,450 level. The first key resistance is near the $84,000 level. The next key resistance could be $85,000.

A close above the $85,000 resistance might send the price further higher. In the stated case, the price could rise and test the $86,500 resistance level. Any more gains might send the price toward the $88,000 level or even $96,200.
Another Drop In BTC?
If Bitcoin fails to rise above the $82,450 resistance zone, it could start a fresh decline. Immediate support on the downside is near the $80,500 level. The first major support is near the $79,600 level or the 61.8% Fib retracement level of the upward move from the $76,818 swing low to the $84,200 high.
The next support is now near the $78,500 zone. Any more losses might send the price toward the $77,000 support in the near term. The main support sits at $76,500.
Technical indicators:
Hourly MACD – The MACD is now gaining pace in the bullish zone.
Hourly RSI (Relative Strength Index) – The RSI for BTC/USD is now above the 50 level.
Major Support Levels – $80,500, followed by $79,600.
Major Resistance Levels – $82,450 and $84,000.

Reason to trust
![]()
Strict editorial policy that focuses on accuracy, relevance, and impartiality
Created by industry experts and meticulously reviewed
The highest standards in reporting and publishing
Strict editorial policy that focuses on accuracy, relevance, and impartiality
Morbi pretium leo et nisl aliquam mollis. Quisque arcu lorem, ultricies quis pellentesque nec, ullamcorper eu odio.
Ethereum price started a recovery wave above the $1,820 zone. ETH is now consolidating and facing hurdles near the $1,950 resistance.
- Ethereum started a recovery wave above the $1,820 level.
- The price is trading below $1,920 and the 100-hourly Simple Moving Average.
- There is a short-term bearish trend line forming with resistance at $1,900 on the hourly chart of ETH/USD (data feed via Kraken).
- The pair must clear the $1,900 and $1,950 resistance levels to start a decent increase.
Ethereum Price Faces Resistance
Ethereum price formed a base above the $1,760 level and started a recovery wave, like Bitcoin. ETH was able to clear the $1,820 and $1,850 resistance levels.
The bulls pushed the price above the $1,920 level. There was a move above the 23.6% Fib retracement level of the downward wave from the $2,150 swing high to the $1,752 low. However, the bears seem to be active near the $1,950 resistance zone.
Ethereum price is now trading below $1,920 and the 100-hourly Simple Moving Average. On the upside, the price seems to be facing hurdles near the $1,900 level.
There is also a short-term bearish trend line forming with resistance at $1,900 on the hourly chart of ETH/USD. The next key resistance is near the $1,950 level or the 50% Fib retracement level of the downward wave from the $2,150 swing high to the $1,752 low.

The first major resistance is near the $1,990 level. A clear move above the $1,990 resistance might send the price toward the $2,050 resistance. An upside break above the $2,050 resistance might call for more gains in the coming sessions. In the stated case, Ether could rise toward the $2,120 resistance zone or even $2,250 in the near term.
Another Drop In ETH?
If Ethereum fails to clear the $1,950 resistance, it could start another decline. Initial support on the downside is near the $1,845 level. The first major support sits near the $1,800 zone.
A clear move below the $1,800 support might push the price toward the $1,750 support. Any more losses might send the price toward the $1,720 support level in the near term. The next key support sits at $1,650.
Technical Indicators
Hourly MACD – The MACD for ETH/USD is gaining momentum in the bullish zone.
Hourly RSI – The RSI for ETH/USD is now above the 50 zone.
Major Support Level – $1,800
Major Resistance Level – $1,920

Dogecoin Price Nears Key Support as Analysts Predict Rally To $20

Bitcoin ETF investors hold strong despite a 25% BTC price drop: Here’s why

Bitcoin Price Steadies—Is a Meaningful Bounce on the Horizon?

Ethereum Price Consolidates and Eyes Recovery—Is a Bounce Incoming?
Ethereum Price Consolidates and Eyes Recovery—Is a Bounce Incoming?

XRP Price Hints At Symmetrical Triangle, But A Crash Could Come Before The Surge

2.52 Million Altcoins Are Ruining Crypto’s Future

Animoca Brands Valuation Tanks 75% In Two Years, Here’s Why

Crypto exchange BingX hacked for $43 million

Are The Big Players Losing Interest?

Hong Kong’s Securities Association Tips Authorities On Crypto Self-Regulation

Coinbase cbBTC Set to go Live on Solana
2.52 Million Altcoins Are Ruining Crypto’s Future
Animoca Brands Valuation Tanks 75% In Two Years, Here’s Why
Crypto exchange BingX hacked for $43 million
Are The Big Players Losing Interest?
Hong Kong’s Securities Association Tips Authorities On Crypto Self-Regulation
Coinbase cbBTC Set to go Live on Solana
-

 Ethereum23 hours ago
Ethereum Net Taker Volume Signals Huge Selling Pressure – Can Bulls Hold Key Levels?
-

 Market24 hours ago
Celestia TIA) Price Nears Consolidation After 31% Rally
-

 Market23 hours ago
Crypto Stocks Post Losses, But Bear Market Fears Diminish
-

 Altcoin17 hours ago
Dogecoin Price Closes Daily Candle With Lower Wick, Why Another Crash Could Be Coming
-
 Altcoin16 hours ago
Dogecoin Price Set For Massive Rebound After Indicators Call The Bottom
-

 Altcoin19 hours ago
Altcoins At Risk Of More Losses As Market Shifts Heavily Toward A Bitcoin Season
-

 Regulation19 hours ago
Ripple Secures DFSA License in the UAE
-
 Market16 hours ago
Stellar (XLM) Jumps 10% as Bulls Take Charge: What’s Next?