
Market
SPX Rallies, While TOSHI, PNUT Simmer

The crypto market had a rather stable week, with the leader, Bitcoin, safe from witnessing any sharp rise or fall. This extended to the meme coins as well, with the lack of volatility resulting in altcoins taking a direction.
BeInCrypto has analyzed three meme coins that took different directions as the market conditions improved.
Toshi (TOSHI)
TOSHI saw a 22% decline this week, but it managed to hold above the critical support level of $0.000331. This resistance has helped prevent further downside, though the ongoing bearish trend has put the meme coin under pressure.
If the bearish momentum continues, TOSHI risks falling below the $0.000331 support, potentially hitting $0.000194. A drop to this level would result in significant losses for investors and may signal deeper bearish sentiment in the market.
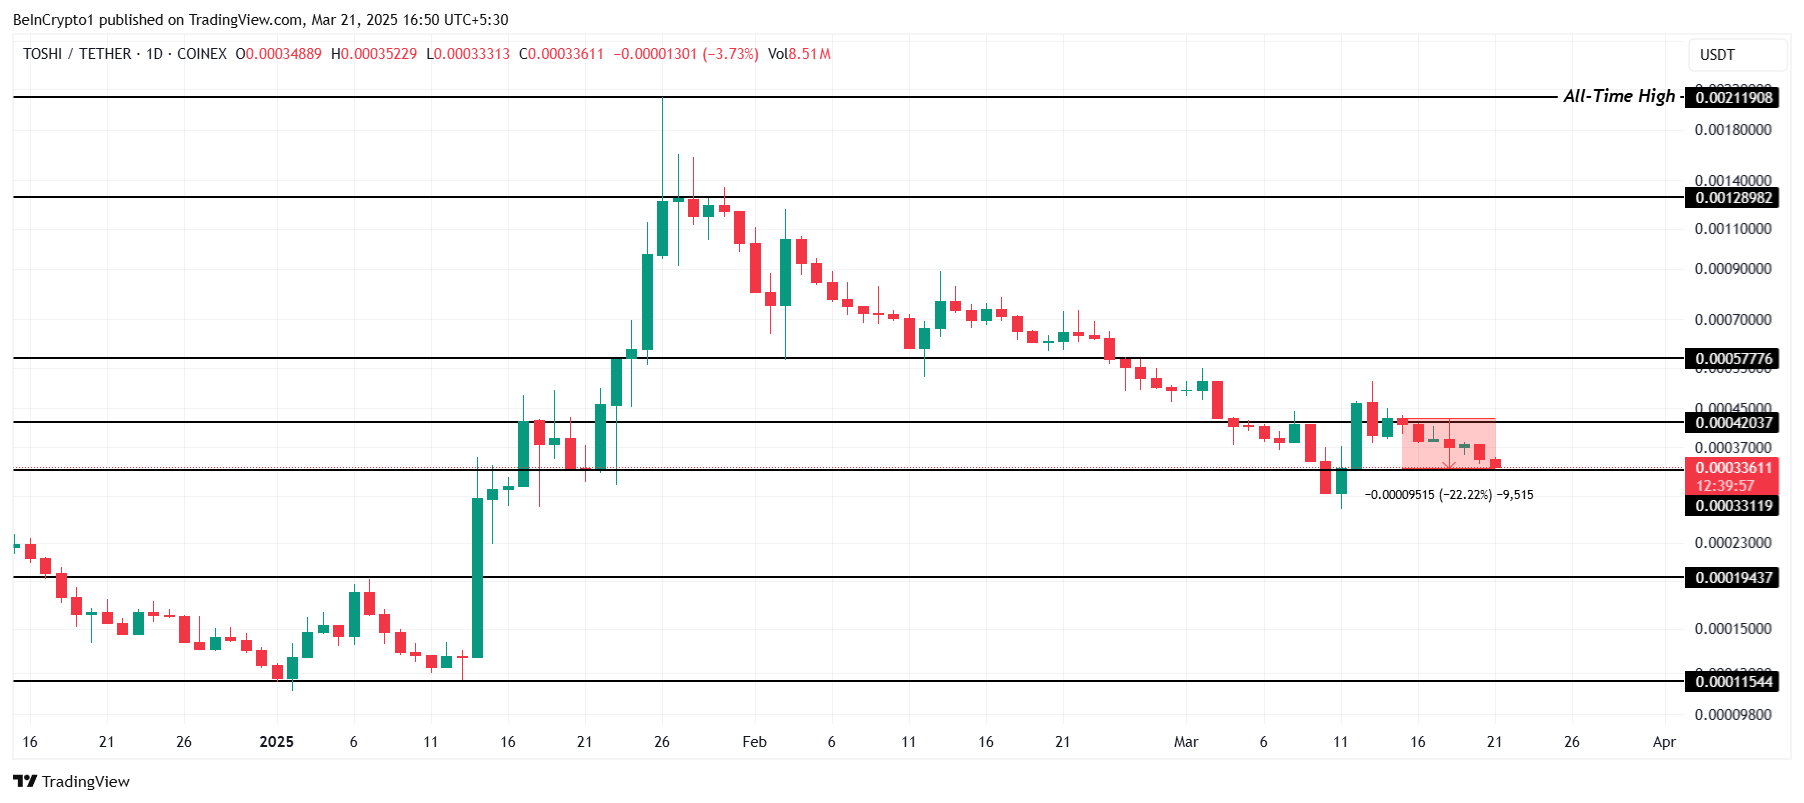
Should TOSHI manage to bounce off the $0.000331 support, a recovery toward $0.000420 is likely. A breach above $0.000420 could propel TOSHI towards $0.000577, indicating a potential rally. This positive price action would mark a shift in sentiment.
Peanut The Squirrel (PNUT)
PNUT has experienced minimal price movement, slipping by 4% over the last seven days to trade at $0.163. Unlike many altcoins, it neither saw a significant surge nor a sharp decline. The price action has remained relatively stable, reflecting the market’s cautious sentiment toward the meme coin.
There is a chance that PNUT could face further declines, potentially testing the support level at $0.152. If the price fails to hold this level, it could fall to $0.137. This would signal increased bearish pressure, making it difficult for PNUT to recover unless market conditions improve substantially.
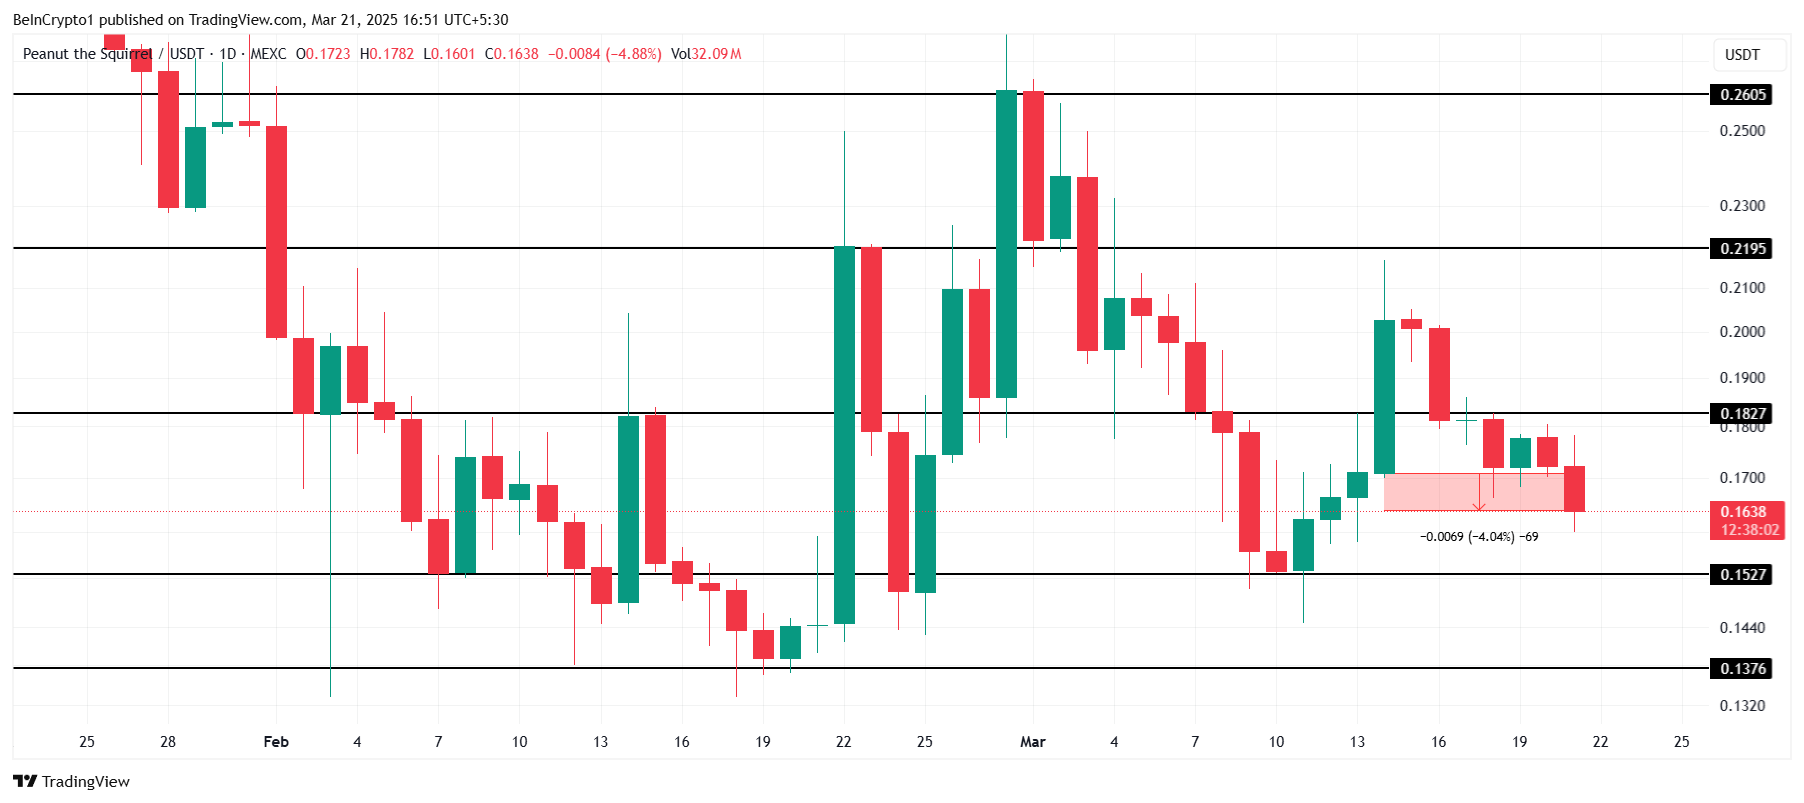
However, if PNUT capitalizes on a recovery and benefits from an improving market sentiment, it could rise to $0.182. A successful breach of this resistance would invalidate the current bearish outlook.
SPX6900 (SPX)
SPX has performed exceptionally well this week, registering a 26% gain. The altcoin is trading at $0.427 at the time of writing, positioning itself as one of the top-performing tokens.
SPX is currently testing the $0.406 support level. If successful in holding this support, the altcoin could see further upside, targeting $0.568. This would help recover losses sustained toward the end of February, pushing SPX toward a more stable and upward trajectory in the coming weeks.
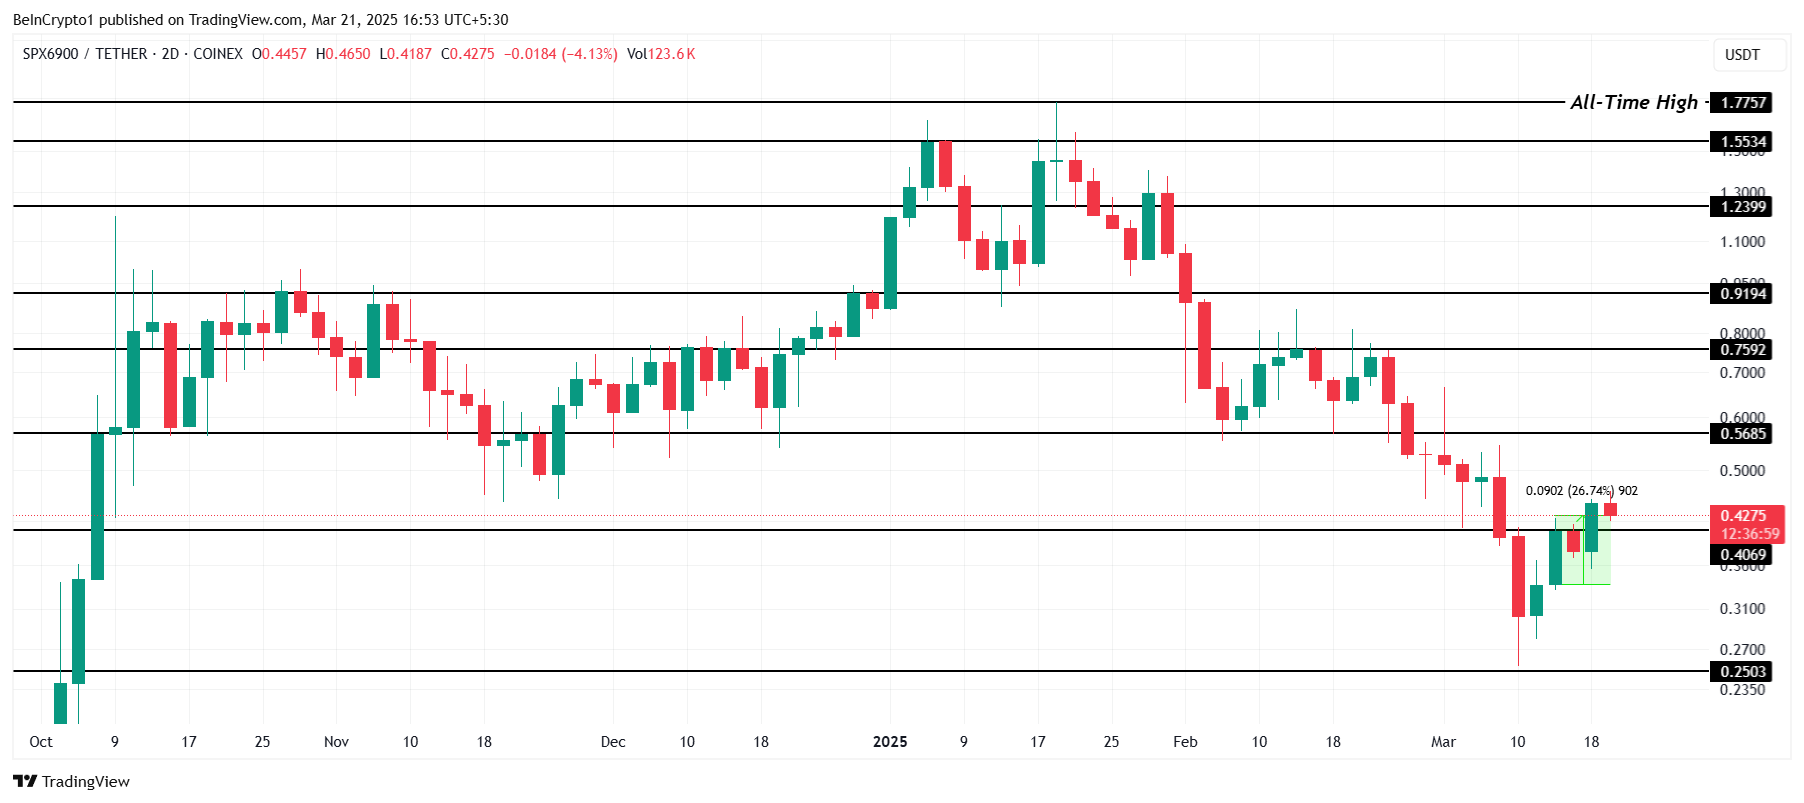
If SPX fails to maintain $0.406 as support, it could face a sharp decline. Falling to $0.250 would mark a significant drop, reaching a five-month low. This would invalidate the bullish outlook and potentially dampen investor sentiment for the altcoin moving forward.
Disclaimer
In line with the Trust Project guidelines, this price analysis article is for informational purposes only and should not be considered financial or investment advice. BeInCrypto is committed to accurate, unbiased reporting, but market conditions are subject to change without notice. Always conduct your own research and consult with a professional before making any financial decisions. Please note that our Terms and Conditions, Privacy Policy, and Disclaimers have been updated.


Bitcoin (BTC) is showing signs of a potential breakout, with recent price action indicating positive momentum.
As broader market conditions cool down, BTC has remained steady, with consistent investor behavior fueling hopes of further gains. The altcoin is poised for possible growth as it continues to attract investors’ attention.
Bitcoin Has The Support Of Key Holders
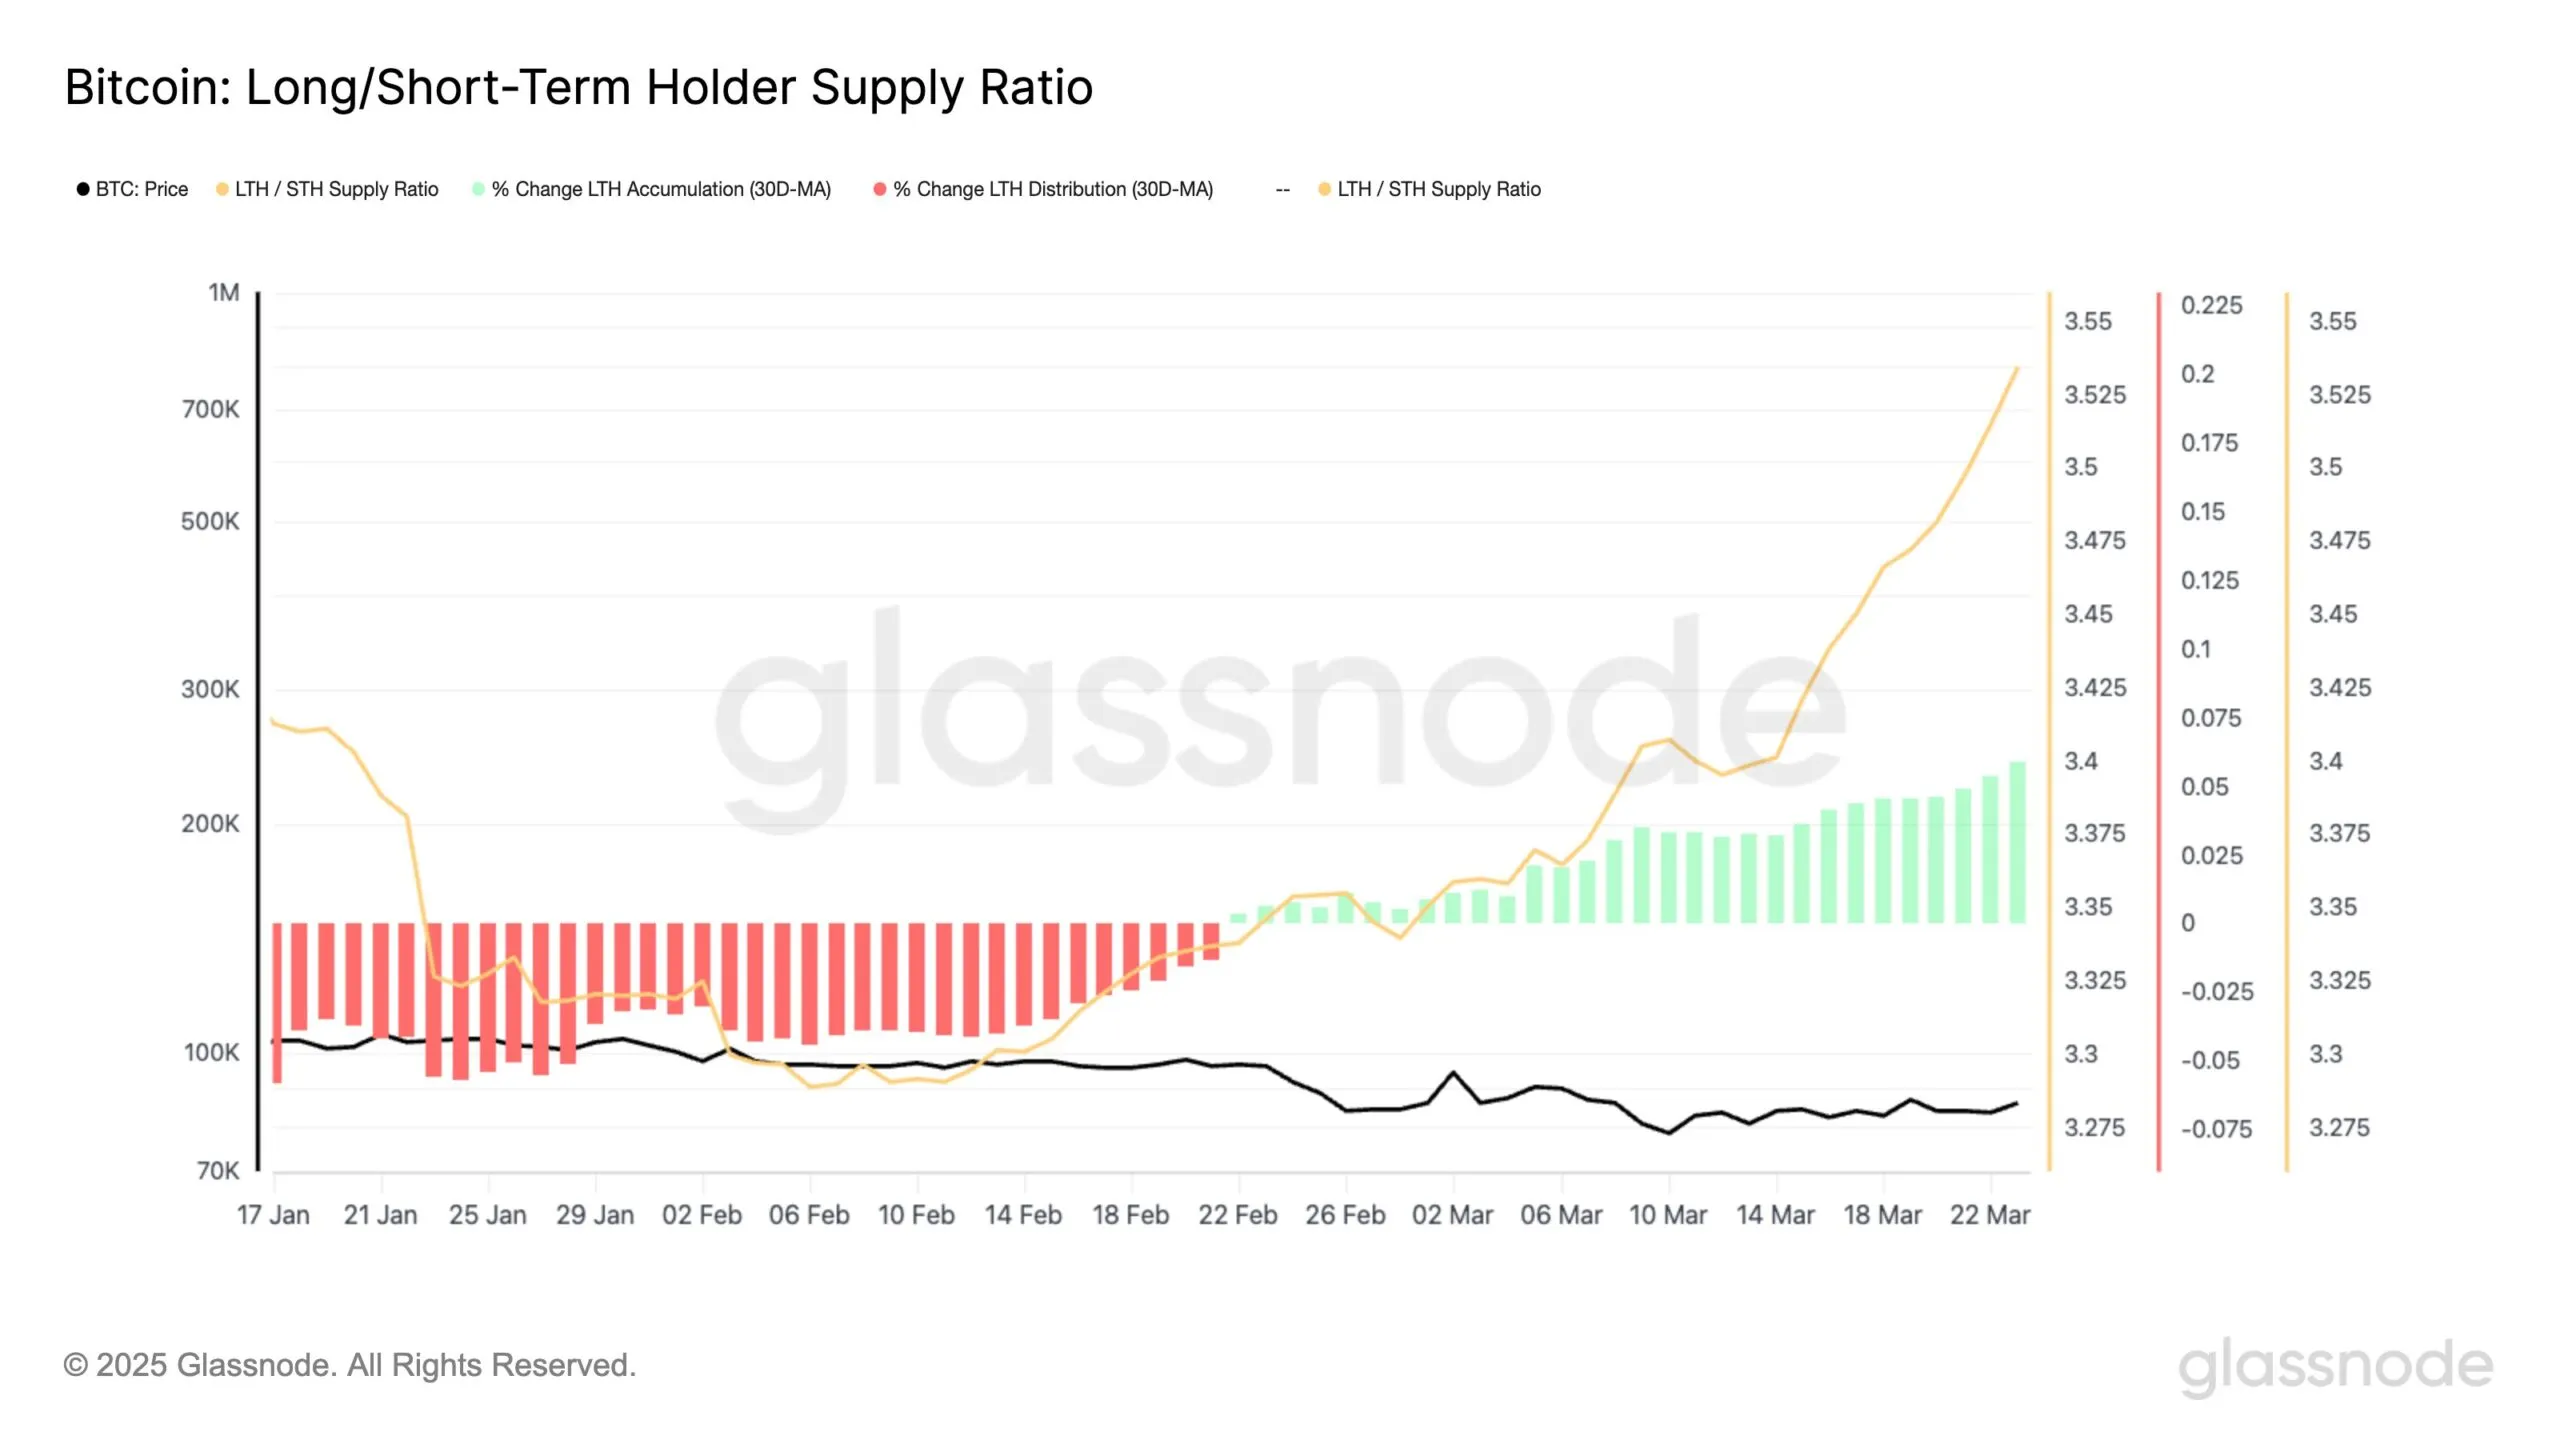
The Long/Short Term Holder Supply Ratio has shown notable growth since the end of February, signaling a positive shift in investor behavior. Long-Term Holders (LTHs) are in steady accumulation, with the 30-day accumulation rate now nearing 6%. The rate of this change has also increased, averaging 7% daily since late February.
This sustained accumulation suggests that LTHs have a strong belief in Bitcoin’s future potential, which could help BTC maintain its recent growth. LTHs are often seen as a stabilizing force in the market, and their consistent accumulation could act as a foundation for the ongoing uptrend in Bitcoin’s price.
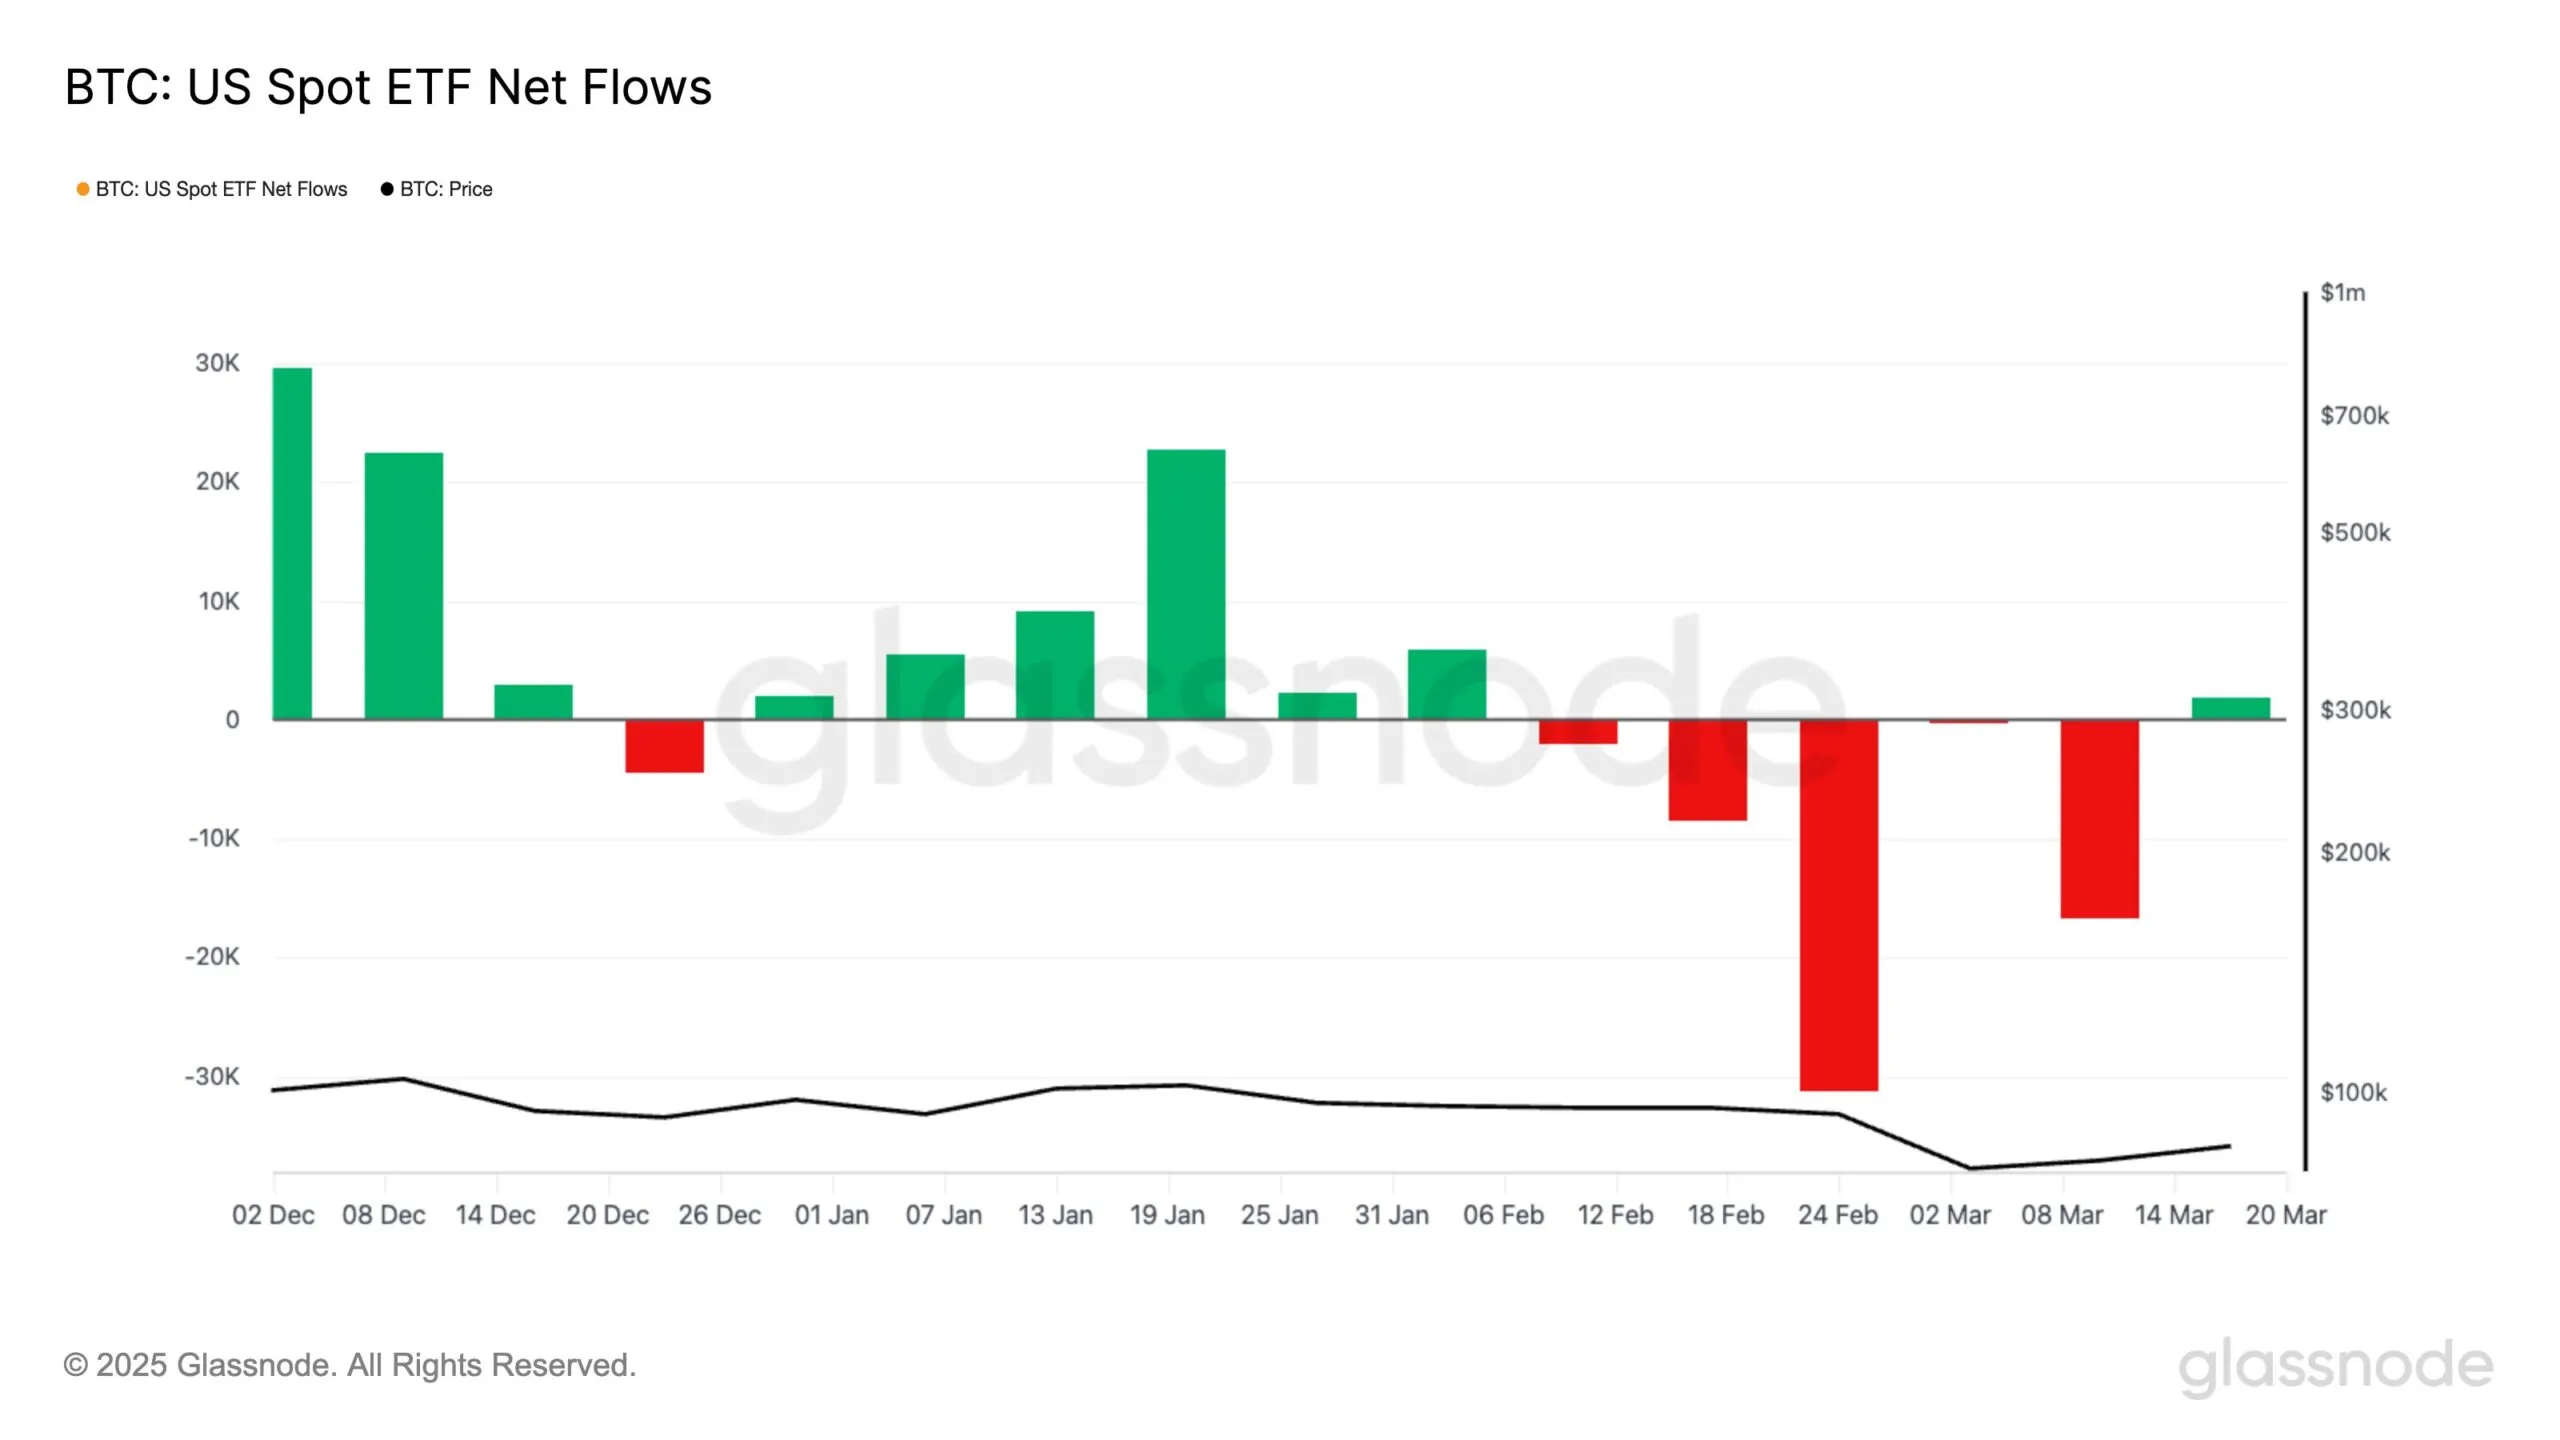
Bitcoin has also seen a positive shift in macro momentum, particularly with the recent inflows into Bitcoin Spot ETFs. Last week marked the first ETF inflows in a month, breaking a four-week streak of outflows. This change signals returning confidence among investors, particularly macrofinancial investors. The renewed interest in BTC ETFs reflects the growing demand for Bitcoin exposure in institutional portfolios.
The inflows indicate that larger investors are once again viewing Bitcoin as a valuable asset. This could be a strong signal that demand for Bitcoin is recovering, which may help propel the price further. The involvement of institutional investors could drive significant price appreciation in the coming weeks.
BTC Price Rise Is Consistent
Bitcoin is currently trading at $86,630, breaking out of a descending wedge pattern. The price is attempting to secure $86,822 as support, which will be crucial for BTC’s next move. If the support holds, Bitcoin may continue its upward trajectory towards the $89,800 resistance level.
The confirmation of the breakout will come when Bitcoin successfully flips the $89,800 resistance into support. A sustained move above this level could push the price further toward $93,625 and potentially $95,000.
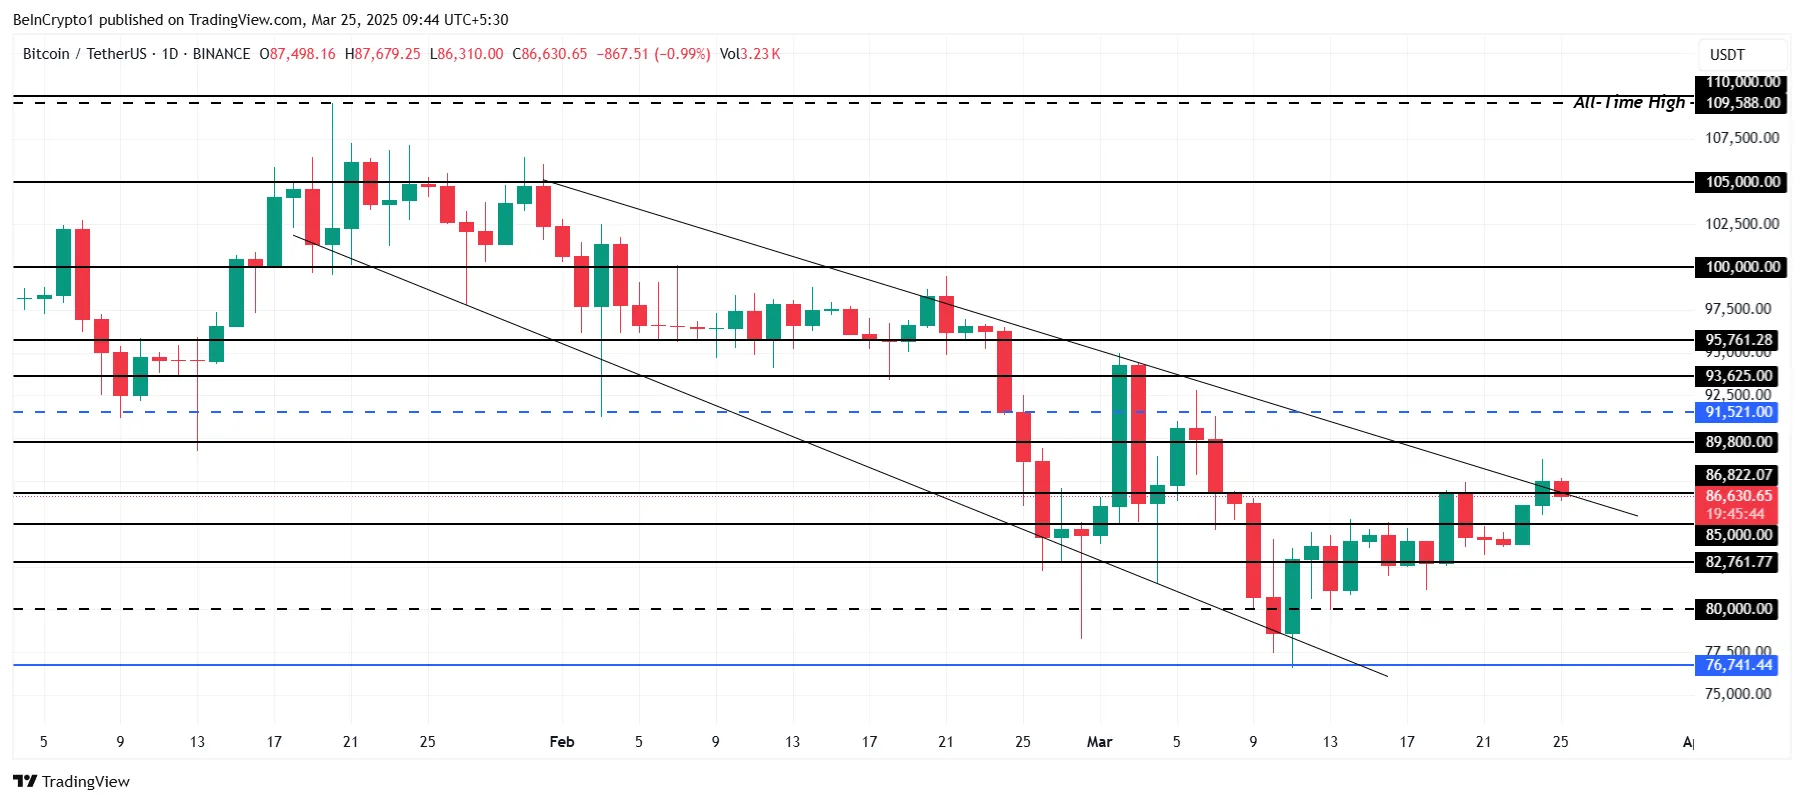
However, if Bitcoin fails to breach $89,800, it could struggle to maintain its current momentum. A consolidation below this level or a drop to $85,000 would delay the recovery, shifting the market sentiment toward caution. This would halt the progress and potentially lead to a longer consolidation phase.
Disclaimer
In line with the Trust Project guidelines, this price analysis article is for informational purposes only and should not be considered financial or investment advice. BeInCrypto is committed to accurate, unbiased reporting, but market conditions are subject to change without notice. Always conduct your own research and consult with a professional before making any financial decisions. Please note that our Terms and Conditions, Privacy Policy, and Disclaimers have been updated.

Reason to trust
![]()
Strict editorial policy that focuses on accuracy, relevance, and impartiality
Created by industry experts and meticulously reviewed
The highest standards in reporting and publishing
Strict editorial policy that focuses on accuracy, relevance, and impartiality
Morbi pretium leo et nisl aliquam mollis. Quisque arcu lorem, ultricies quis pellentesque nec, ullamcorper eu odio.
Ethereum price started a recovery wave above the $2,000 zone. ETH is now consolidating and facing hurdles near the $2,100 resistance.
- Ethereum started a recovery wave above the $2,000 level.
- The price is trading above $2,020 and the 100-hourly Simple Moving Average.
- There is a connecting bullish trend line forming with support at $2,000 on the hourly chart of ETH/USD (data feed via Kraken).
- The pair must clear the $2,080 and $2,100 resistance levels to start a decent increase.
Ethereum Price Recovers Further
Ethereum price formed a base above the $1,850 level and started a recovery wave, like Bitcoin. ETH was able to clear the $1,920 and $1,950 resistance levels.
The bulls pushed the price above the $2,000 level. Finally, the price tested the $2,100 zone. A high was formed at $2,104 and the price started a downside correction. There was a move below the $2,080 level. The price dipped below the 23.6% Fib retracement level of the upward move from the $1,980 swing low to the $2,104 high.
Ethereum price is now trading above $2,020 and the 100-hourly Simple Moving Average. There is also a connecting bullish trend line forming with support at $2,000 on the hourly chart of ETH/USD.
On the upside, the price seems to be facing hurdles near the $2,080 level. The next key resistance is near the $2,100 level. The first major resistance is near the $2,120 level. A clear move above the $2,120 resistance might send the price toward the $2,200 resistance.

An upside break above the $2,200 resistance might call for more gains in the coming sessions. In the stated case, Ether could rise toward the $2,250 resistance zone or even $2,320 in the near term.
Are Dips Supported In ETH?
If Ethereum fails to clear the $2,100 resistance, it could start another decline. Initial support on the downside is near the $2,040 level. The first major support sits near the $2,025 zone and the 61.8% Fib retracement level of the upward move from the $1,980 swing low to the $2,104 high.
A clear move below the $2,025 support might push the price toward the $2,000 support. Any more losses might send the price toward the $1,950 support level in the near term. The next key support sits at $1,880.
Technical Indicators
Hourly MACD – The MACD for ETH/USD is losing momentum in the bullish zone.
Hourly RSI – The RSI for ETH/USD is now below the 50 zone.
Major Support Level – $2,000
Major Resistance Level – $2,100

Hedera (HBAR) is up nearly 5% in the last 24 hours as it attempts to break above the $0.20 mark for the first time in 2 weeks. The recent price rally comes amid improving technical signals that hint at a potential shift in trend.
Despite the ongoing recovery, HBAR still faces key resistance levels and a bearish backdrop that has dominated in recent weeks.
Hedera BBTrend Is Recovering, But Still Negative
Hedera’s BBTrend is currently sitting at -1.85, showing a recovery from -3.44 yesterday, though it was recently as high as 0.96 two days ago.
This recent movement suggests some short-term improvement in price momentum after recent downside pressure. However, the overall trend still leans negative as Hedera struggles to sustain any lasting bullish signals.
The indicator highlights how the token is attempting to recover but remains stuck in a broader pattern of weak momentum.
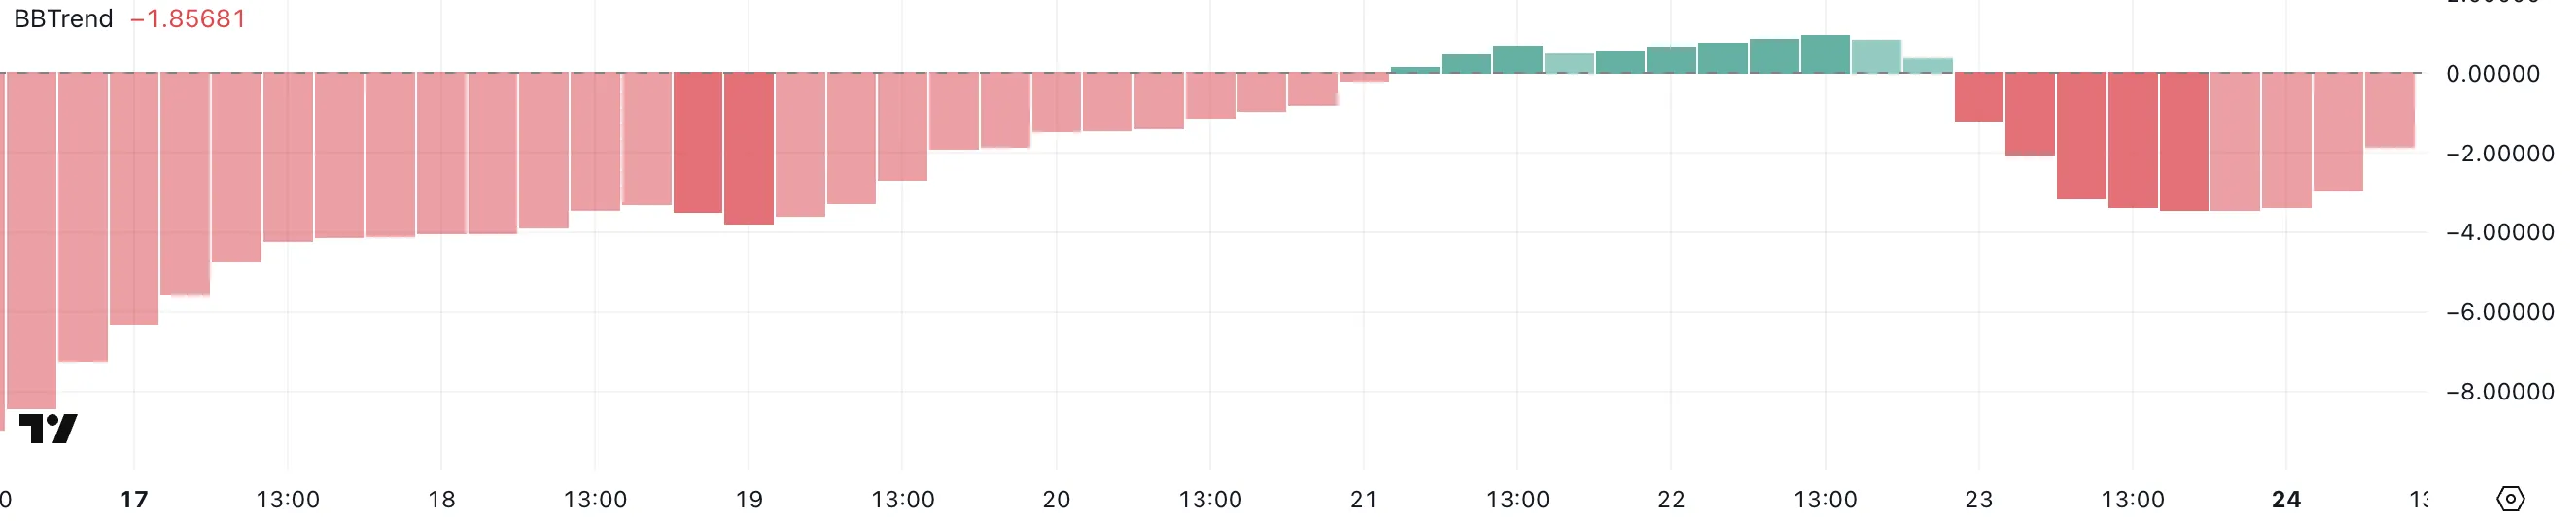
The BBTrend (Bollinger Band Trend) indicator measures how far price action deviates from the center of the Bollinger Bands, helping to assess trend strength and direction.
Typically, values above 0 suggest bullish conditions, while values below 0 point to bearish momentum. With Hedera’s BBTrend currently at -1.85, it suggests bearish pressure is still present, despite the recent bounce.
More importantly, Hedera has shown difficulty sustaining strong positive levels for an extended period – the last time BBTrend crossed above 10 was on March 6, highlighting how fleeting bullish momentum has been in recent weeks.
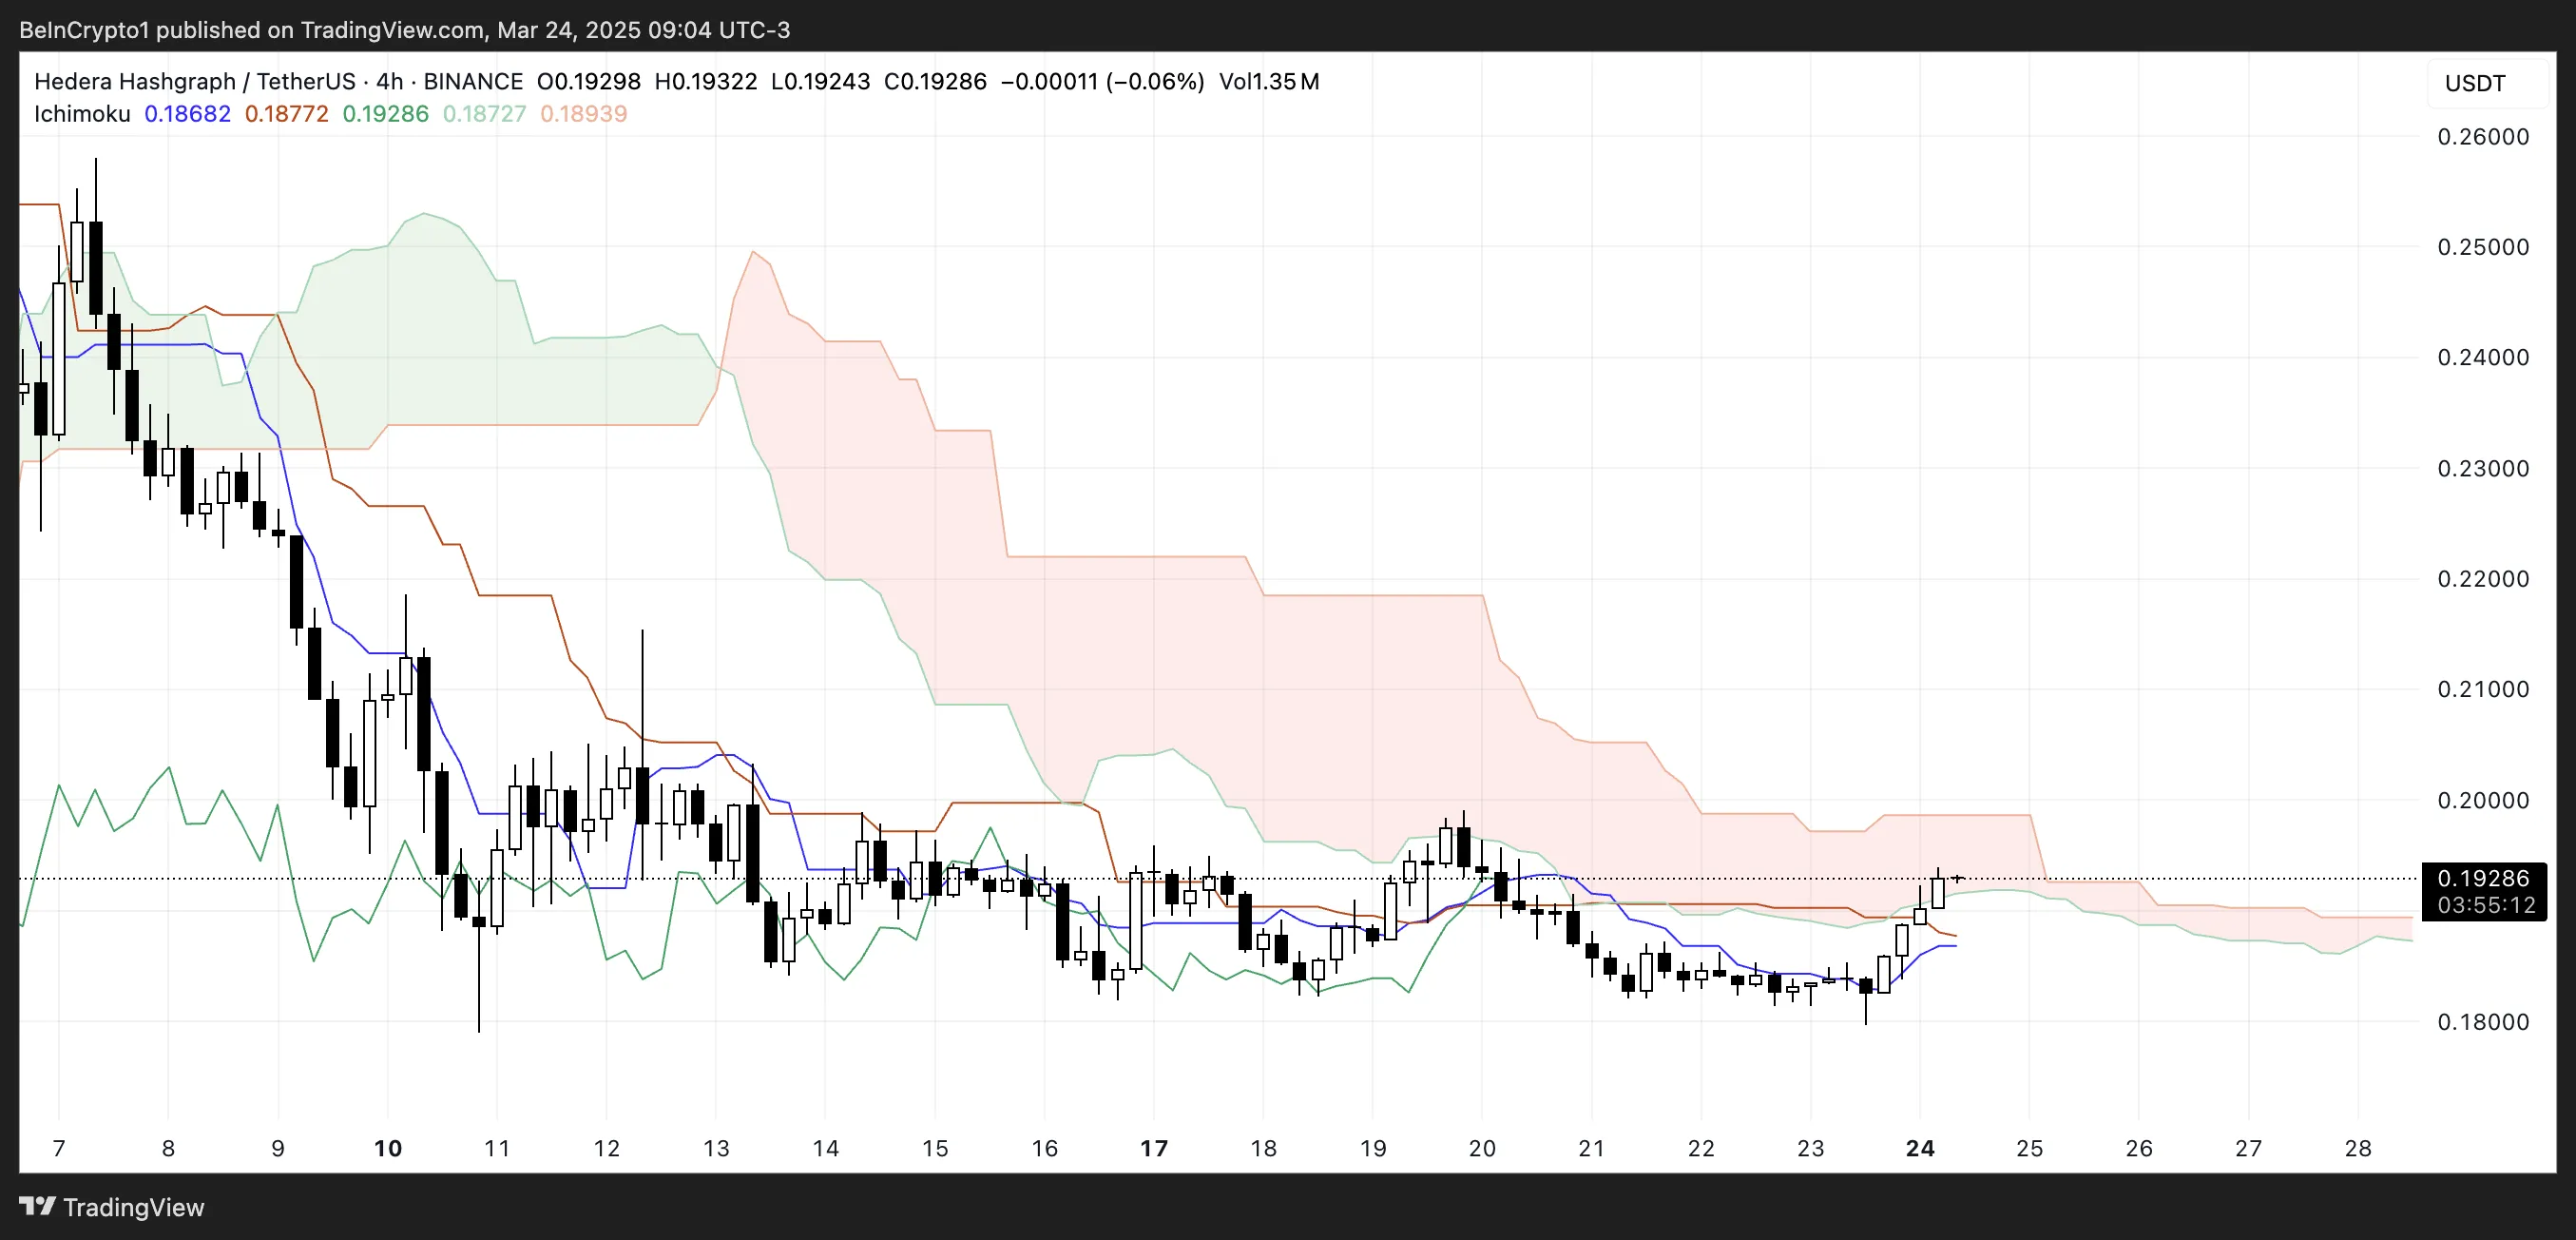
HBAR Ichimoku Cloud Shows The Trend Could Be Shifting, But There Are Challenges Ahead
Hedera’s Ichimoku Cloud chart is showing some early signs of recovery, as the price has broken above the blue Tenkan-sen line and is now testing the bottom of the red Kumo (cloud).
The price action has moved into the cloud after trading below it for an extended period, which can be seen as a shift from bearish to more neutral conditions.
While the price attempting to climb into the cloud suggests that selling pressure is weakening, it still faces resistance from the thicker part of the Kumo just above current levels.
The cloud’s bearish (red) coloration indicates that the broader trend remains under pressure, despite the recent upside move.
The Ichimoku Cloud, or Kumo, is a multi-component indicator that highlights support, resistance, trend direction, and momentum all in one glance. When prices are below the cloud, it suggests bearish conditions, while prices above the cloud signal bullish sentiment.
Trading inside the cloud typically indicates a consolidation phase or market indecision.
In Hedera’s case, the token’s current positioning within the cloud signals that it is attempting to neutralize the recent bearish momentum but has not yet shifted into a clear bullish trend.
Until HBAR can firmly break above the upper edge of the cloud, upside potential may remain capped by resistance.
Will A Golden Cross Make Hedera Surge?
Hedera’s EMA lines are still showing a bearish setup overall as long-term EMAs continue to trend downward. However, short-term EMAs are beginning to slope upwards and could soon cross above the longer-term averages, potentially forming a golden cross.
If this bullish crossover occurs, it may trigger a stronger upward move, with the first resistance level sitting at $0.199. A break above this level could open the path for further gains toward $0.215, and if the bullish momentum accelerates, Hedera price could even aim for $0.258 in the coming sessions.
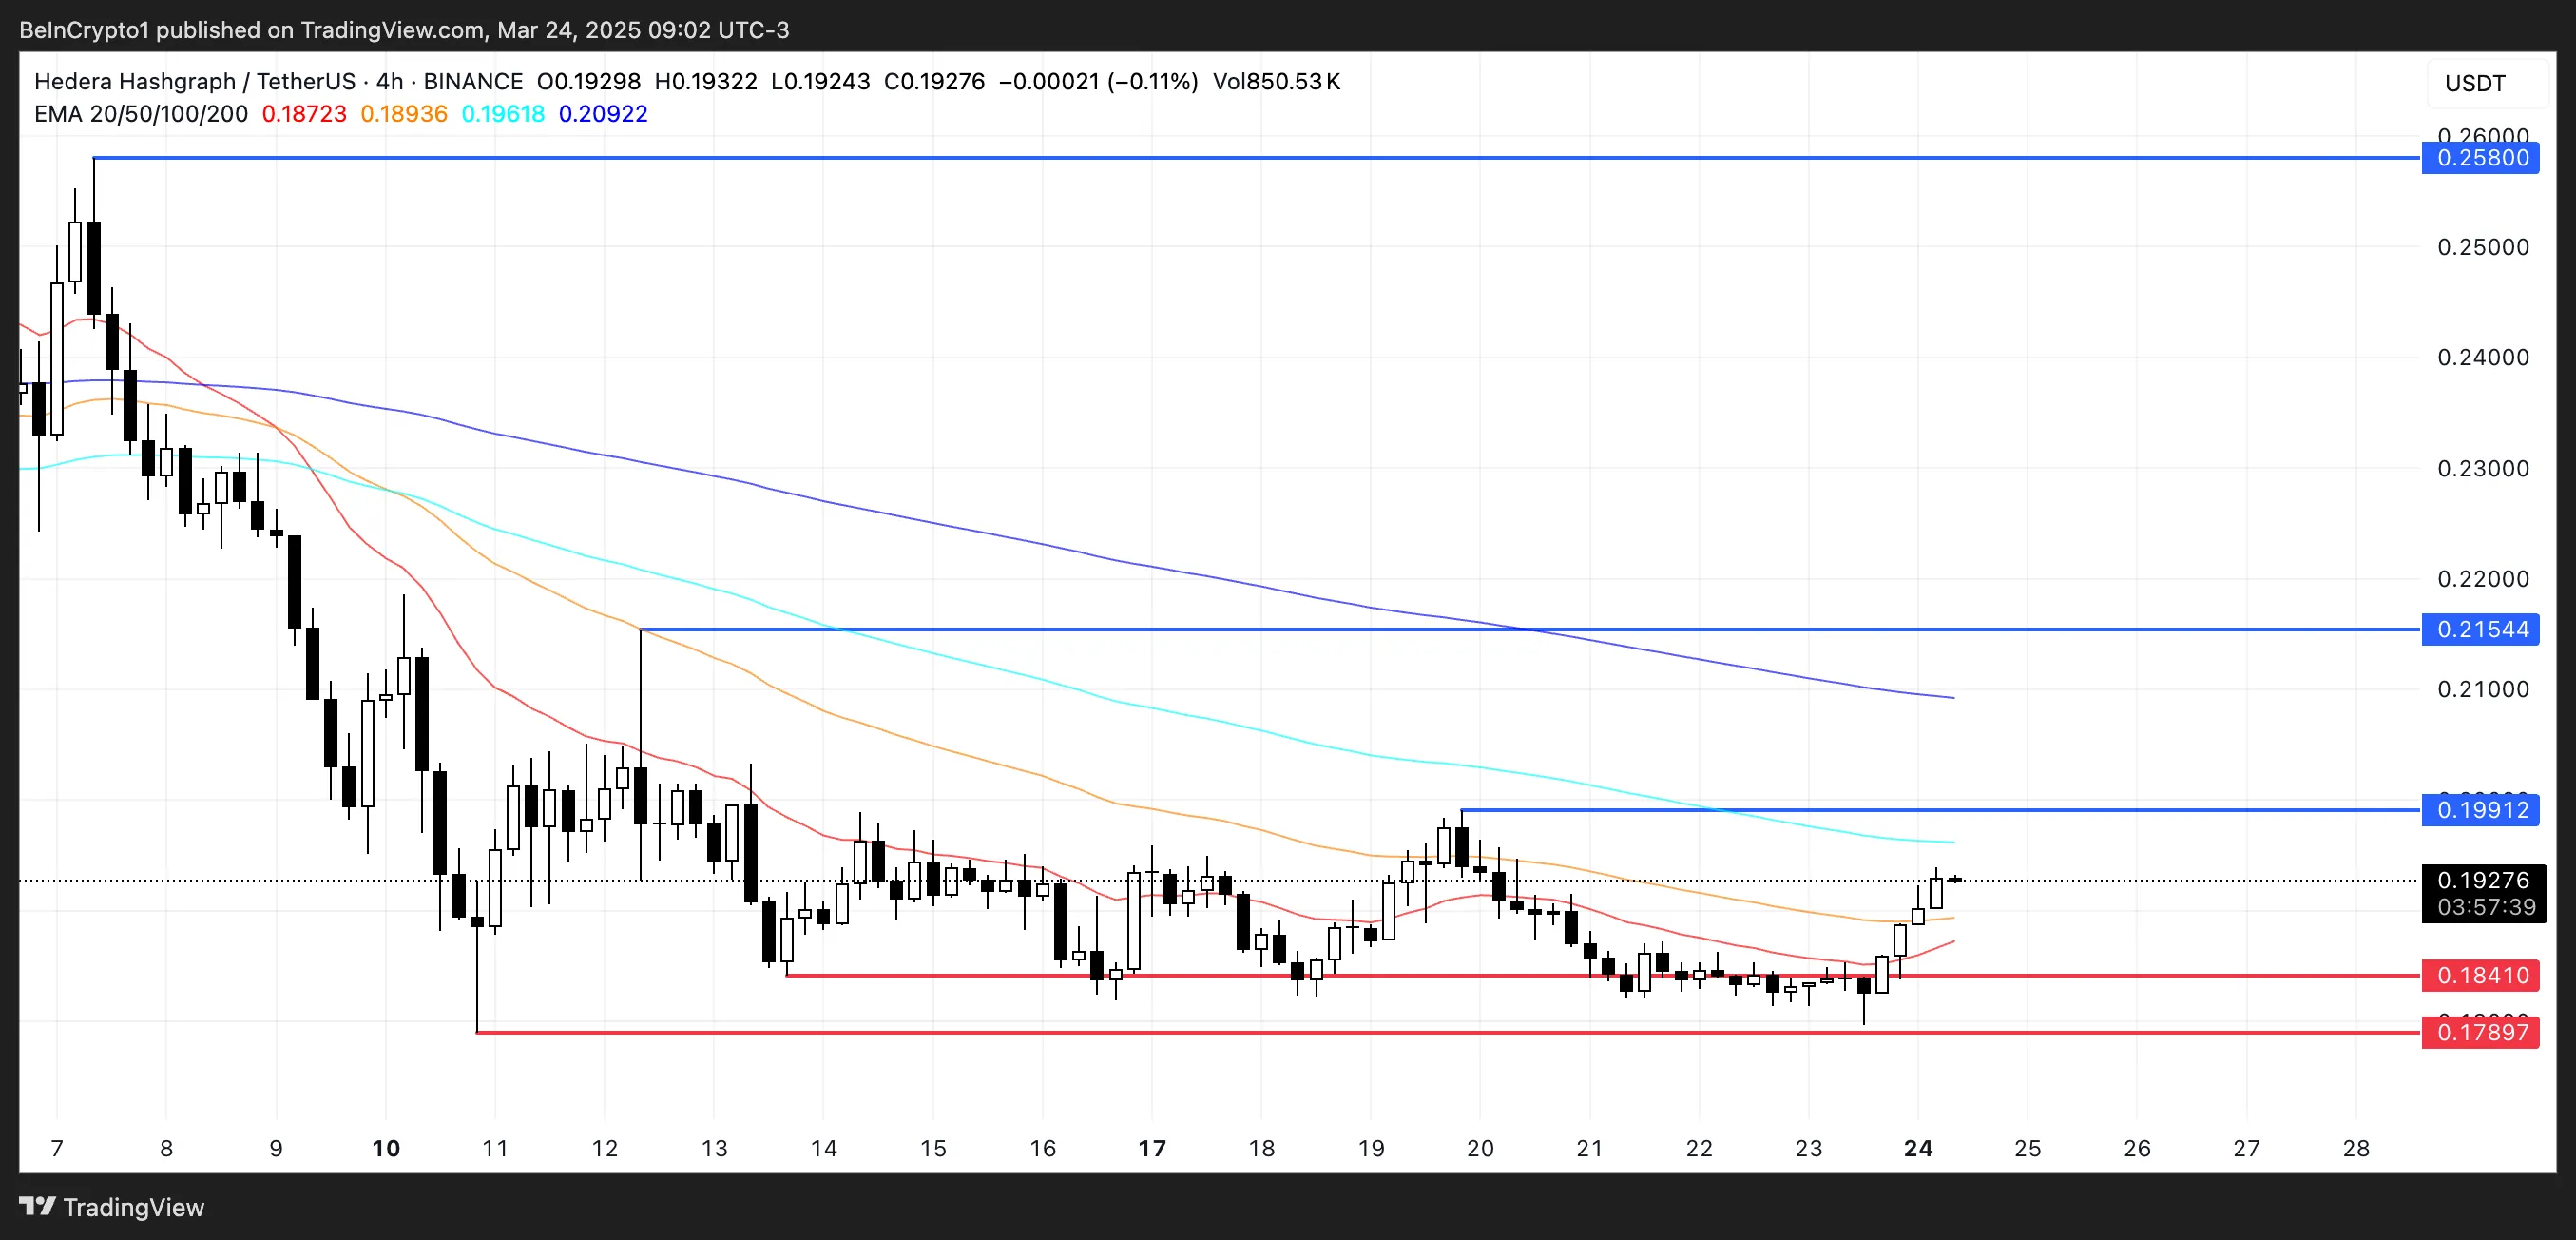
Alternatively, if the short-term upside momentum fades and the golden cross fails to materialize, bearish pressure could resume. In this scenario, HBAR may revisit key support levels at $0.184 and $0.178.
A decisive break below these levels could lead the token back under $0.17, reinforcing the bearish structure.
Disclaimer
In line with the Trust Project guidelines, this price analysis article is for informational purposes only and should not be considered financial or investment advice. BeInCrypto is committed to accurate, unbiased reporting, but market conditions are subject to change without notice. Always conduct your own research and consult with a professional before making any financial decisions. Please note that our Terms and Conditions, Privacy Policy, and Disclaimers have been updated.
Is Ethena Price At Risk? Trump’s World Liberty Financial Sells 184K ENA Sparking Concerns
Bitcoin Price Breaks Out with First Spot ETF Inflows in A Month

Ethereum Price Back Above $2,000—Breakout or Just a Temporary Bounce?
Analyst Predicts XRP Price Could Surge Above $1400 as Bull Flag Breaks
Hedera (HBAR) Shows Bearish Signals Despite Recovering 5%
Polymarket Integrates Solana, Enables Deposits With SOL

2.52 Million Altcoins Are Ruining Crypto’s Future

Animoca Brands Valuation Tanks 75% In Two Years, Here’s Why

Crypto exchange BingX hacked for $43 million

Are The Big Players Losing Interest?

Hong Kong’s Securities Association Tips Authorities On Crypto Self-Regulation

Coinbase cbBTC Set to go Live on Solana
2.52 Million Altcoins Are Ruining Crypto’s Future
Animoca Brands Valuation Tanks 75% In Two Years, Here’s Why
Crypto exchange BingX hacked for $43 million
Are The Big Players Losing Interest?
Hong Kong’s Securities Association Tips Authorities On Crypto Self-Regulation
Coinbase cbBTC Set to go Live on Solana
-
 Altcoin18 hours ago
Ripple Coin and Bitcoin Dominate the $644M Weekly Inflow
-
 Bitcoin22 hours ago
US Economic Data This Week: Key Events Shaping Bitcoin
-

 Market20 hours ago
Ethereum Supply Dips as Leverage Rises – What It Means for ETH
-
 Altcoin19 hours ago
Why Trump’s World Liberty Financial Stacked 6 Million MNT?
-

 Market23 hours ago
Dogecoin (DOGE) Plots Comeback—Is The Meme Coin Gearing Up for a Move?
-

 Market18 hours ago
SPX Rebound Drives 148% Increase, Eyes New Gains
-
 Altcoin23 hours ago
Why Is Solana Price Up 7% Today?
-
 Market22 hours ago
Why “Easy Money” in Crypto is Gone