
Market
Solana (SOL) Risks Falling to $120 as Bearish Signals Grow
Solana (SOL) is under pressure after failing to sustain its recent rally and is now trading lower, following Bitcoin and Ethereum’s recent patterns. Despite briefly surging earlier this week, SOL has dropped over 3% in the past 24 hours.
Technical indicators are showing growing bearish signals, with sellers regaining control in the short term. Traders are watching key support and resistance levels as Solana struggles to regain its bullish momentum.
SOL Ichimoku Cloud Shows The Setup Is Turning Bearish
Solana is currently trading below the Ichimoku Cloud, indicating a bearish trend in the short term. The price has fallen under both the Tenkan-sen (blue line) and Kijun-sen (red line), suggesting downward momentum is still in play.
The cloud ahead is thin and flat, signaling weak trend strength and the potential for continued sideways or bearish price action unless buyers step in soon.
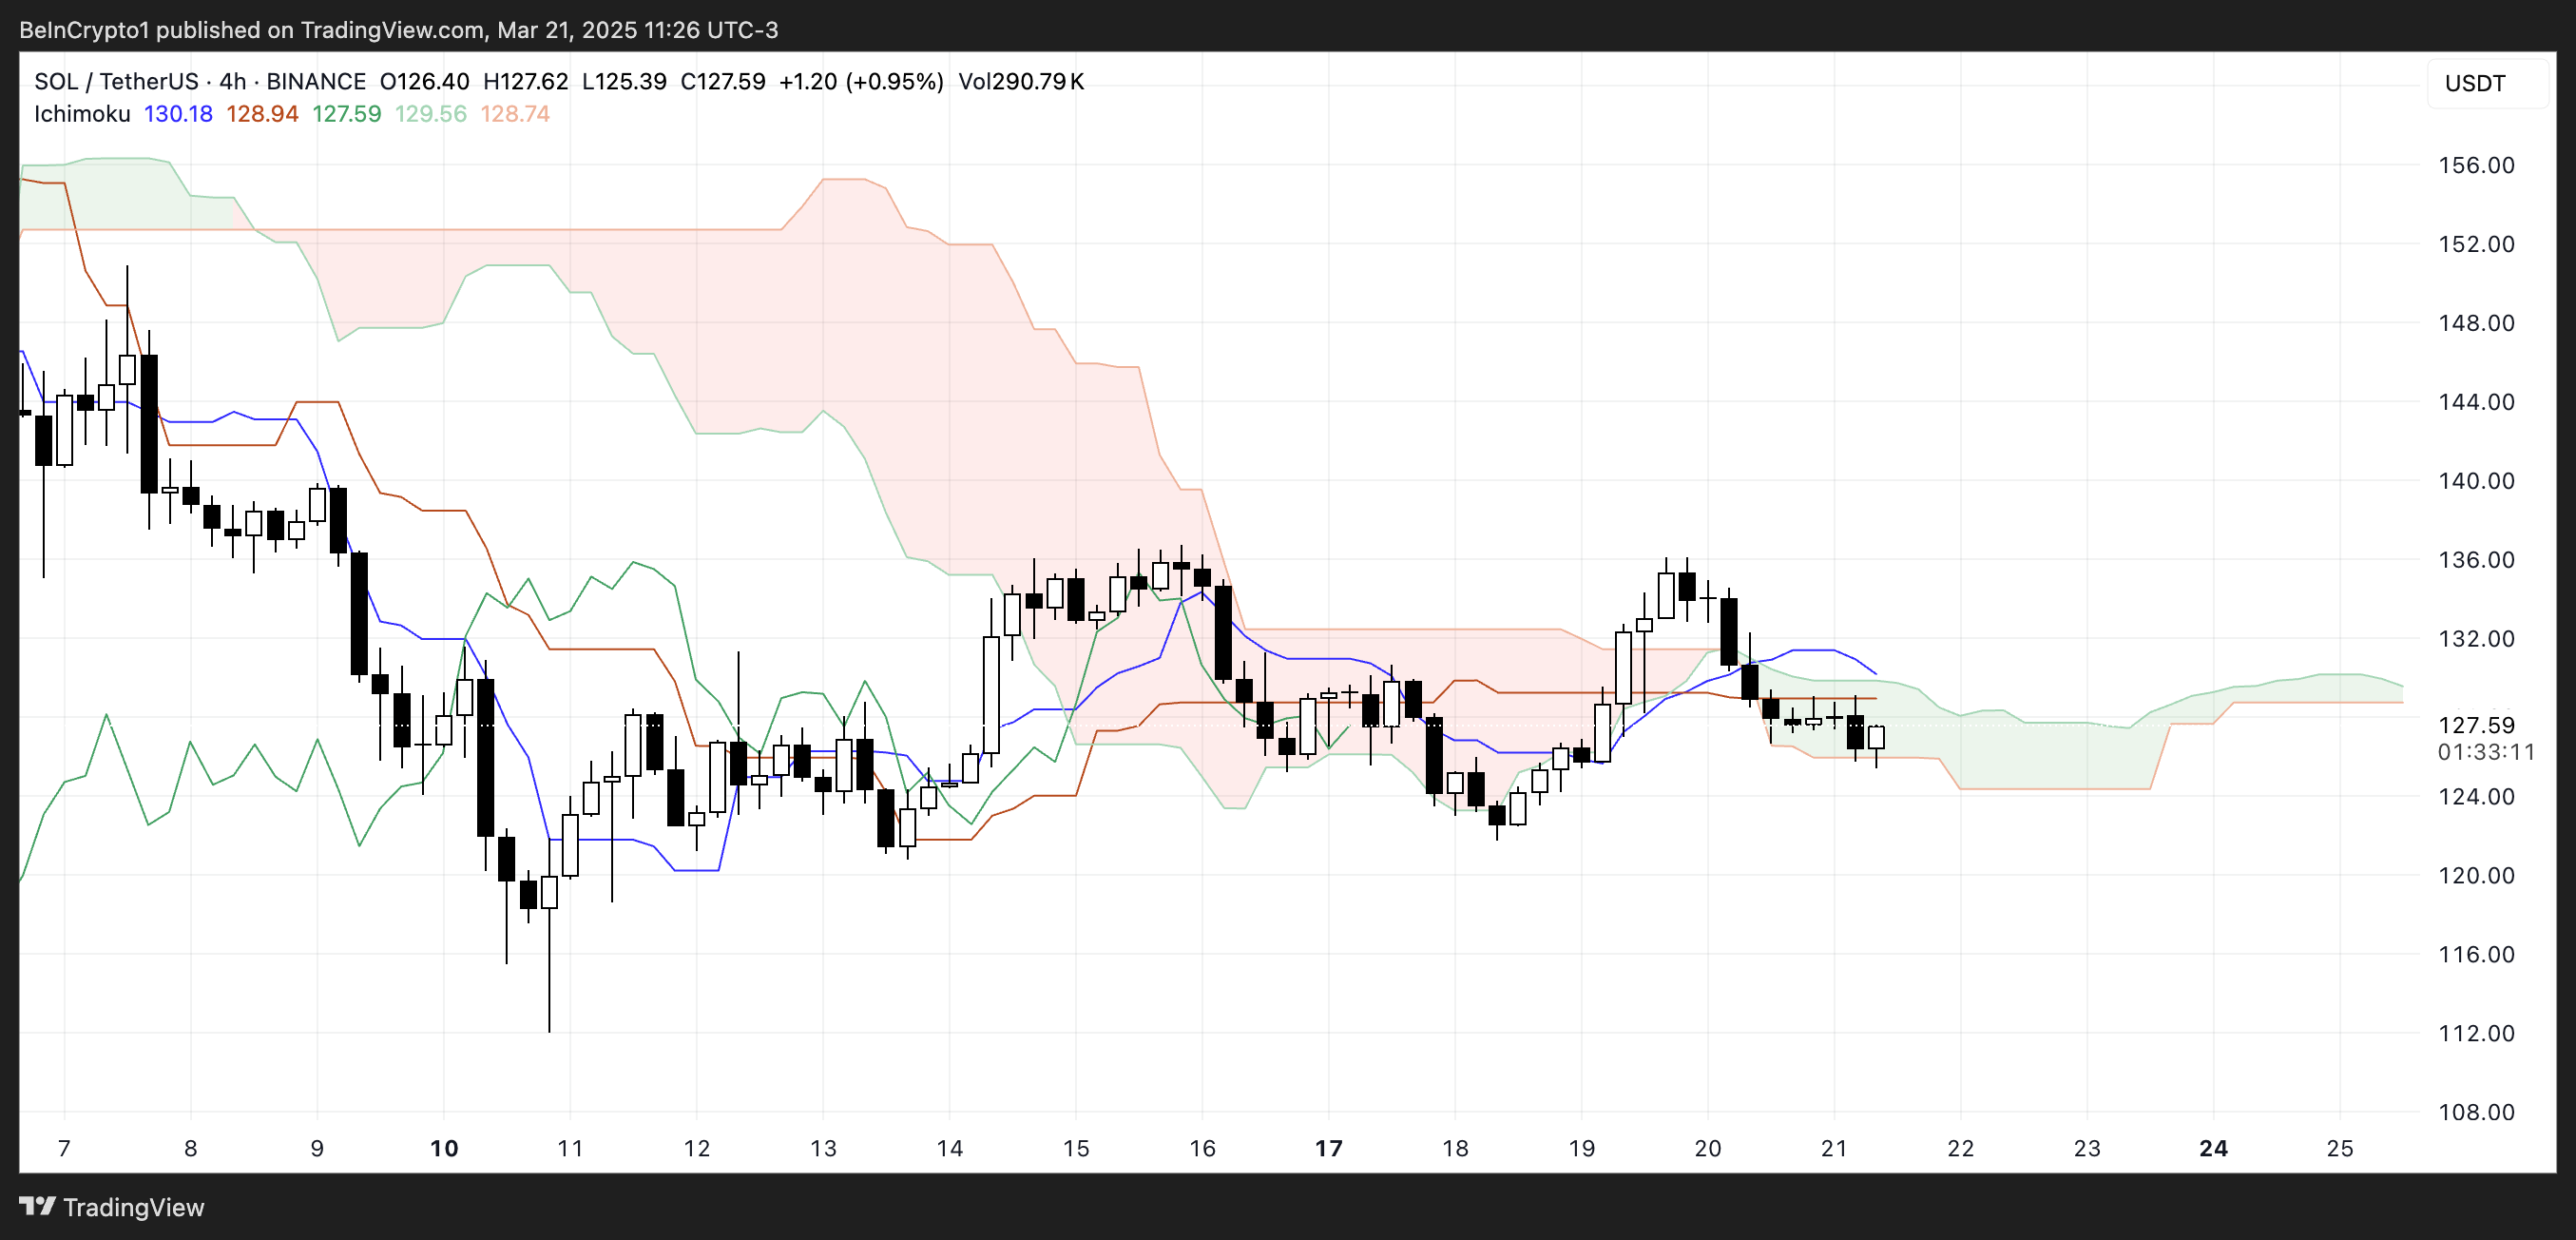
Additionally, the Lagging Span (green line) is positioned below both the price and the cloud, reinforcing the bearish sentiment. The price is hovering near the lower boundary of the cloud, which could act as immediate resistance if Solana attempts a rebound.
If sellers maintain control, SOL could face further downside pressure, while a breakback above the cloud would be needed to hint at a possible trend reversal.
Solana DMI Shows Sellers Regain Control After The Brief Surge
Solana’s DMI chart shows that the ADX has dropped to 15.87 from 22.18 yesterday, indicating a weakening trend.
The Average Directional Index (ADX) measures the strength of a trend, with values above 25 suggesting a strong trend and values below 20 pointing to weak or consolidating price action.
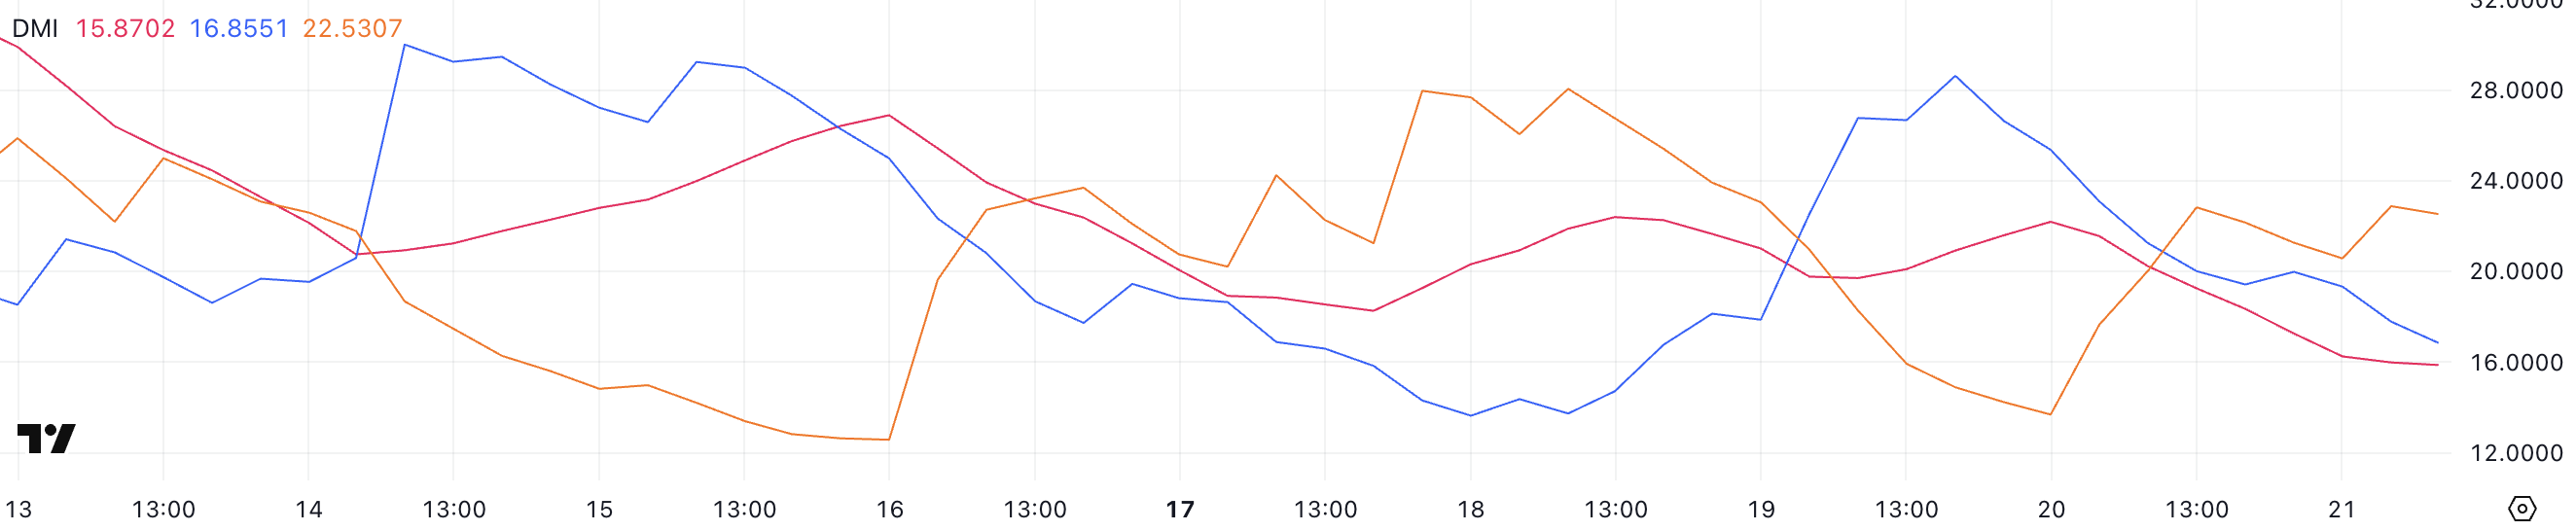
At the same time, the +DI has fallen sharply to 16.85 from 28.62, showing a loss of bullish momentum. Meanwhile, the -DI has risen to 22.53 from 14.88, suggesting growing bearish pressure.
With the -DI now above the +DI and the ADX below 20, Solana could remain under selling pressure or enter a range-bound phase as bears take short-term control.
Solana Could Fall Until $112 If Bearish Momentum Intensifies
Solana followed a similar pattern to Bitcoin and Ethereum, briefly rallying between March 19 and 20 before reversing and dropping over 3% in the last 24 hours.
The price is now approaching key support around $120, and a break below this level could trigger a deeper decline toward $112 or even below $110.
Despite the recent corrections, according to Charles Wayn, founder of decentralized Web3 super-app Galxe, told BeInCrypto that Solana’s success shows blockchains need niches:
“As Solana celebrates the arrival of its first futures ETF, it has firmly disproved those who doubted its survival since its launch five years ago. While not becoming the “Ethereum killer” it was touted to be, it has – among other things – emerged as the blockchain for meme coin trading. With $3 billion in daily meme coin trading volume at the peak of the frenzy, Solana’s pump.fun is the largest and highest-grossing meme coin launchpad in the market. Solana has truly found its niche in the crypto market over the last five years – and now it’s time for other blockchains to find theirs.”
He also points out Solana’s success in the meme coins sector:
“Solana’s success in the meme coin sector demonstrates the need for multiple Layer1 blockchains in the crypto ecosystem. Indeed, many competitors have come into the space to challenge Solana as the retail chain, but its dominance in meme coins has kept it popular with new and mainstream users. There will always be faster, cheaper, more composable and more UX-friendly chains – however, specialized Layer1s that focus on a specific aspect of the industry are going to become more prevalent. Crucially, discovering a niche will allow chains to remain competitive and attract developers and users,” says Wayn.
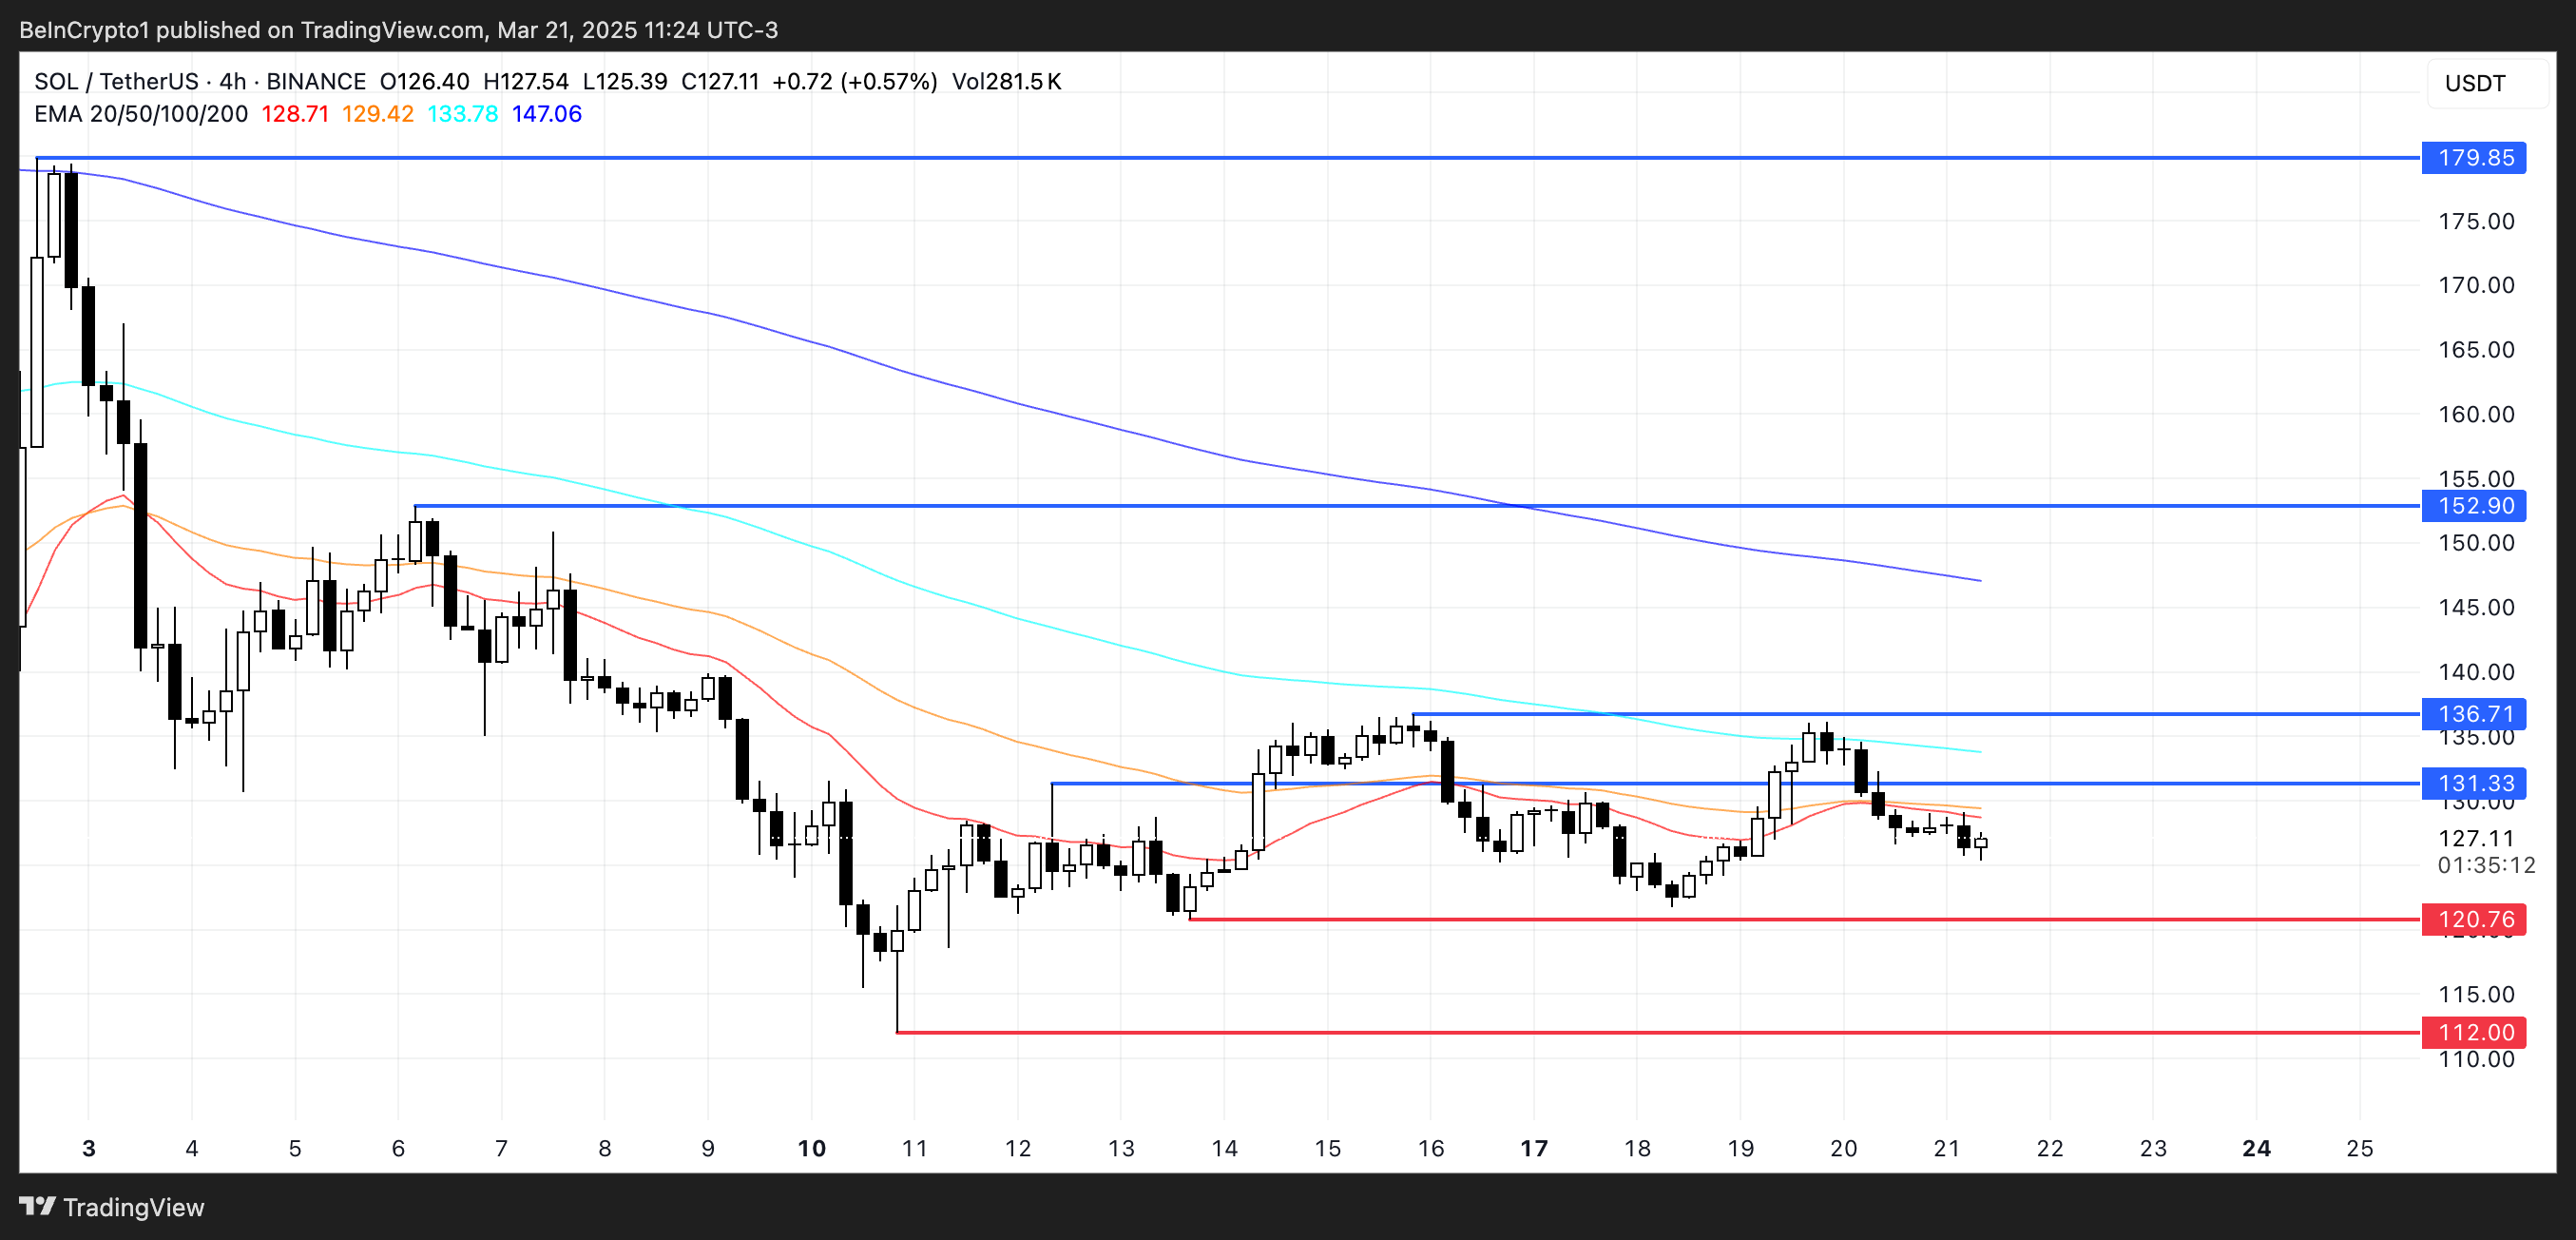
If Solana price manages to regain bullish momentum, it could first target resistances at $131 and $136. It recently tried and failed twice to break that resistance.
A stronger recovery could lead to a rally toward $152.9 and potentially $179.85, which would mark its highest price since early March.
Disclaimer
In line with the Trust Project guidelines, this price analysis article is for informational purposes only and should not be considered financial or investment advice. BeInCrypto is committed to accurate, unbiased reporting, but market conditions are subject to change without notice. Always conduct your own research and consult with a professional before making any financial decisions. Please note that our Terms and Conditions, Privacy Policy, and Disclaimers have been updated.


Bitcoin (BTC) is showing signs of a potential breakout, with recent price action indicating positive momentum.
As broader market conditions cool down, BTC has remained steady, with consistent investor behavior fueling hopes of further gains. The altcoin is poised for possible growth as it continues to attract investors’ attention.
Bitcoin Has The Support Of Key Holders
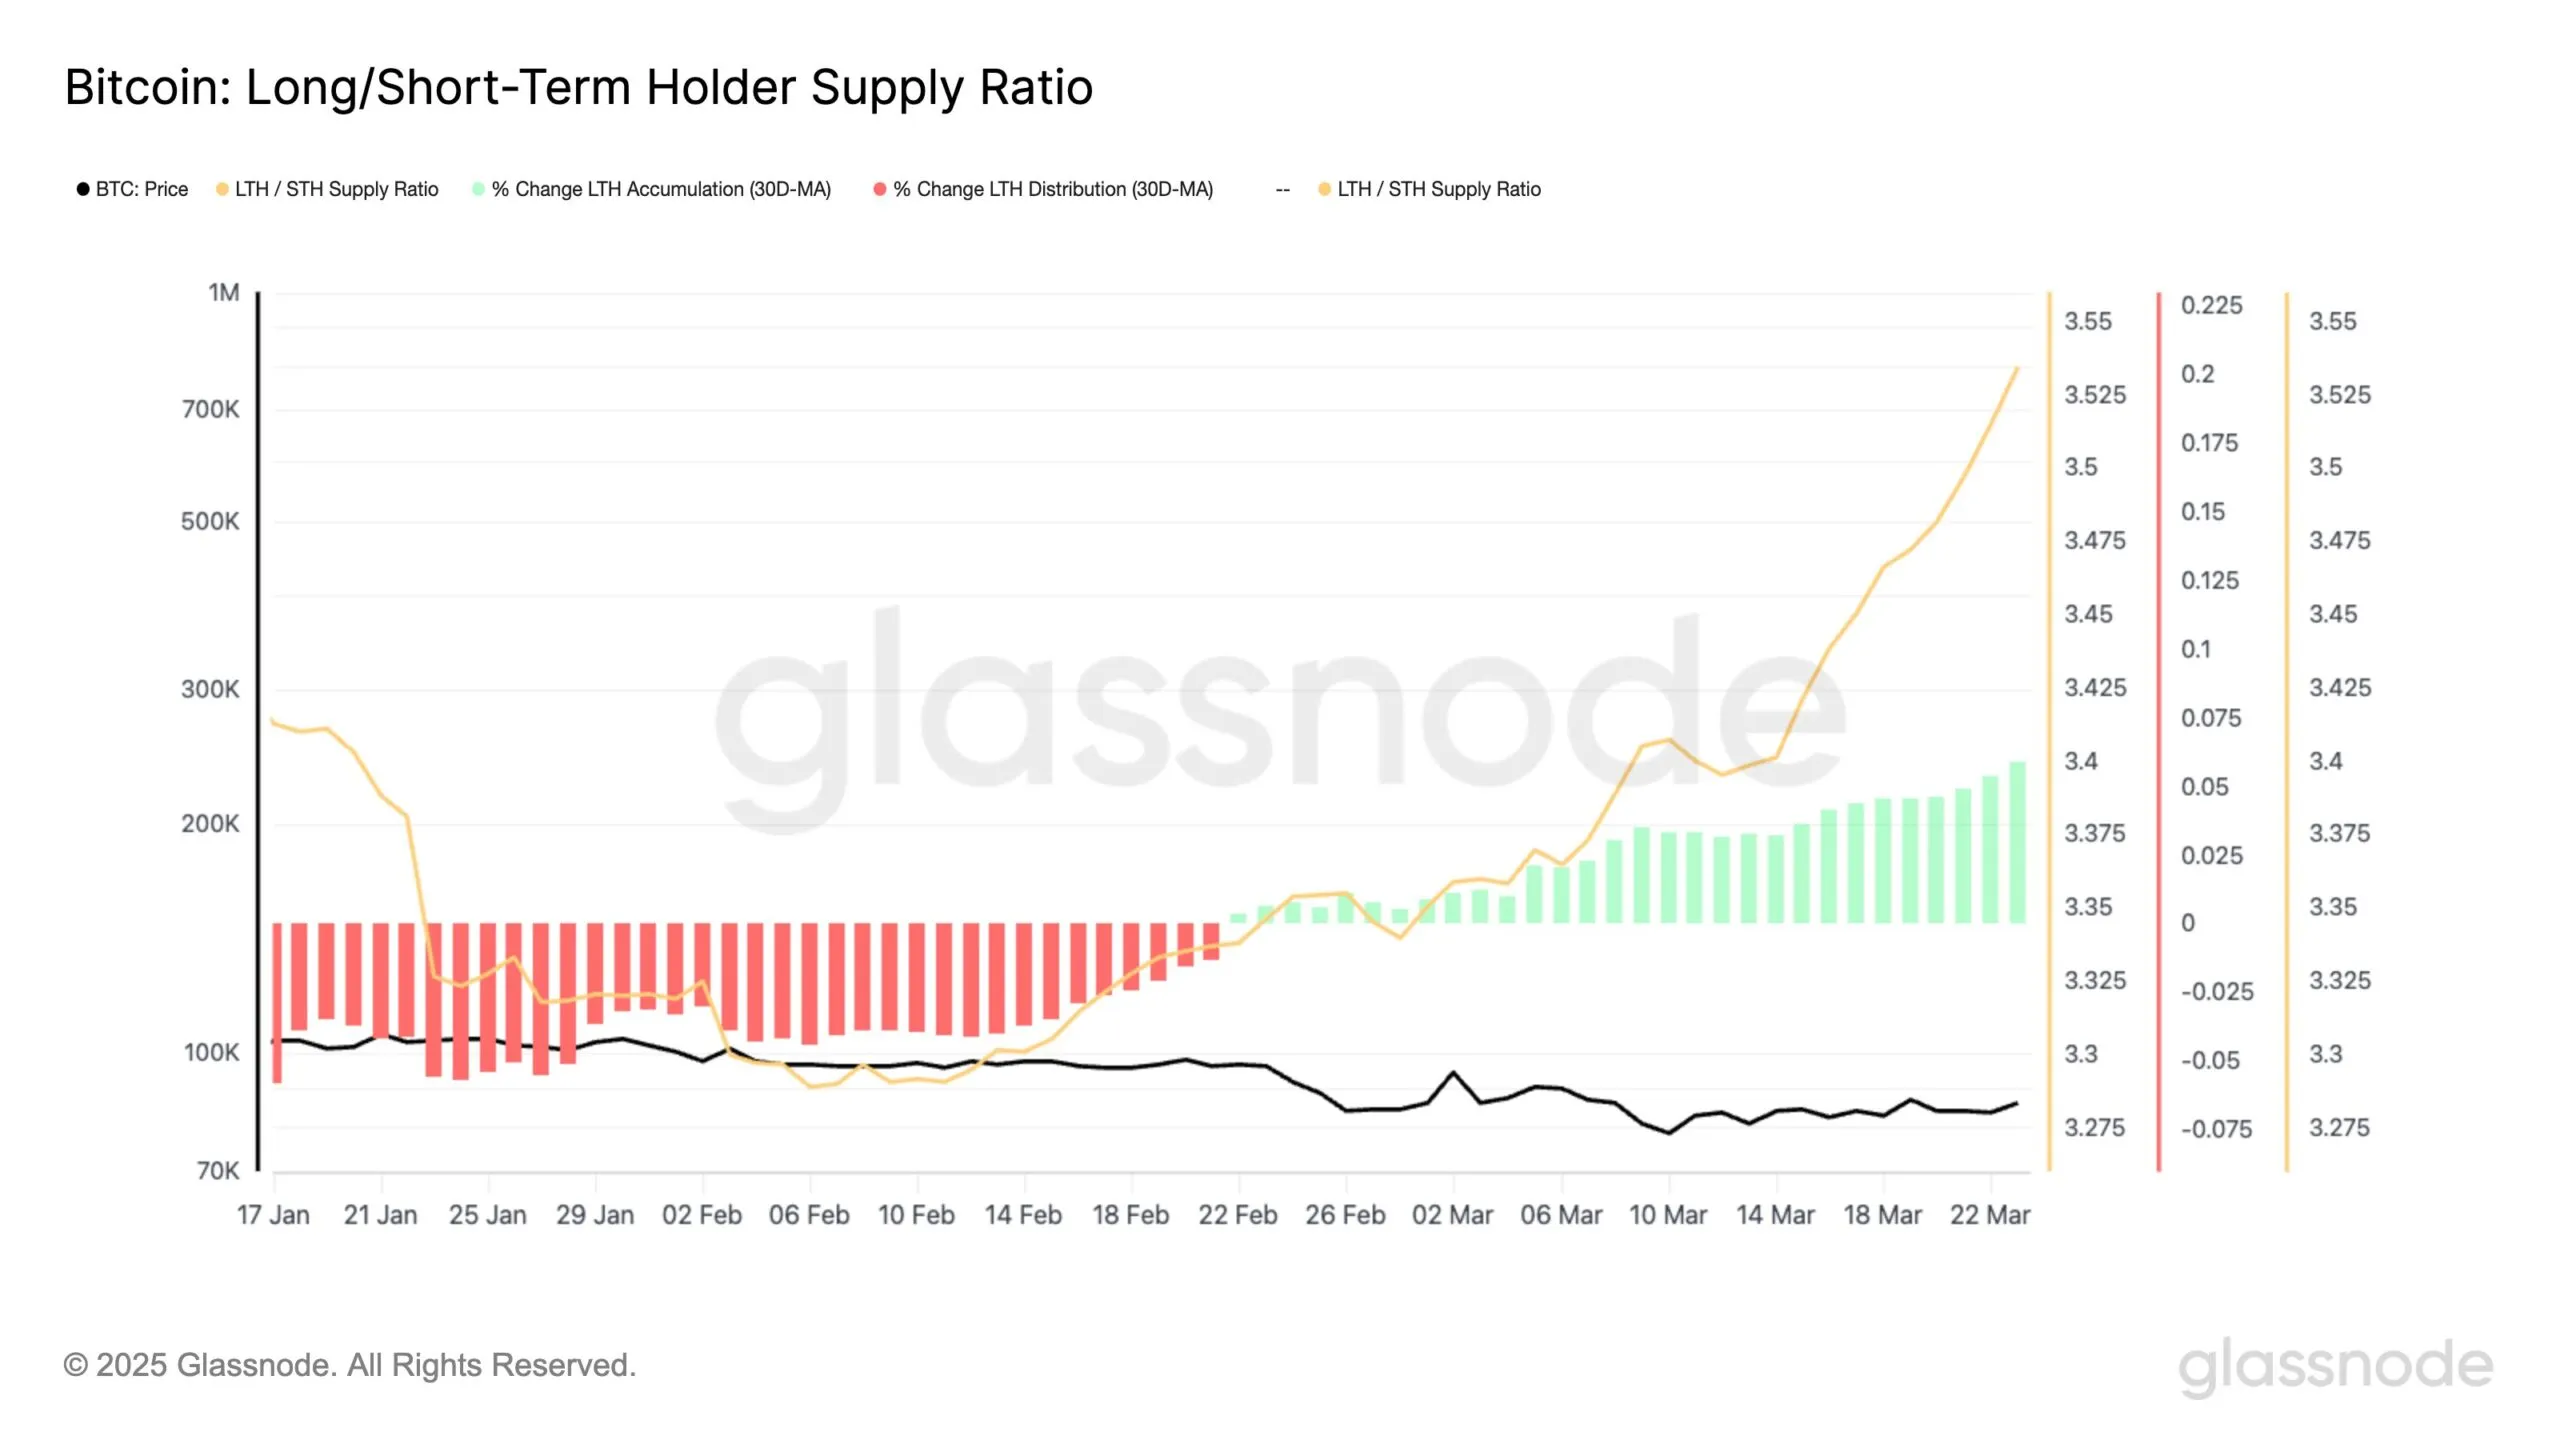
The Long/Short Term Holder Supply Ratio has shown notable growth since the end of February, signaling a positive shift in investor behavior. Long-Term Holders (LTHs) are in steady accumulation, with the 30-day accumulation rate now nearing 6%. The rate of this change has also increased, averaging 7% daily since late February.
This sustained accumulation suggests that LTHs have a strong belief in Bitcoin’s future potential, which could help BTC maintain its recent growth. LTHs are often seen as a stabilizing force in the market, and their consistent accumulation could act as a foundation for the ongoing uptrend in Bitcoin’s price.
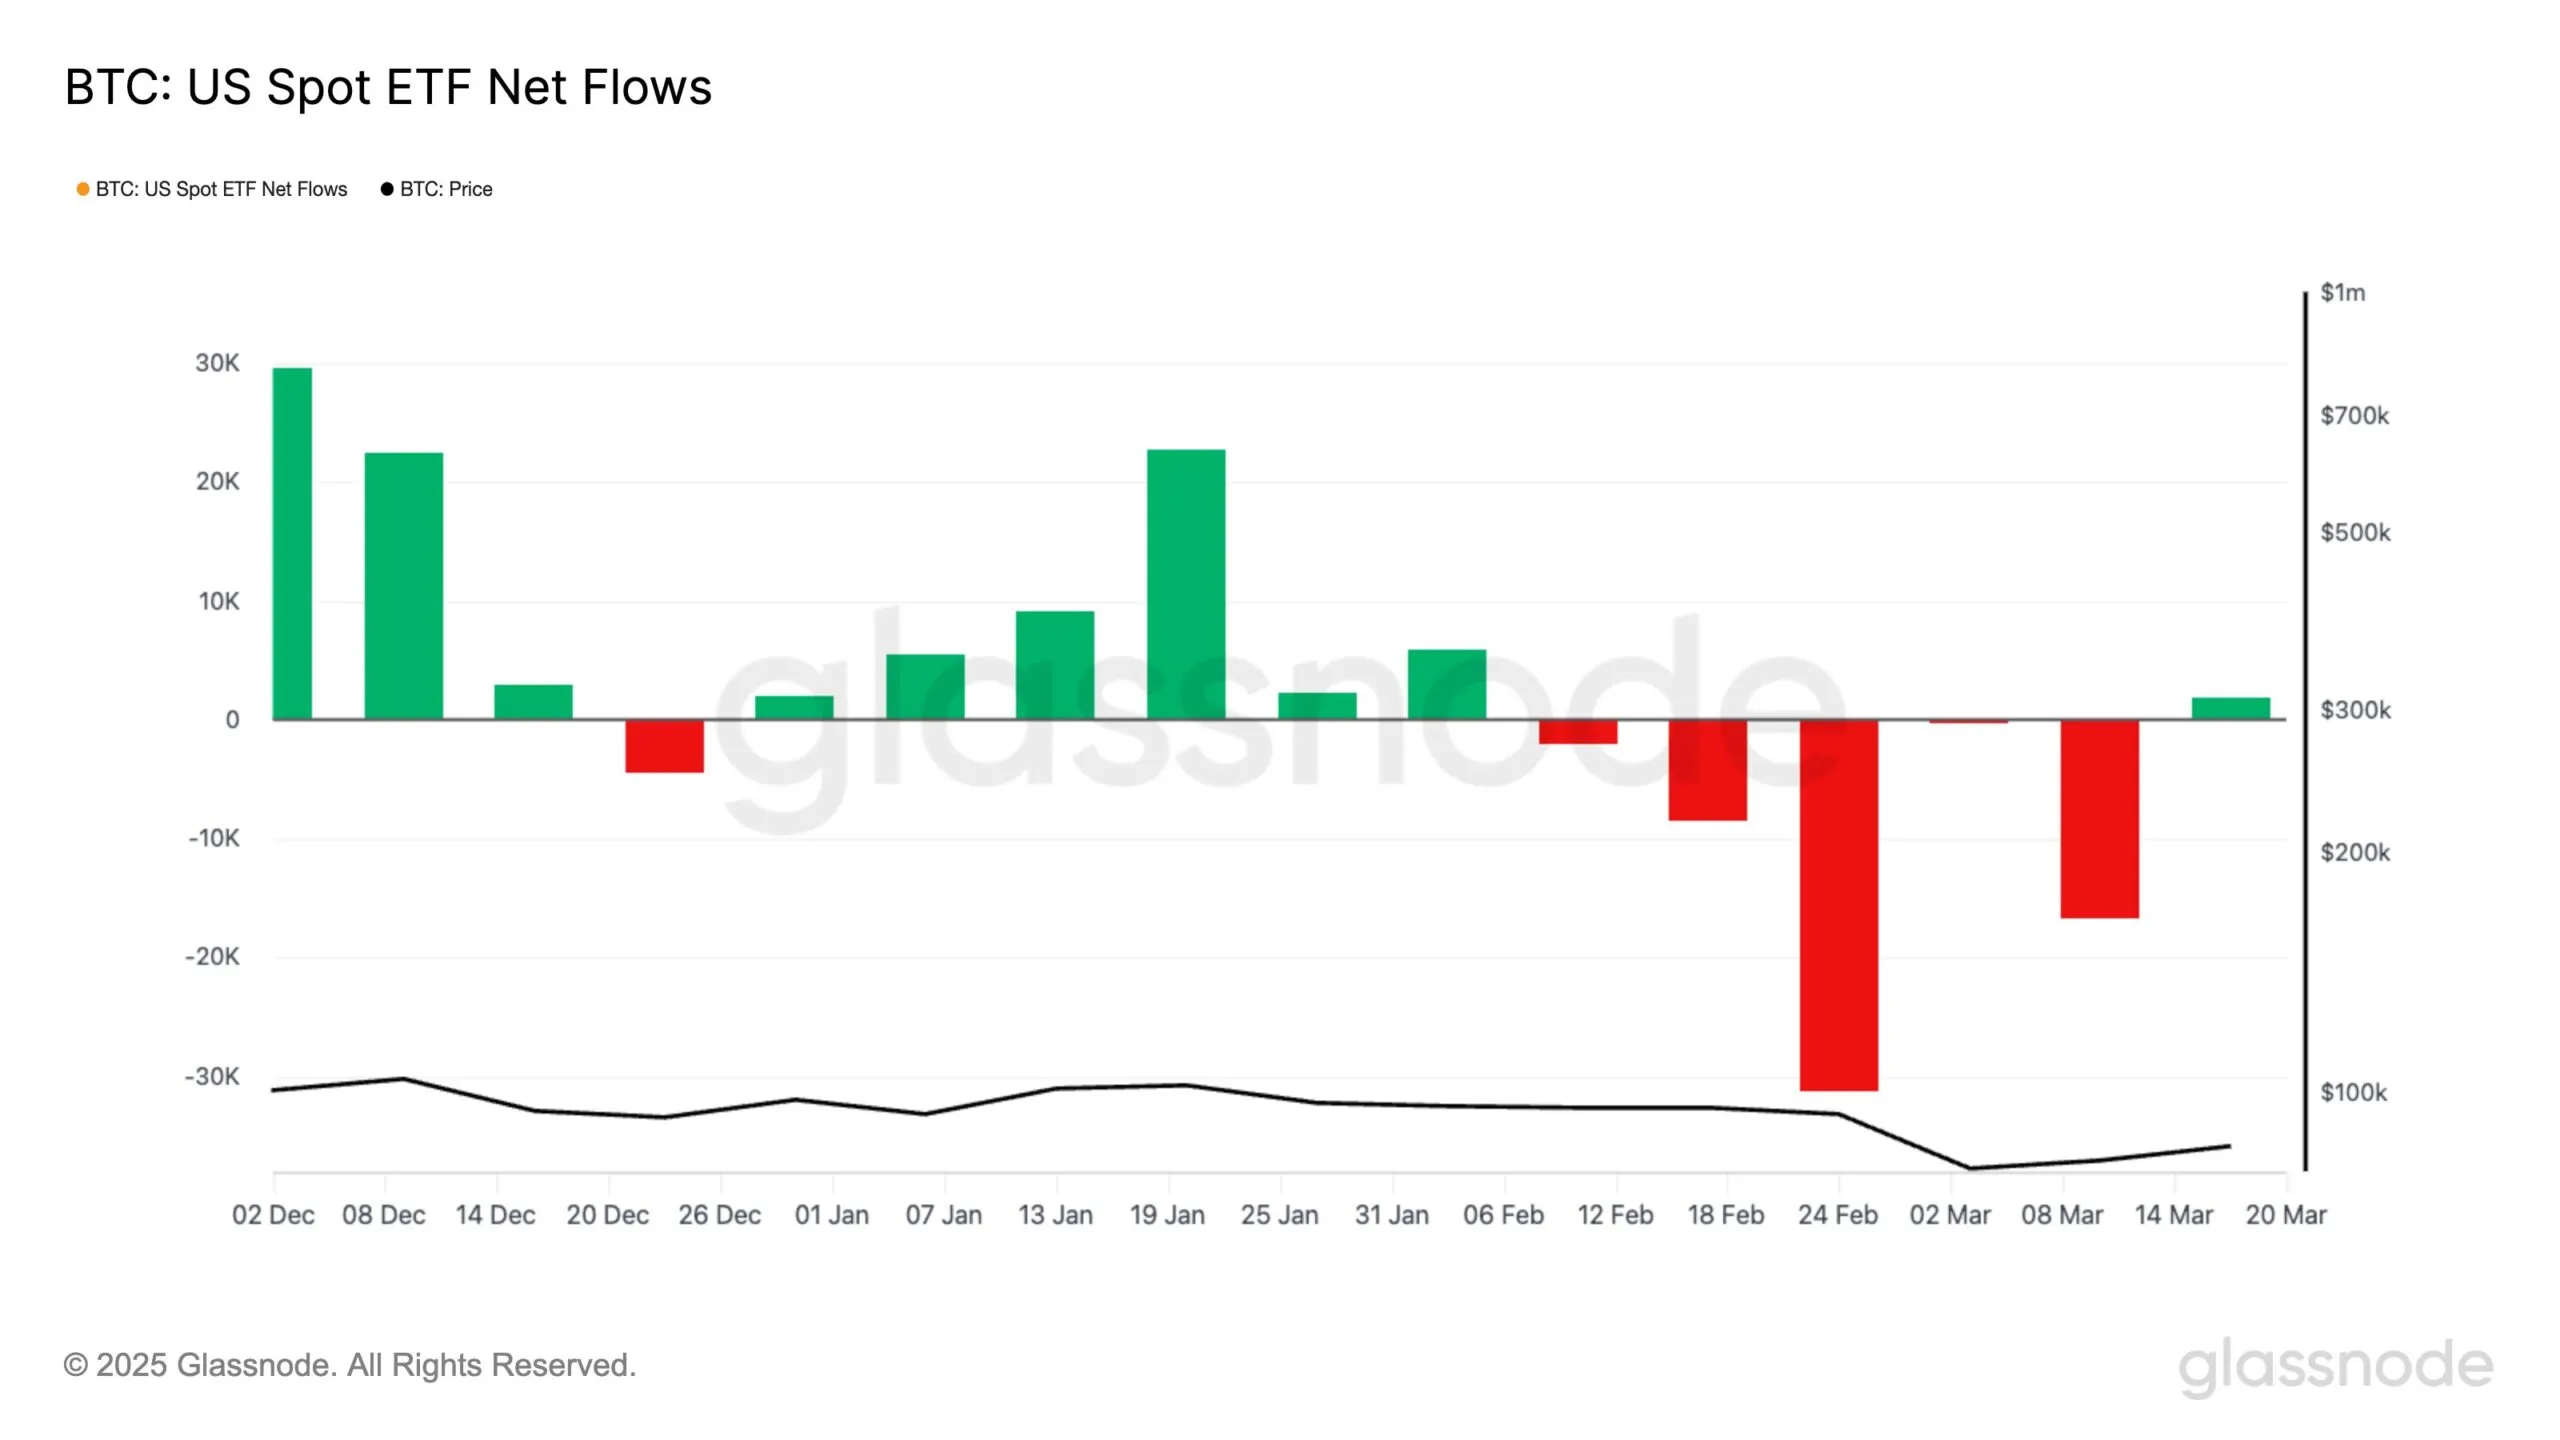
Bitcoin has also seen a positive shift in macro momentum, particularly with the recent inflows into Bitcoin Spot ETFs. Last week marked the first ETF inflows in a month, breaking a four-week streak of outflows. This change signals returning confidence among investors, particularly macrofinancial investors. The renewed interest in BTC ETFs reflects the growing demand for Bitcoin exposure in institutional portfolios.
The inflows indicate that larger investors are once again viewing Bitcoin as a valuable asset. This could be a strong signal that demand for Bitcoin is recovering, which may help propel the price further. The involvement of institutional investors could drive significant price appreciation in the coming weeks.
BTC Price Rise Is Consistent
Bitcoin is currently trading at $86,630, breaking out of a descending wedge pattern. The price is attempting to secure $86,822 as support, which will be crucial for BTC’s next move. If the support holds, Bitcoin may continue its upward trajectory towards the $89,800 resistance level.
The confirmation of the breakout will come when Bitcoin successfully flips the $89,800 resistance into support. A sustained move above this level could push the price further toward $93,625 and potentially $95,000.
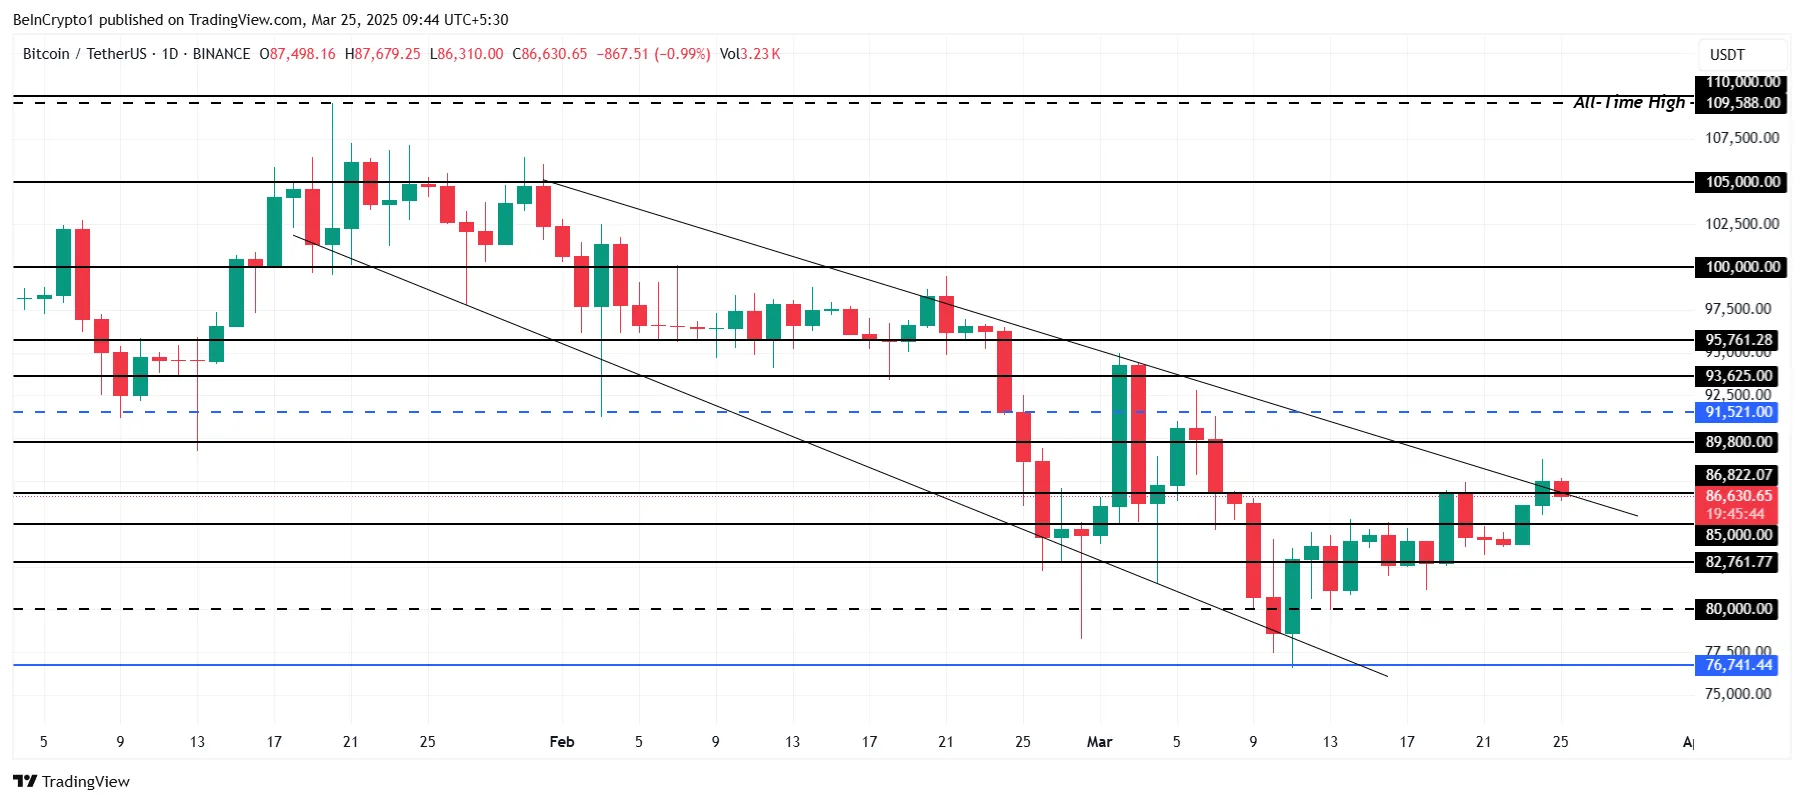
However, if Bitcoin fails to breach $89,800, it could struggle to maintain its current momentum. A consolidation below this level or a drop to $85,000 would delay the recovery, shifting the market sentiment toward caution. This would halt the progress and potentially lead to a longer consolidation phase.
Disclaimer
In line with the Trust Project guidelines, this price analysis article is for informational purposes only and should not be considered financial or investment advice. BeInCrypto is committed to accurate, unbiased reporting, but market conditions are subject to change without notice. Always conduct your own research and consult with a professional before making any financial decisions. Please note that our Terms and Conditions, Privacy Policy, and Disclaimers have been updated.

Reason to trust
![]()
Strict editorial policy that focuses on accuracy, relevance, and impartiality
Created by industry experts and meticulously reviewed
The highest standards in reporting and publishing
Strict editorial policy that focuses on accuracy, relevance, and impartiality
Morbi pretium leo et nisl aliquam mollis. Quisque arcu lorem, ultricies quis pellentesque nec, ullamcorper eu odio.
Ethereum price started a recovery wave above the $2,000 zone. ETH is now consolidating and facing hurdles near the $2,100 resistance.
- Ethereum started a recovery wave above the $2,000 level.
- The price is trading above $2,020 and the 100-hourly Simple Moving Average.
- There is a connecting bullish trend line forming with support at $2,000 on the hourly chart of ETH/USD (data feed via Kraken).
- The pair must clear the $2,080 and $2,100 resistance levels to start a decent increase.
Ethereum Price Recovers Further
Ethereum price formed a base above the $1,850 level and started a recovery wave, like Bitcoin. ETH was able to clear the $1,920 and $1,950 resistance levels.
The bulls pushed the price above the $2,000 level. Finally, the price tested the $2,100 zone. A high was formed at $2,104 and the price started a downside correction. There was a move below the $2,080 level. The price dipped below the 23.6% Fib retracement level of the upward move from the $1,980 swing low to the $2,104 high.
Ethereum price is now trading above $2,020 and the 100-hourly Simple Moving Average. There is also a connecting bullish trend line forming with support at $2,000 on the hourly chart of ETH/USD.
On the upside, the price seems to be facing hurdles near the $2,080 level. The next key resistance is near the $2,100 level. The first major resistance is near the $2,120 level. A clear move above the $2,120 resistance might send the price toward the $2,200 resistance.

An upside break above the $2,200 resistance might call for more gains in the coming sessions. In the stated case, Ether could rise toward the $2,250 resistance zone or even $2,320 in the near term.
Are Dips Supported In ETH?
If Ethereum fails to clear the $2,100 resistance, it could start another decline. Initial support on the downside is near the $2,040 level. The first major support sits near the $2,025 zone and the 61.8% Fib retracement level of the upward move from the $1,980 swing low to the $2,104 high.
A clear move below the $2,025 support might push the price toward the $2,000 support. Any more losses might send the price toward the $1,950 support level in the near term. The next key support sits at $1,880.
Technical Indicators
Hourly MACD – The MACD for ETH/USD is losing momentum in the bullish zone.
Hourly RSI – The RSI for ETH/USD is now below the 50 zone.
Major Support Level – $2,000
Major Resistance Level – $2,100

Hedera (HBAR) is up nearly 5% in the last 24 hours as it attempts to break above the $0.20 mark for the first time in 2 weeks. The recent price rally comes amid improving technical signals that hint at a potential shift in trend.
Despite the ongoing recovery, HBAR still faces key resistance levels and a bearish backdrop that has dominated in recent weeks.
Hedera BBTrend Is Recovering, But Still Negative
Hedera’s BBTrend is currently sitting at -1.85, showing a recovery from -3.44 yesterday, though it was recently as high as 0.96 two days ago.
This recent movement suggests some short-term improvement in price momentum after recent downside pressure. However, the overall trend still leans negative as Hedera struggles to sustain any lasting bullish signals.
The indicator highlights how the token is attempting to recover but remains stuck in a broader pattern of weak momentum.
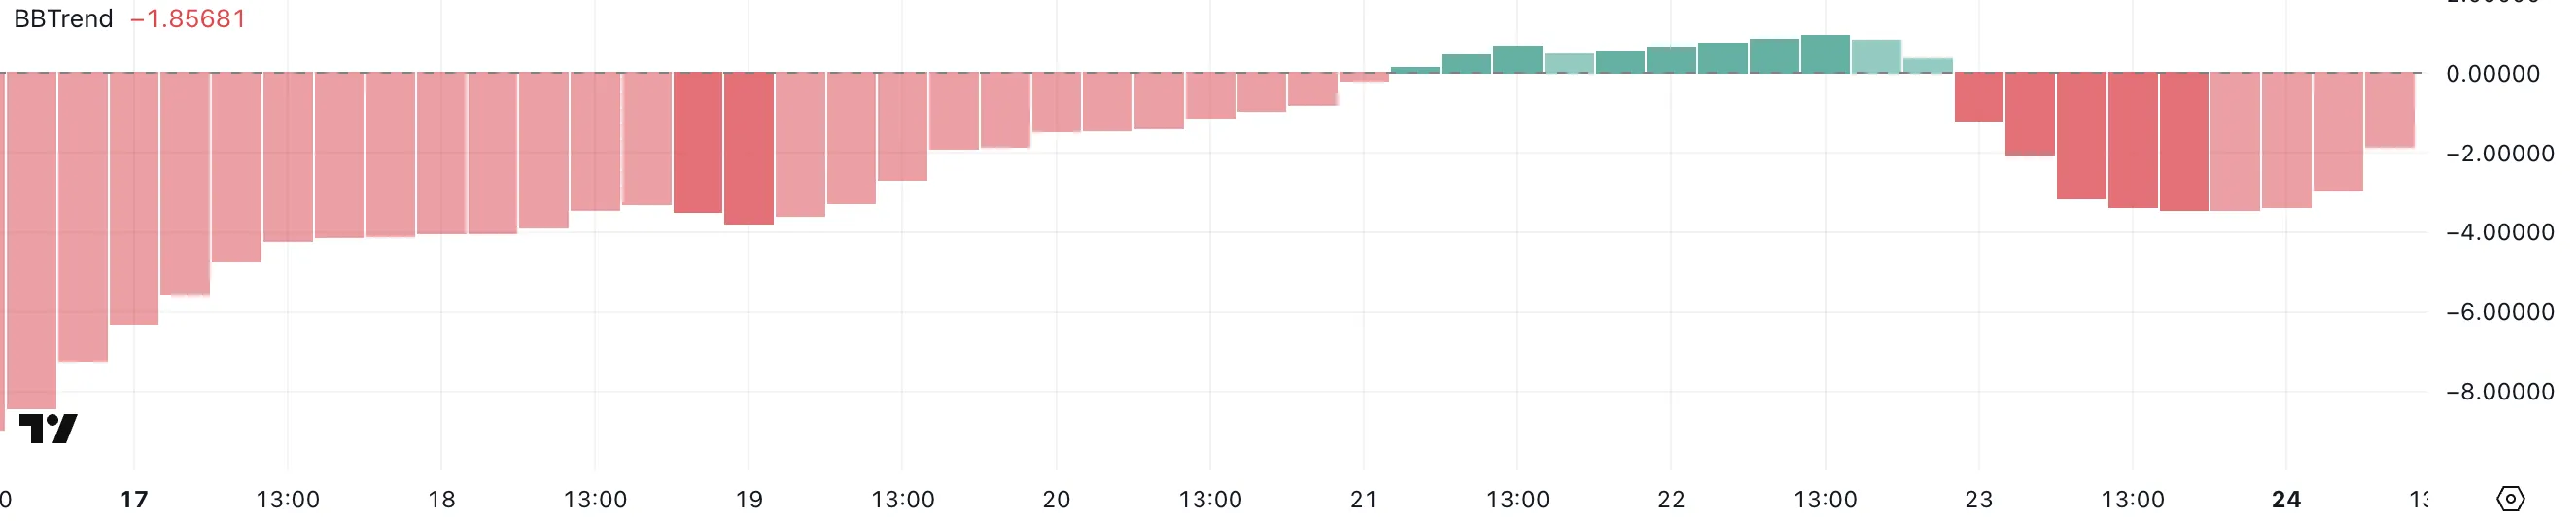
The BBTrend (Bollinger Band Trend) indicator measures how far price action deviates from the center of the Bollinger Bands, helping to assess trend strength and direction.
Typically, values above 0 suggest bullish conditions, while values below 0 point to bearish momentum. With Hedera’s BBTrend currently at -1.85, it suggests bearish pressure is still present, despite the recent bounce.
More importantly, Hedera has shown difficulty sustaining strong positive levels for an extended period – the last time BBTrend crossed above 10 was on March 6, highlighting how fleeting bullish momentum has been in recent weeks.
HBAR Ichimoku Cloud Shows The Trend Could Be Shifting, But There Are Challenges Ahead
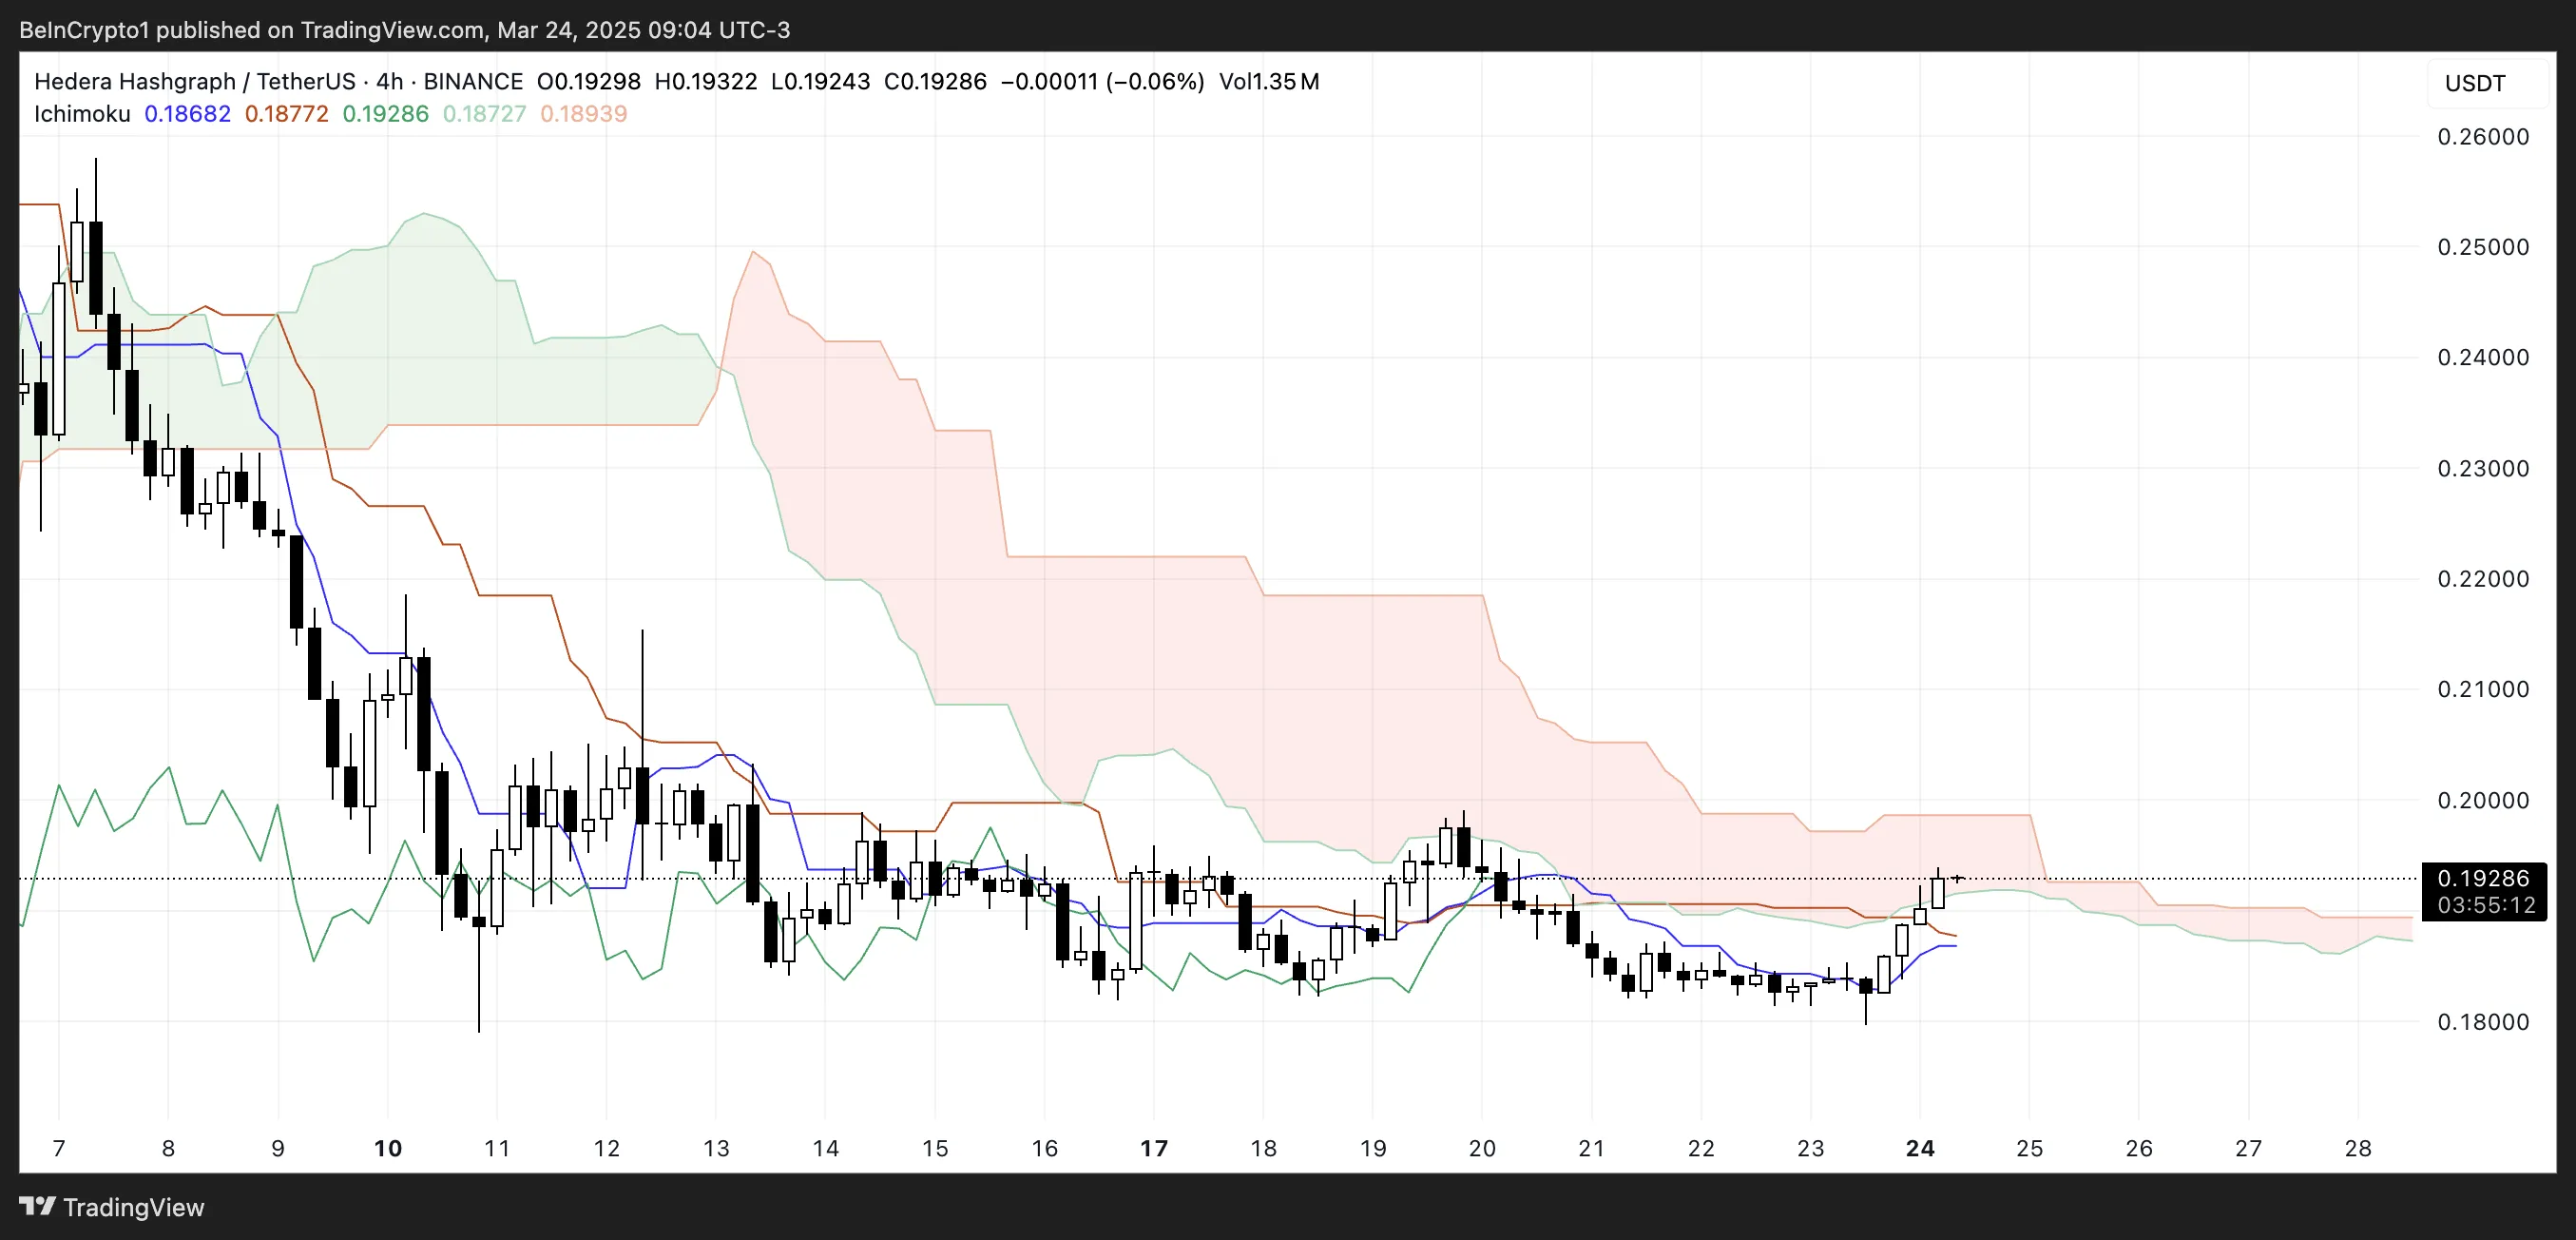
Hedera’s Ichimoku Cloud chart is showing some early signs of recovery, as the price has broken above the blue Tenkan-sen line and is now testing the bottom of the red Kumo (cloud).
The price action has moved into the cloud after trading below it for an extended period, which can be seen as a shift from bearish to more neutral conditions.
While the price attempting to climb into the cloud suggests that selling pressure is weakening, it still faces resistance from the thicker part of the Kumo just above current levels.
The cloud’s bearish (red) coloration indicates that the broader trend remains under pressure, despite the recent upside move.
The Ichimoku Cloud, or Kumo, is a multi-component indicator that highlights support, resistance, trend direction, and momentum all in one glance. When prices are below the cloud, it suggests bearish conditions, while prices above the cloud signal bullish sentiment.
Trading inside the cloud typically indicates a consolidation phase or market indecision.
In Hedera’s case, the token’s current positioning within the cloud signals that it is attempting to neutralize the recent bearish momentum but has not yet shifted into a clear bullish trend.
Until HBAR can firmly break above the upper edge of the cloud, upside potential may remain capped by resistance.
Will A Golden Cross Make Hedera Surge?
Hedera’s EMA lines are still showing a bearish setup overall as long-term EMAs continue to trend downward. However, short-term EMAs are beginning to slope upwards and could soon cross above the longer-term averages, potentially forming a golden cross.
If this bullish crossover occurs, it may trigger a stronger upward move, with the first resistance level sitting at $0.199. A break above this level could open the path for further gains toward $0.215, and if the bullish momentum accelerates, Hedera price could even aim for $0.258 in the coming sessions.
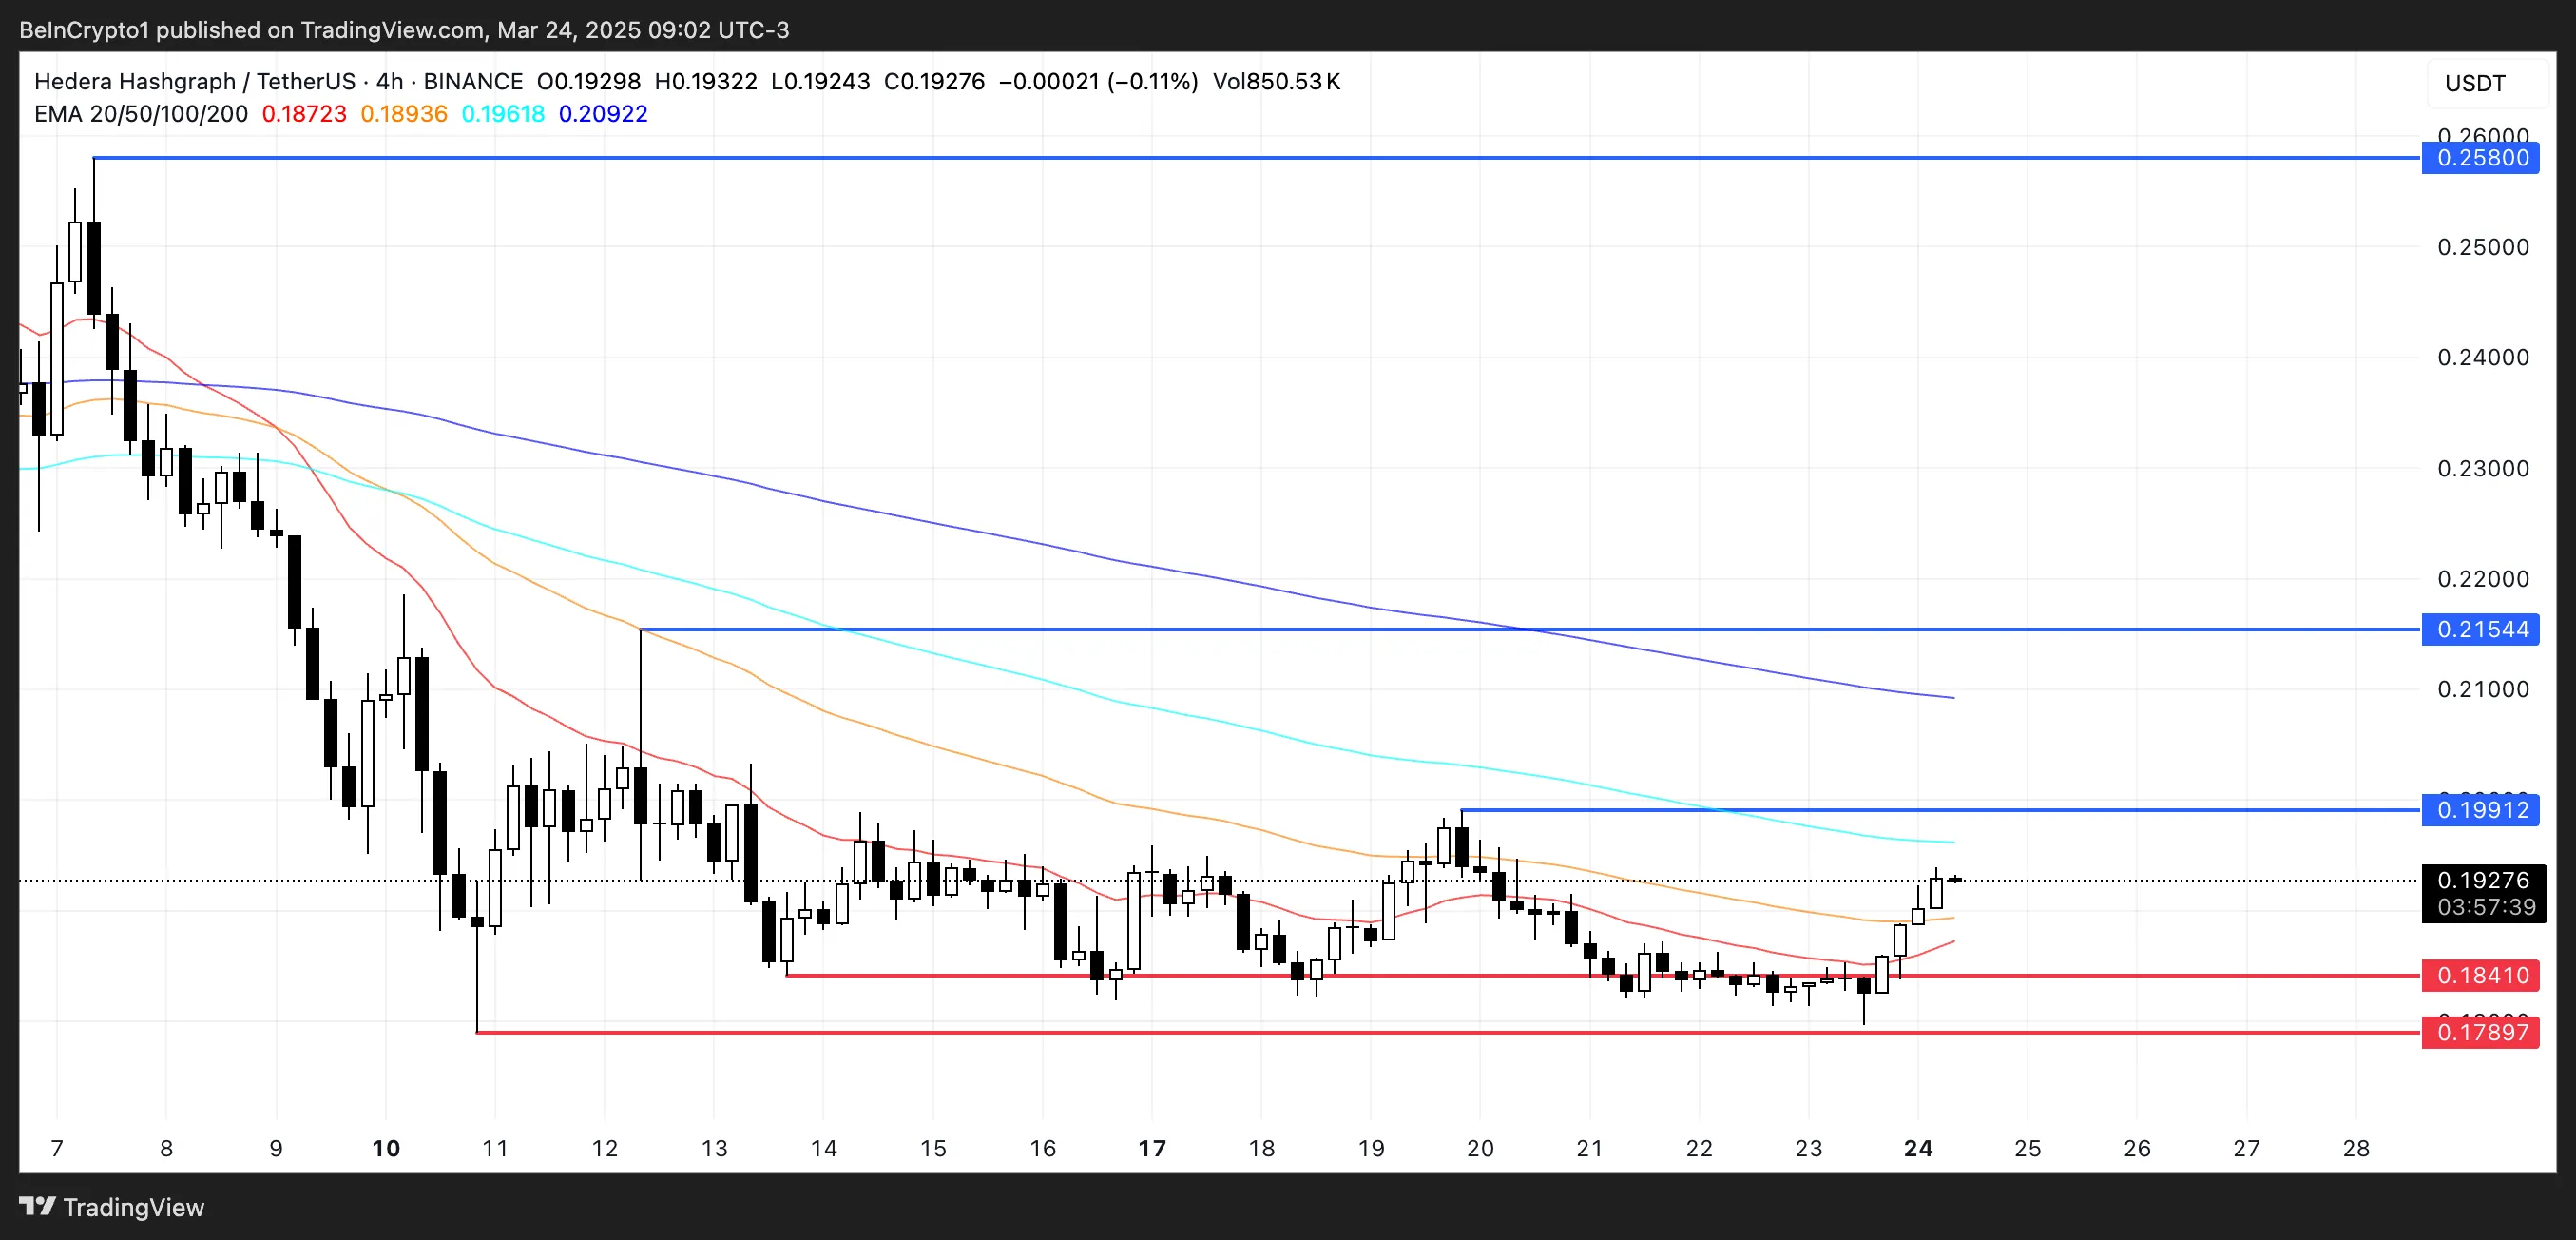
Alternatively, if the short-term upside momentum fades and the golden cross fails to materialize, bearish pressure could resume. In this scenario, HBAR may revisit key support levels at $0.184 and $0.178.
A decisive break below these levels could lead the token back under $0.17, reinforcing the bearish structure.
Disclaimer
In line with the Trust Project guidelines, this price analysis article is for informational purposes only and should not be considered financial or investment advice. BeInCrypto is committed to accurate, unbiased reporting, but market conditions are subject to change without notice. Always conduct your own research and consult with a professional before making any financial decisions. Please note that our Terms and Conditions, Privacy Policy, and Disclaimers have been updated.
Bitcoin Price Breaks Out with First Spot ETF Inflows in A Month

Ethereum Price Back Above $2,000—Breakout or Just a Temporary Bounce?
Analyst Predicts XRP Price Could Surge Above $1400 as Bull Flag Breaks
Hedera (HBAR) Shows Bearish Signals Despite Recovering 5%
Polymarket Integrates Solana, Enables Deposits With SOL

Binance Will List and Airdrop Particle Network’s PARTI Token

2.52 Million Altcoins Are Ruining Crypto’s Future

Animoca Brands Valuation Tanks 75% In Two Years, Here’s Why

Crypto exchange BingX hacked for $43 million

Are The Big Players Losing Interest?

Hong Kong’s Securities Association Tips Authorities On Crypto Self-Regulation

Coinbase cbBTC Set to go Live on Solana
2.52 Million Altcoins Are Ruining Crypto’s Future
Animoca Brands Valuation Tanks 75% In Two Years, Here’s Why
Crypto exchange BingX hacked for $43 million
Are The Big Players Losing Interest?
Hong Kong’s Securities Association Tips Authorities On Crypto Self-Regulation
Coinbase cbBTC Set to go Live on Solana
-
 Bitcoin21 hours ago
US Economic Data This Week: Key Events Shaping Bitcoin
-

 Market20 hours ago
Ethereum Supply Dips as Leverage Rises – What It Means for ETH
-
 Altcoin24 hours ago
Shiba Inu ETF Pitched By Executive, Will SHIB Price Rally Begin?
-
 Altcoin23 hours ago
Why Is Solana Price Up 7% Today?
-
 Altcoin18 hours ago
Ripple Coin and Bitcoin Dominate the $644M Weekly Inflow
-
 Market22 hours ago
Why “Easy Money” in Crypto is Gone
-

 Altcoin22 hours ago
XRP For Real Estate? Big Company in Japan Says Yes!
-

 Market21 hours ago
Ethereum Price Teases a Breakout—Can This Spark a Momentum Shift