
Market
Solana Price Attempts Recovery, Nears $120, But Needs A Push

Solana (SOL) has experienced significant volatility recently, with a marked decline following its failure to breach the $150 mark.
Over the last few days, Solana has struggled to break through certain resistance levels that have been affected by broader market trends. However, investor optimism appears to be driving recent price movements as SOL nears $120.
Solana Gains Support
One of the indicators showing promise for Solana’s recovery is its velocity, which measures the pace at which tokens are being circulated. The velocity has reached a monthly high, signaling that the transaction of supply is accelerating.
Amidst recovering price, there’s a noticeable increase in the velocity at which tokens are being transacted, highlighting greater demand. Velocity and price tend to move in tandem. Typically, when both price and velocity rise together, it’s considered a bullish signal — a trend currently seen with Solana.

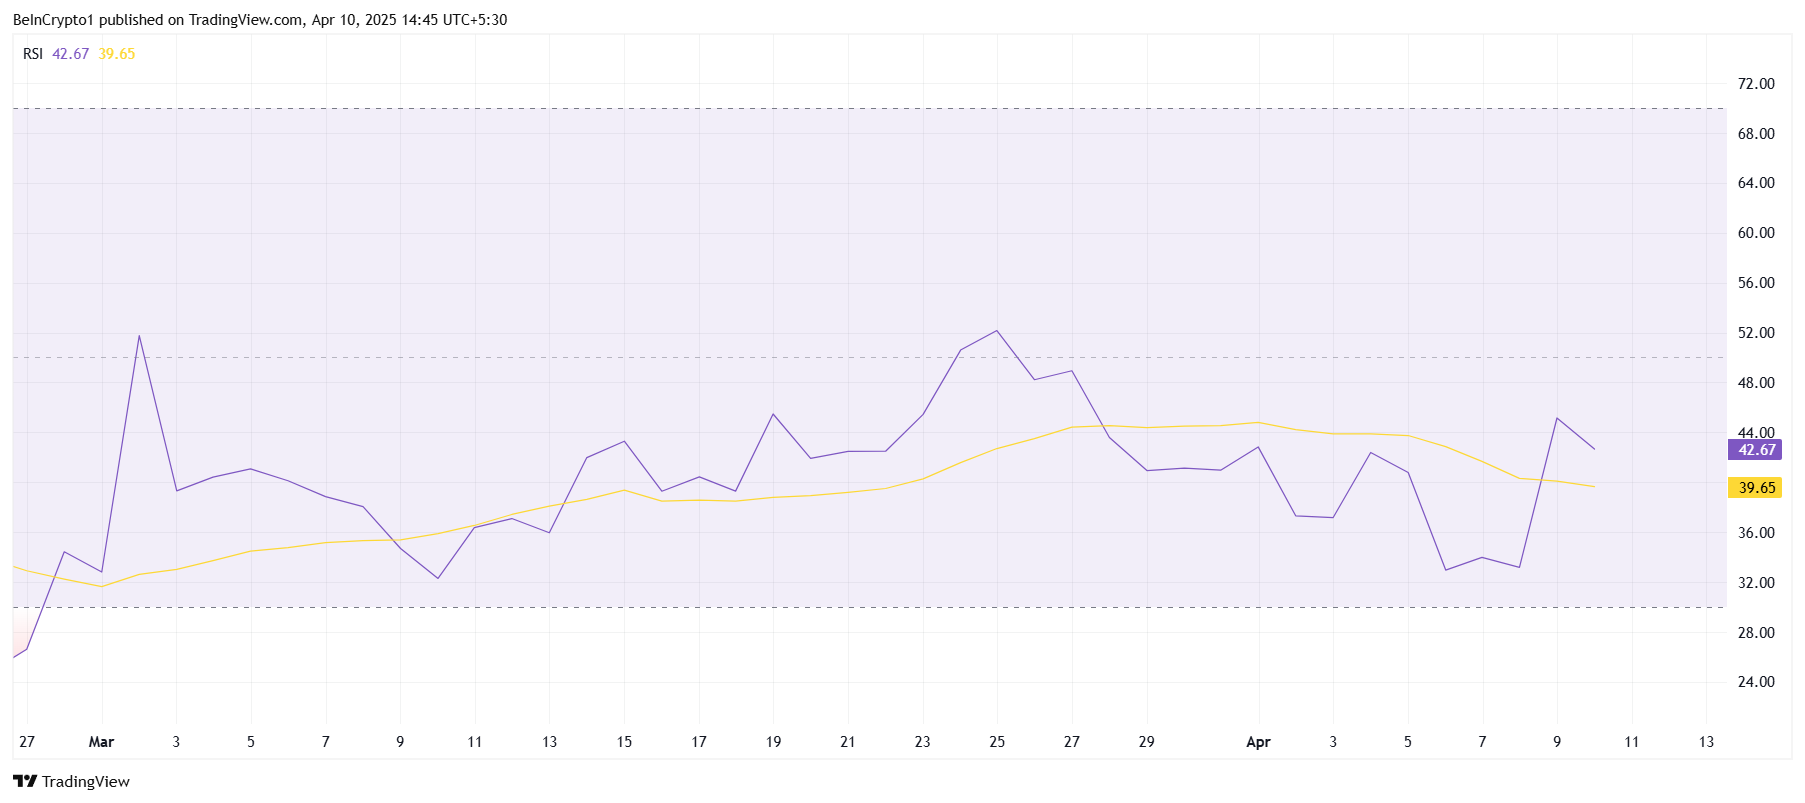
However, despite the favorable signs from the velocity, Solana’s macro momentum remains relatively weak. The Relative Strength Index (RSI) is still stuck in the bearish zone, under the neutral 50.0 mark.
While the broader market has seen some rallies, Solana’s RSI indicates a lack of significant buying momentum. This suggests that while some positive movement is occurring, broader macroeconomic factors may still be playing a limiting role.
The persistent bearish sentiment reflected in the RSI implies that Solana’s recovery may face continued challenges. Despite occasional price bounces, the altcoin has not yet experienced enough momentum to break free from the bearish pressure.
SOL Price Attempts Recovery
Solana’s price has risen by 8.2% in the past 24 hours, trading at $114. While it is showing signs of recovery, the altcoin remains under the key psychological price of $120. Beyond it lies a crucial resistance of $123, which has proven challenging in recent days.
If the bullish momentum continues, Solana could rise past $120 and aim for $123. Securing it as support would likely lead to further gains, pushing Solana toward the $135 mark. Investor confidence and continued supply distribution could support this upward movement.
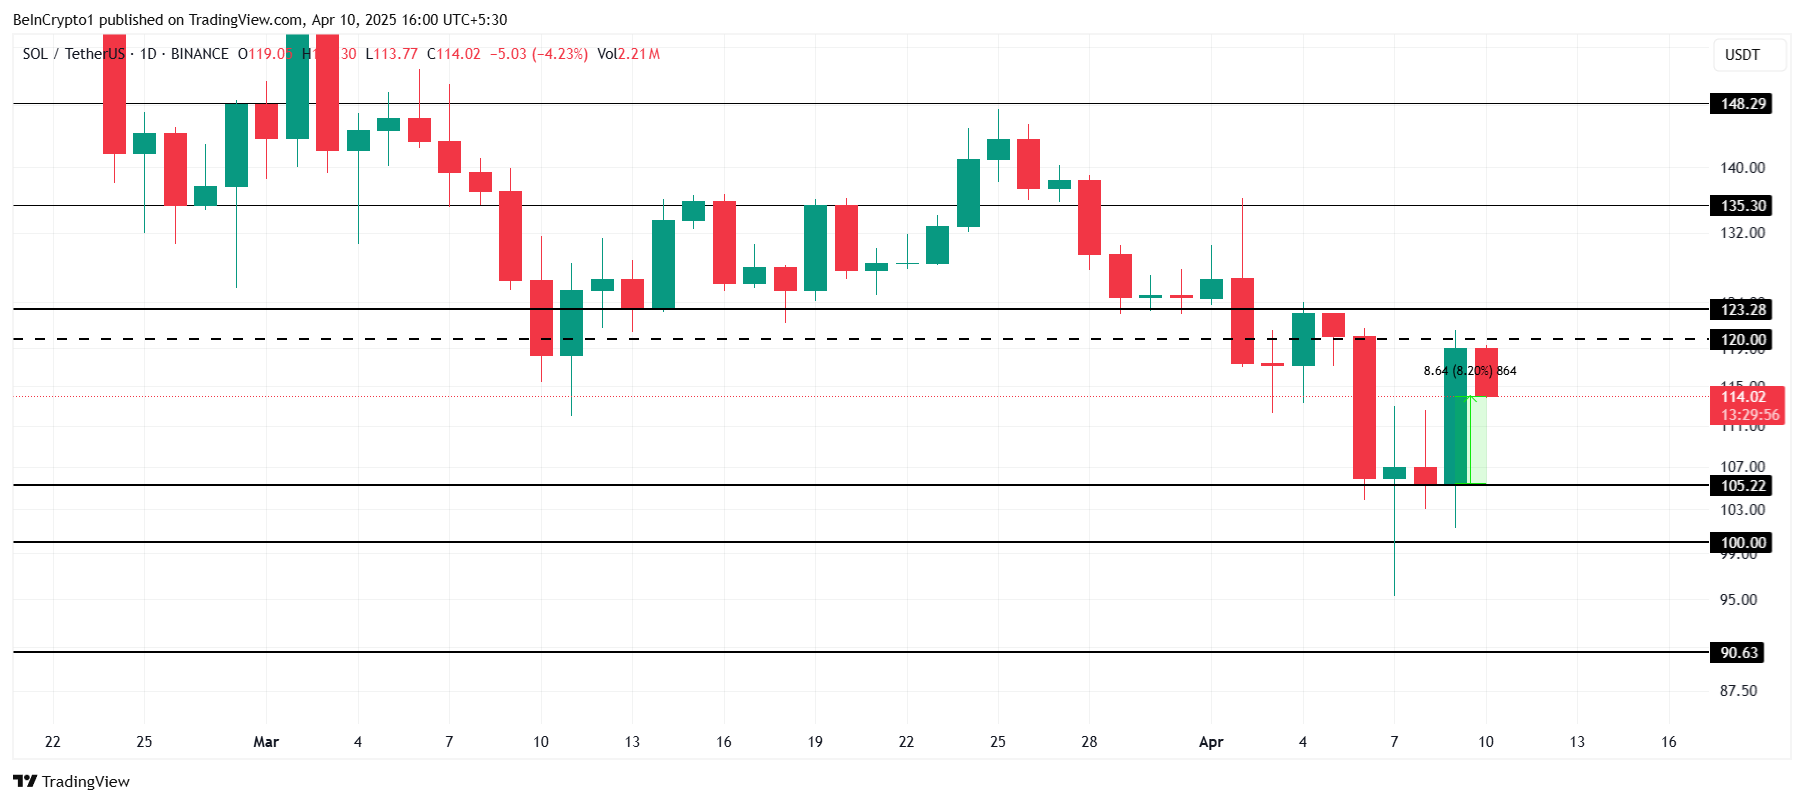
However, if Solana fails to breach the $123 resistance, the price may retreat toward $105 or even lower. A drop below $105 could signal a deeper decline, with the altcoin potentially heading toward the $100 mark. This would invalidate the recent bullish outlook, extending the correction phase for Solana.
Disclaimer
In line with the Trust Project guidelines, this price analysis article is for informational purposes only and should not be considered financial or investment advice. BeInCrypto is committed to accurate, unbiased reporting, but market conditions are subject to change without notice. Always conduct your own research and consult with a professional before making any financial decisions. Please note that our Terms and Conditions, Privacy Policy, and Disclaimers have been updated.


Reason to trust
![]()
Strict editorial policy that focuses on accuracy, relevance, and impartiality
Created by industry experts and meticulously reviewed
The highest standards in reporting and publishing
Strict editorial policy that focuses on accuracy, relevance, and impartiality
Morbi pretium leo et nisl aliquam mollis. Quisque arcu lorem, ultricies quis pellentesque nec, ullamcorper eu odio.
Ethereum price started a fresh increase above the $1,580 zone. ETH is now consolidating gains and might aim for more gains above $1,665.
- Ethereum started a decent increase above the $1,580 and $1,620 levels.
- The price is trading below $1,620 and the 100-hourly Simple Moving Average.
- There is a new connecting bearish trend line forming with resistance at $1,640 on the hourly chart of ETH/USD (data feed via Kraken).
- The pair could start a fresh increase if it clears the $1,665 resistance zone.
Ethereum Price Gains Pace
Ethereum price formed a base above $1,500 and started a fresh increase, like Bitcoin. ETH gained pace for a move above the $1,550 and $1,580 resistance levels.
The bulls even pumped the price above the $1,620 zone. A high was formed at $1,668 and the price recently started a downside correction. There was a move below the $1,650 support zone. The price dipped below the 23.6% Fib retracement level of the upward move from the $1,482 swing low to the $1,668 high.
Ethereum price is now trading below $1,600 and the 100-hourly Simple Moving Average. On the upside, the price seems to be facing hurdles near the $1,640 level. There is also a new connecting bearish trend line forming with resistance at $1,640 on the hourly chart of ETH/USD.

The next key resistance is near the $1,665 level. The first major resistance is near the $1,680 level. A clear move above the $1,680 resistance might send the price toward the $1,720 resistance. An upside break above the $1,720 resistance might call for more gains in the coming sessions. In the stated case, Ether could rise toward the $1,750 resistance zone or even $1,800 in the near term.
More Losses In ETH?
If Ethereum fails to clear the $1,640 resistance, it could start a downside correction. Initial support on the downside is near the $1,600 level. The first major support sits near the $1,575 zone and the 50% Fib retracement level of the upward move from the $1,482 swing low to the $1,668 high.
A clear move below the $1,575 support might push the price toward the $1,550 support. Any more losses might send the price toward the $1,520 support level in the near term. The next key support sits at $1,480.
Technical Indicators
Hourly MACD – The MACD for ETH/USD is losing momentum in the bullish zone.
Hourly RSI – The RSI for ETH/USD is now above the 50 zone.
Major Support Level – $1,575
Major Resistance Level – $1,665

The MANTRA (OM) token suffered a catastrophic price collapse on April 13, plummeting over 90% in under an hour and wiping out more than $5.5 billion in market capitalization.
The sudden crash, which took OM from a high of $6.33 to below $0.50, has drawn comparisons to the infamous Terra LUNA meltdown, with thousands of holders reportedly losing millions.
Why did MANTRA (OM) Crash?
Multiple reports suggest that the trigger is a large token deposit linked to a wallet allegedly associated with the MANTRA team. Onchain data shows a deposit of 3.9 million OM tokens to OKX, sparking concerns about a possible incoming sell-off.
Given that the MANTRA team reportedly controls close to 90% of the token’s total supply, the move raised immediate red flags about potential insider activity and price manipulation.

The OM community has long expressed concerns around transparency. Allegations have surfaced over the past year suggesting the team manipulated the token’s price through market makers, changed tokenomics, and repeatedly delayed a community airdrop.
When the OKX deposit was spotted, fears that insiders might be preparing to offload were amplified.
Reports also indicate that MANTRA may have engaged in undisclosed over-the-counter (OTC) deals, selling tokens at steep discounts — in some cases at 50% below market value.
As OM’s price rapidly declined, these OTC investors were thrown into losses, which allegedly sparked a mass exodus as panic selling took hold. The chain reaction triggered stop-loss orders and forced liquidations on leveraged positions, compounding the collapse.
The MANTRA team has denied all allegations of a rug pull and maintains that its members did not initiate the sell-off.
In a public statement, co-founder John Patrick Mullin said the team is investigating what went wrong and is committed to finding a resolution.
The project’s official Telegram channel was locked during the fallout, which added to community frustration and speculation.
“We have determined that the OM market movements were triggered by reckless forced closures initiated by centralized exchanges on OM account holders. The timing and depth of the crash suggest that a very sudden closure of account positions was initiated without sufficient warning or notice,” wrote MANTRA founder JP Mullin.
If OM fails to recover, this would mark one of the largest collapses in crypto history since the Terra LUNA crash in 2022.
Thousands of affected holders are now demanding transparency and accountability from the MANTRA team, while the broader crypto community watches closely for answers.
Disclaimer
In adherence to the Trust Project guidelines, BeInCrypto is committed to unbiased, transparent reporting. This news article aims to provide accurate, timely information. However, readers are advised to verify facts independently and consult with a professional before making any decisions based on this content. Please note that our Terms and Conditions, Privacy Policy, and Disclaimers have been updated.
Token unlocks continue to shape the crypto market, influencing wider sentiment and liquidity. This week, three projects—StarkNet (STRK), TRUMP, and Polyhedra Network (ZKJ)—are scheduled for major unlocks.
Both TRUMP and Polyhedra are about to unlock tokens worth more than 20% of their market cap. Here’s what to know.
TRUMP
Unlock Date: April 18
Number of Tokens to be Unlocked: 40 million TRUMP (4.00% of Max Supply)
Current Circulating Supply: 199 million TRUMP
US President Donald Trump’s OFFICIAL TRUMP meme coin is about to unlock new tokens worth 20% of its market cap. On April 18, 40 million TRUMP tokens will be released, with a combined market value of $338.57 million.
Of this, 36 million tokens (10%) are assigned to Creators & CIC Digital 1, while 4 million tokens (10%) go to Creators & CIC Digital 4.
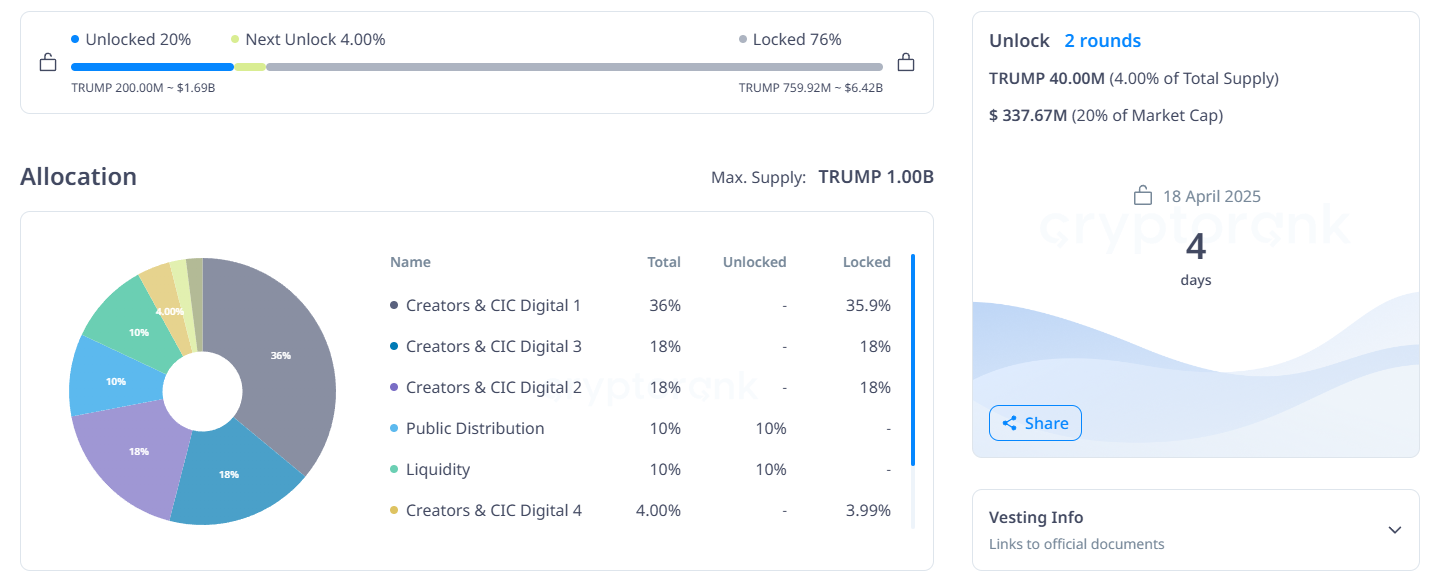
Overall, with such a massive amount unlocked, this release is likely to impact volatility. TRUMP is currently down more than 30% this month.
StarkNet (STRK)
Unlock Date: April 15
Number of Tokens to be Unlocked: 127.60 million STRK (1.28% of Max Supply)
Current Circulating Supply: 2.9 billion STRK
StarkNet is an Ethereum Layer 2 scaling solution built with STARK-based zero-knowledge rollups. Its role is to enhance throughput and reduce gas costs. STRK is the network’s native utility and governance token.
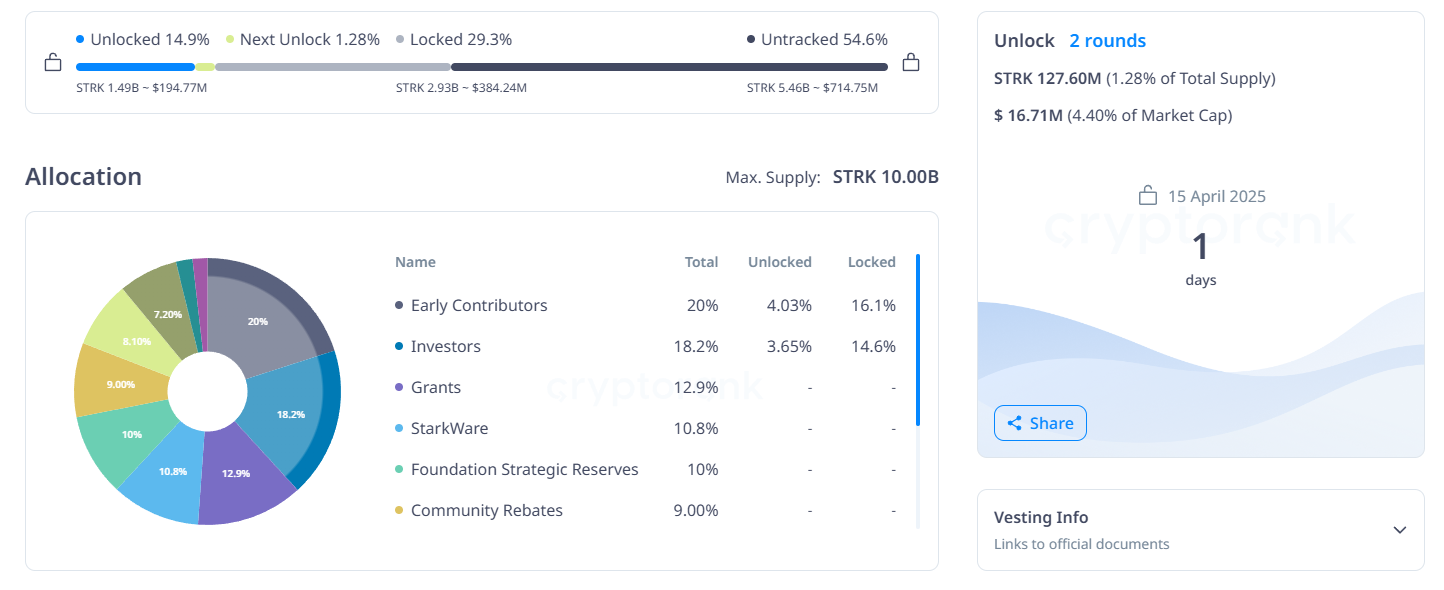
On April 15, 127.60 million STRK tokens will be unlocked, representing $16.71 million in value—roughly 4.40% of the current market cap. Of this, 66.92 million tokens (3.34%) are allocated to early contributors, and 60.68 million tokens (3.34%) to investors.
Also, STRK has declined over 26% in the past month and is currently down nearly 100% from its February 2024 all-time high.
Polyhedra Network (ZKJ)
Unlock Date: April 19
Number of Tokens to be Unlocked: 15.50 million ZKJ (1.55% of Max Supply)
Current Circulating Supply: 60 million ZKJ
Polyhedra Network delivers blockchain interoperability through its zkBridge technology. It enables cross-chain messaging, asset transfers, and storage with zero-knowledge proofs.
The April 19 unlock includes 15.50 million ZKJ tokens, valued at $35.16 million—25.7% of ZKJ’s market cap.
The release consists of 8.47 million tokens (2.65%) for ecosystem and network incentives and 2.61 million tokens (1.74%) for community, airdrop, and marketing.
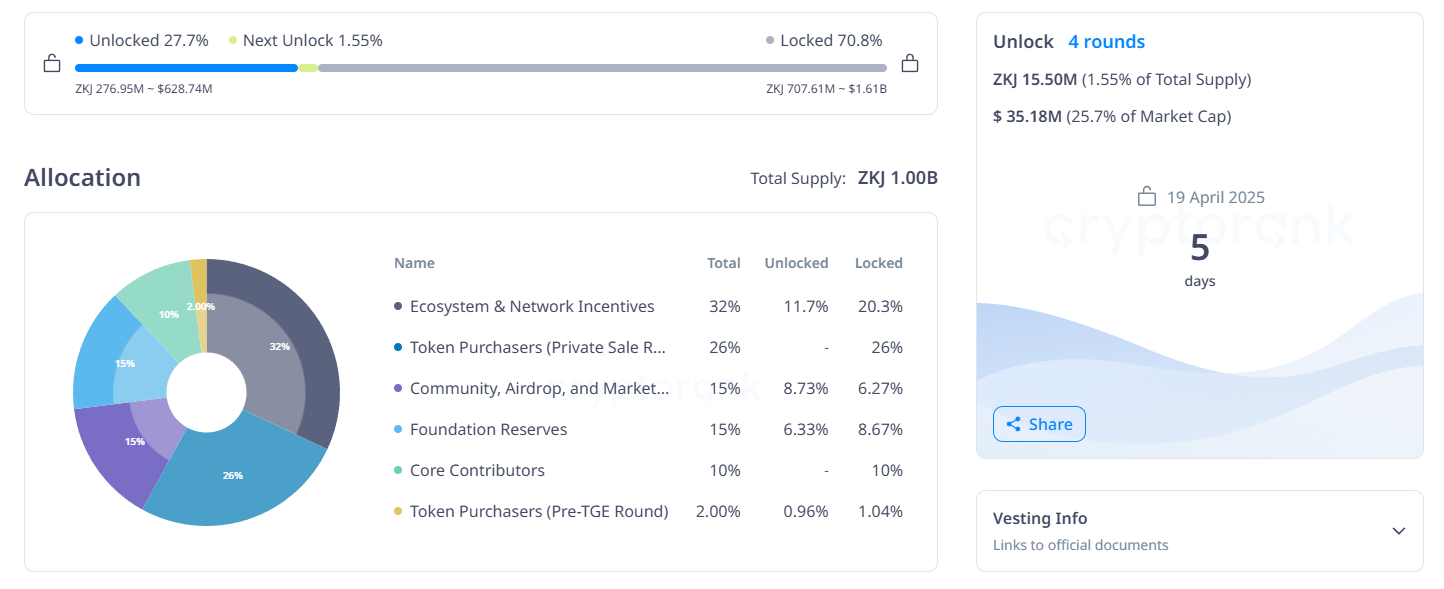
Meanwhile, 3.61 million tokens will be allocated for foundation reserves, and 800,000 tokens for pre-TGE token purchasers.
Also, ZKJ is currently up 10% over the past month.
Overall, this week’s unlocks collectively introduces over $400 million worth of new tokens into the market. While some projects face downward pressure, others like ZKJ show positive momentum.
As always, traders should monitor token distribution closely to assess potential shifts in market sentiment and liquidity.
Disclaimer
In adherence to the Trust Project guidelines, BeInCrypto is committed to unbiased, transparent reporting. This news article aims to provide accurate, timely information. However, readers are advised to verify facts independently and consult with a professional before making any decisions based on this content. Please note that our Terms and Conditions, Privacy Policy, and Disclaimers have been updated.

Ethereum Price Steadies After Increase—Now Eyes More Gains Ahead

MANTRA’s OM Token Crashes 90% Amid Insider Dump Allegations
Mantra Team Responds As The OM Token Price Crashes Over 80% In 24 Hours

Ethereum Price Eyes Rally To $4,800 After Breaking Key Resistance

3 Token Unlocks for This Week: TRUMP, STRK, ZKJ
Hackers are Targeting Atomic and Exodus Wallets

2.52 Million Altcoins Are Ruining Crypto’s Future

Animoca Brands Valuation Tanks 75% In Two Years, Here’s Why

Crypto exchange BingX hacked for $43 million

Are The Big Players Losing Interest?

Hong Kong’s Securities Association Tips Authorities On Crypto Self-Regulation

Coinbase cbBTC Set to go Live on Solana
2.52 Million Altcoins Are Ruining Crypto’s Future
Animoca Brands Valuation Tanks 75% In Two Years, Here’s Why
Crypto exchange BingX hacked for $43 million
Are The Big Players Losing Interest?
Hong Kong’s Securities Association Tips Authorities On Crypto Self-Regulation
Coinbase cbBTC Set to go Live on Solana
-
Altcoin6 hours ago
Mantra Team Responds As The OM Token Price Crashes Over 80% In 24 Hours
-
 Market11 hours ago
3 Token Unlocks for This Week: TRUMP, STRK, ZKJ
-

 Bitcoin18 hours ago
CryptoQuant CEO Says Bitcoin Bull Cycle Is Over, Here’s Why
-

 Market17 hours ago
DOGE Spot Outflows Exceed $120 Million in April
-
 Market12 hours ago
Hackers are Targeting Atomic and Exodus Wallets
-

 Market19 hours ago
XRP Golden Cross Creates Bullish Momentum: Is $2.50 Next?
-

 Market18 hours ago
PI Coin Recovers 80% From All-time Low — Will It Retake $1?
-

 Ethereum17 hours ago
Ethereum Reclaims Key Support At $1,574, Here’s The Next Price Target