
Market
Solana ETF Faces Delay Amid SEC’s Security Label Concerns

Solana (SOL) remains under the “security” label imposed by the U.S. SEC, which likely led to the removal of VanEck and 21Shares’ 19b-4 forms from the Chicago Board Options Exchange (Cboe) website.
In June 2023, the regulator classified 12 tokens, including SOL, as securities. Some of the projects resisted the SEC’s claims.
SEC Questions SOL Token’s Security Status
A source close to the matter told a news site that the US SEC approached prospective issuers and expressed concerns over SOL’s potential security classification. This led to the SEC and the Cboe not filing the 19b-4s forms to the Federal Register.
The submission of the 19b-4 filings would have initiated the approval process. Notably, these forms are critical, outlining the requirements and disclosures necessary for listing an ETF for trading on a stock exchange. The 19b-4s qualifies the S-1 registration statements to go effective.
Indeed, BeInCrypto reported that the 19b-4 forms for Solana ETF filings disappeared from the Cboe website. As it stands, VanEck’s S-1 registration statement for its Solana ETF still appears on the SEC’s filing system, EDGAR. However, 21Shares’ S-1 registration statement filing is no longer present in search results, but the direct link remains functional.
Read more: Solana ETF Explained: What It Is and How It Works
This development shows the SEC’s ongoing caution, given its previous stance that Solana might be a security. Peer cryptocurrencies like Bitcoin (BTC) and Ethereum (ETH) have approved ETFs (exchange-traded funds). However, the likelihood of Solana ETFs being approved under the current administration remains low. Some experts say it might not happen until 2025, if at all.
“Solana ETF not happening anytime soon under the current administration,” President of the ETF Store, Nate Geraci, said.
Noteworthy, the US SEC is yet to publish its notice formally.
US to Lag Behind in Solana ETF as SEC Needs More Convincing
The recent events align with statements from Hester Pierce, alias ‘crypto mom,’ one of the SEC Commissioners. Pierce said the regulator would need more convincing before approving a Solana ETF. She cited what the SEC thinks is a security and what is not.
The stance traces back to June 2023, when the US SEC branded 12 tokens as securities in the exchanges’ lawsuits. These were Solana’s SOL, Cardano (ADA), Polygon (MATIC), Filecoin (FIL), Cosmos (ATOM), Sandbox (SAND), Decentraland (MANA), Algorand (ALGO), Axie Infinity (AXS), Coti (COTI), and Binance’s BUSD and BNB tokens.
“I mean, the SEC literally alleged SOL to be a security back in June 2023 when it sued Coinbase so this should not be a surprise,” attorney Fred Rispoli commented.
Per the regulator, these tokens have been “offered and sold as investment contracts and, therefore, as securities” since inception. The assertion that crypto assets are offered as an “investment contract” appears across the filing for each crypto asset mentioned, making it the de facto argument for what qualifies as securities.
Read more: What Is Solana (SOL)?
The regulator’s filing gave 53 pages worth of context, dissecting each of the 12 crypto assets mentioned. The latest stance against Solana marks another one of the SEC’s moves, which have been termed regulation by enforcement. Amidst this setback, crypto enthusiasts already see the US lagging in Solana ETF issuance.
“Canada will win again with a SOL ETF,” said David Tawil, co-founder and president of ProChain Capital.
Disclaimer
In adherence to the Trust Project guidelines, BeInCrypto is committed to unbiased, transparent reporting. This news article aims to provide accurate, timely information. However, readers are advised to verify facts independently and consult with a professional before making any decisions based on this content. Please note that our Terms and Conditions, Privacy Policy, and Disclaimers have been updated.


Reason to trust
![]()
Strict editorial policy that focuses on accuracy, relevance, and impartiality
Created by industry experts and meticulously reviewed
The highest standards in reporting and publishing
Strict editorial policy that focuses on accuracy, relevance, and impartiality
Morbi pretium leo et nisl aliquam mollis. Quisque arcu lorem, ultricies quis pellentesque nec, ullamcorper eu odio.
Ethereum price failed to recover above $1,620 and dropped below $1,500. ETH is now consolidating losses and might face resistance near the $1,520 zone.
- Ethereum failed to stay above the $1,600 and $1,550 levels.
- The price is trading below $1,550 and the 100-hourly Simple Moving Average.
- There is a connecting bearish trend line forming with resistance at $1,520 on the hourly chart of ETH/USD (data feed via Kraken).
- The pair remains at risk of more losses if it fails to clear the $1,410 resistance zone.
Ethereum Price Recovery Fades
Ethereum price failed to stay above the $1,620 support zone and extended losses, like Bitcoin. ETH declined heavily below the $1,550 and $1,520 levels.
The bears even pushed the price below the $1,450 level. A low was formed at $1,384 and the price recently corrected some losses. There was a move above the $1,410 level. The price climbed above the 23.6% Fib retracement level of the downward move from the $1,617 swing high to the $1,384 low.
However, the bears are active near the $1,450 zone. Ethereum price is now trading below $1,500 and the 100-hourly Simple Moving Average. On the upside, the price seems to be facing hurdles near the $1,475 level.
The next key resistance is near the $1,500 level or the 50% Fib retracement level of the downward move from the $1,617 swing high to the $1,384 low. The first major resistance is near the $1,520 level. There is also a connecting bearish trend line forming with resistance at $1,520 on the hourly chart of ETH/USD.

A clear move above the $1,520 resistance might send the price toward the $1,560 resistance. An upside break above the $1,560 resistance might call for more gains in the coming sessions. In the stated case, Ether could rise toward the $1,620 resistance zone or even $1,650 in the near term.
Another Decline In ETH?
If Ethereum fails to clear the $1,520 resistance, it could start another decline. Initial support on the downside is near the $1,410 level. The first major support sits near the $1,385 zone.
A clear move below the $1,385 support might push the price toward the $1,320 support. Any more losses might send the price toward the $1,240 support level in the near term. The next key support sits at $1,120.
Technical Indicators
Hourly MACD – The MACD for ETH/USD is gaining momentum in the bearish zone.
Hourly RSI – The RSI for ETH/USD is now below the 50 zone.
Major Support Level – $1,410
Major Resistance Level – $1,520

The crypto market is facing massive volatility today, and amid this noise, some meme coins are able to pick up pace on recovery. One such coin is said to have ties with Tesla founder and US Department of Government Efficiency (DOGE) head Elon Musk.
BeInCrypto has analyzed two other meme coins for investors to watch and note which direction they are taking.
Retard Finder Coin (RFC)
- Launch Date – March 2025
- Total Circulating Supply – 961.43 Million RFC
- Maximum Supply – 1 Billion RFC
- Fully Diluted Valuation (FDV) – $39.83 Million
RFC price surged by 141% over the past 24 hours, continuing its uptrend this week. The meme coin gained attention after Elon Musk’s interactions with its official X (formerly Twitter) page. This triggered a speculative surge in interest, helping RFC capitalize on the increased attention and rising market sentiment.
Musk’s indirect association with Retard Finder Coin has sparked speculation, although no direct evidence confirms his involvement. Despite this uncertainty, RFC’s price has risen to $0.040. If the speculation continues, the altcoin could see further gains, potentially reaching the $0.050 resistance level in the short term.
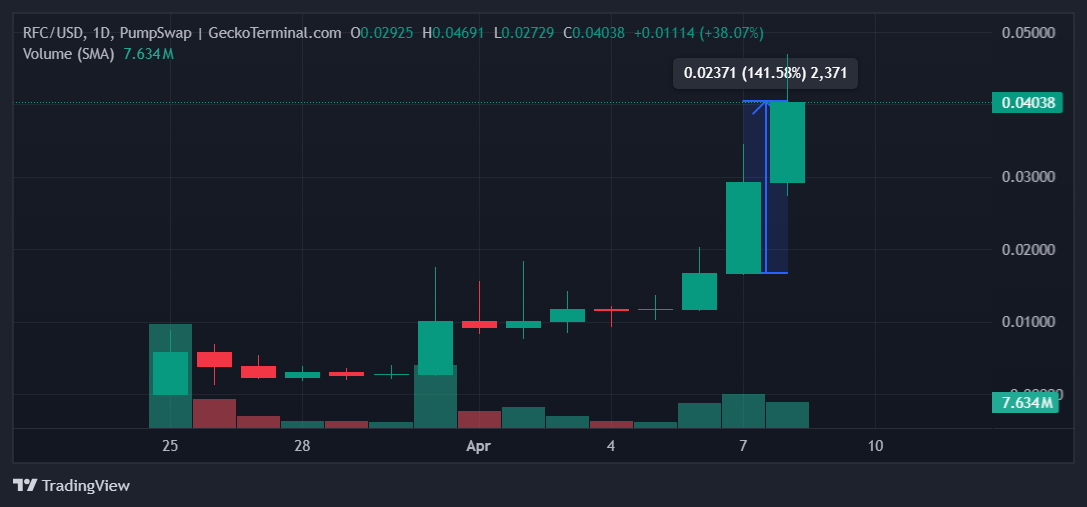
Despite its recent rise, RFC remains a meme coin with inherent volatility. The altcoin faces the risk of rapid selling by investors, which could lead to a quick price pullback. If this occurs, RFC might fall to $0.030 or even $0.020, making it crucial for investors to approach with caution.
Fartcoin (FARTCOIN)
- Launch Date – October 2024
- Total Circulating Supply – 999.99 Million FARTCOIN
- Maximum Supply – 1 Billion FARTCOIN
- Fully Diluted Valuation (FDV) – $588.26 Million
FARTCOIN saw a 32% rise in the last 24 hours, trading at $0.591. The meme coin is now nearing the resistance level of $0.600. If this momentum continues, FARTCOIN could break through this barrier and continue its upward movement, heading toward new highs in the coming sessions.
In the past, the $0.600 resistance has halted FARTCOIN’s rally, preventing further price gains. However, if the current bullish trend persists, FARTCOIN could overcome this barrier and rise toward $0.693. This level marks the next target for the altcoin, supported by positive market sentiment and strong investor interest.
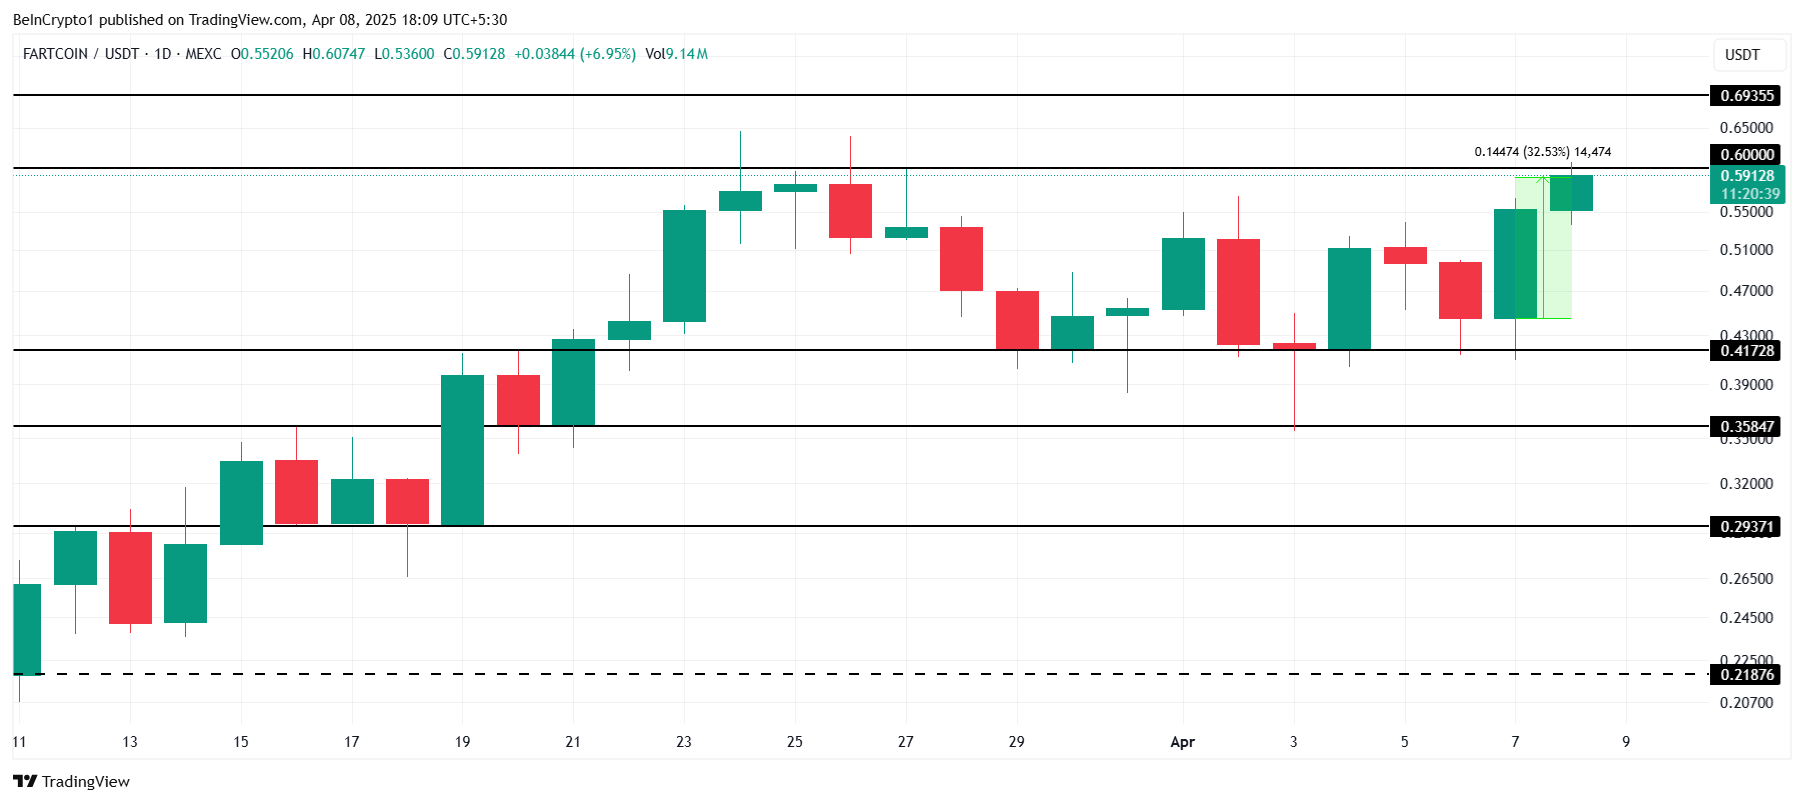
If the resistance level proves too strong, FARTCOIN may experience a pullback. A failure to breach $0.600 could lead to a decline back to $0.417 or even lower, erasing recent gains. This scenario would invalidate the bullish outlook and extend the downtrend if selling pressure intensifies.
Mog Coin (MOG)
- Launch Date – July 2023
- Total Circulating Supply – 390.5 Trillion MOG
- Maximum Supply – 420 Trillion MOG
- Fully Diluted Valuation (FDV) – $135.64 Million
MOG price surged by 25% in the last 24 hours, providing relief after a steep 50% decline during March’s end. This recovery signals the potential for further growth as the meme coin attempts to regain momentum and distance itself from recent losses. The recent rise could lead to more positive movements.
At the time of writing, MOG is trading at $0.000000346, just below the key resistance level of $0.000000370. If it breaches this level, MOG could gain enough momentum to push toward $0.000000433. This breakthrough would mark a significant recovery and extend its upward trend further in the coming days.
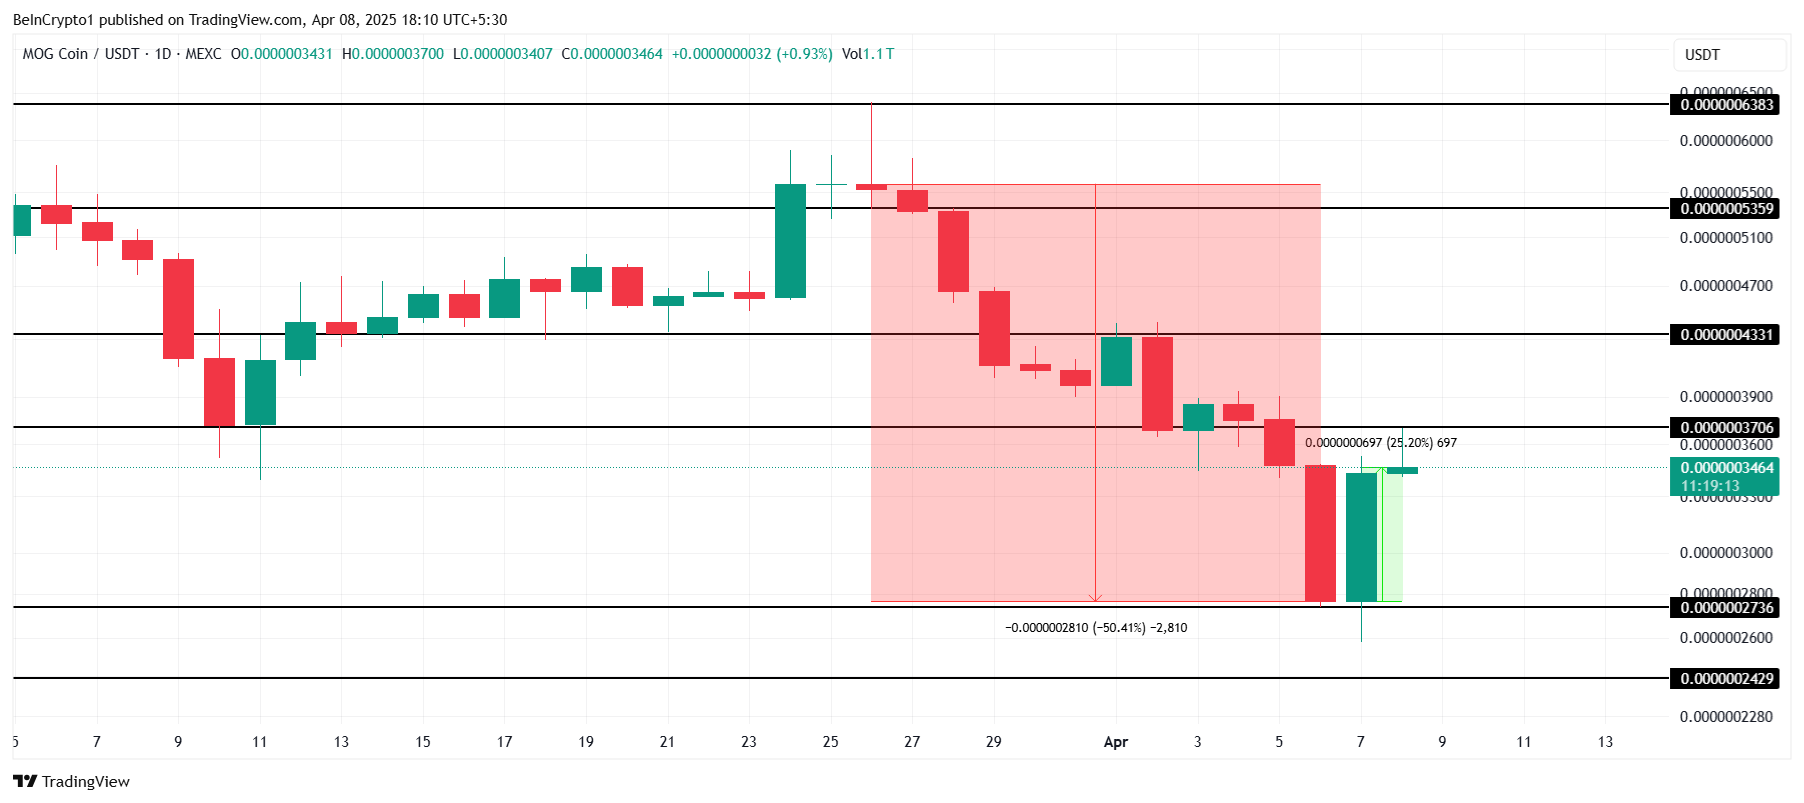
However, if MOG fails to breach $0.000000370, the altcoin may experience a decline. The next major support lies at $0.000000273, and if this level is tested, it could wipe out recent gains. In such a scenario, the bullish outlook would be invalidated, signaling a continued struggle for the meme coin.
Disclaimer
In line with the Trust Project guidelines, this price analysis article is for informational purposes only and should not be considered financial or investment advice. BeInCrypto is committed to accurate, unbiased reporting, but market conditions are subject to change without notice. Always conduct your own research and consult with a professional before making any financial decisions. Please note that our Terms and Conditions, Privacy Policy, and Disclaimers have been updated.
Reason to trust
![]()
Strict editorial policy that focuses on accuracy, relevance, and impartiality
Created by industry experts and meticulously reviewed
The highest standards in reporting and publishing
Strict editorial policy that focuses on accuracy, relevance, and impartiality
Morbi pretium leo et nisl aliquam mollis. Quisque arcu lorem, ultricies quis pellentesque nec, ullamcorper eu odio.
Bitcoin price started a fresh decline below the $78,000 zone. BTC is now consolidating losses and might face resistance near the $77,800 zone.
- Bitcoin started a fresh decline below the $78,000 zone.
- The price is trading below $78,500 and the 100 hourly Simple moving average.
- There is a connecting bearish trend line forming with resistance at $79,500 on the hourly chart of the BTC/USD pair (data feed from Kraken).
- The pair could start another increase if it clears the $78,500 zone.
Bitcoin Price Dips Again
Bitcoin price started a fresh decline below the $80,000 and $79,500 levels. BTC traded below the $78,500 and $77,000 levels to enter a bearish zone.
The price even dived below the $75,000 support zone. A low was formed at $74,475 and the price started a recovery wave. There was a move above the $75,500 level. The price climbed above the 23.6% Fib retracement level of the recent decline from the $80,800 swing high to the $74,475 low.
Bitcoin price is now trading below $78,200 and the 100 hourly Simple moving average. On the upside, immediate resistance is near the $77,800 level or the 50% Fib retracement level of the recent decline from the $80,800 swing high to the $74,475 low.
The first key resistance is near the $78,500 level. The next key resistance could be $79,500. There is also a connecting bearish trend line forming with resistance at $79,500 on the hourly chart of the BTC/USD pair.

A close above the $79,500 resistance might send the price further higher. In the stated case, the price could rise and test the $81,500 resistance level. Any more gains might send the price toward the $82,000 level.
Another Decline In BTC?
If Bitcoin fails to rise above the $78,500 resistance zone, it could start a fresh decline. Immediate support on the downside is near the $75,750 level. The first major support is near the $74,750 level.
The next support is now near the $73,500 zone. Any more losses might send the price toward the $72,000 support in the near term. The main support sits at $70,000.
Technical indicators:
Hourly MACD – The MACD is now gaining pace in the bearish zone.
Hourly RSI (Relative Strength Index) – The RSI for BTC/USD is now below the 50 level.
Major Support Levels – $75,750, followed by $74,750.
Major Resistance Levels – $78,500 and $79,500.

Ethereum Price Hit Hard—10% Drop Sparks Selloff Fears
Analyst Reveals What Could Come Next

RFC, FARTCOIN, MOG Lead Gains

Bitcoin Price Takes Another Tumble—Is The Floor About to Crack?

Berachain Drops 47% in a Month as Bearish Signals Grow

Bitcoin Crashes Below $75,000 As Asian Stock Markets Bleed

2.52 Million Altcoins Are Ruining Crypto’s Future

Animoca Brands Valuation Tanks 75% In Two Years, Here’s Why

Crypto exchange BingX hacked for $43 million

Are The Big Players Losing Interest?

Hong Kong’s Securities Association Tips Authorities On Crypto Self-Regulation

Coinbase cbBTC Set to go Live on Solana
2.52 Million Altcoins Are Ruining Crypto’s Future
Animoca Brands Valuation Tanks 75% In Two Years, Here’s Why
Crypto exchange BingX hacked for $43 million
Are The Big Players Losing Interest?
Hong Kong’s Securities Association Tips Authorities On Crypto Self-Regulation
Coinbase cbBTC Set to go Live on Solana
-
 Altcoin22 hours ago
John Deaton Highlights Ripple’s Journey from Legal Struggle To ETF Launches
-

 Market21 hours ago
Bitcoin Price Recovery In Play—But Major Hurdles Loom Large
-
 Altcoin20 hours ago
Bitcoin +6%, Ethereum +10% Amid Tariff Uncertainty; FARTCOIN Skyrockets +38%, Recovery or Bubble?
-

 Ethereum20 hours ago
Here’s Where Ethereum’s Last Line Of Defense Lies, According To On-Chain Data
-

 Market23 hours ago
Cardano (ADA) Eyes Resistance Break—Failure Could Spark Fresh Losses
-

 Market22 hours ago
Sui’s Community Passport & More This Week
-
 Altcoin24 hours ago
Binance Announces KERNEL As 4th Megadrop Project; Here’s The Listing Date
-
Ethereum22 hours ago
Ethereum MVRV Drops To Lowest Since December 2022: Bottom Signal?