
Market
Solana ETF Delay Fuels Bearish Sentiment, $16M Pulled from SOL

On Tuesday, the US Securities and Exchange Commission (SEC) postponed its decision on multiple altcoin exchange-traded funds (ETFs), including Solana’s.
This development has further dampened investor sentiment toward SOL, which has continued to witness significant spot market outflows.
Solana Investors Exit Amid SEC Delay—$16 Million Pulled Under 24 Hours
In a series of filings made on March 11, the SEC announced its plans to postpone its decision on multiple ETFs tied to major assets, one of which is SOL. According to the regulator, it has “designated a longer period” to review the proposed rule changes that would enable the ETFs to become operational.
This has exacerbated the bearish sentiment toward SOL, which is reflected in the capital outflows from its spot markets over the past 24 hours. As of this writing, $16.43 million has been removed from the market, marking the seventh day of consecutive outflows, which have now exceeded $250 million.
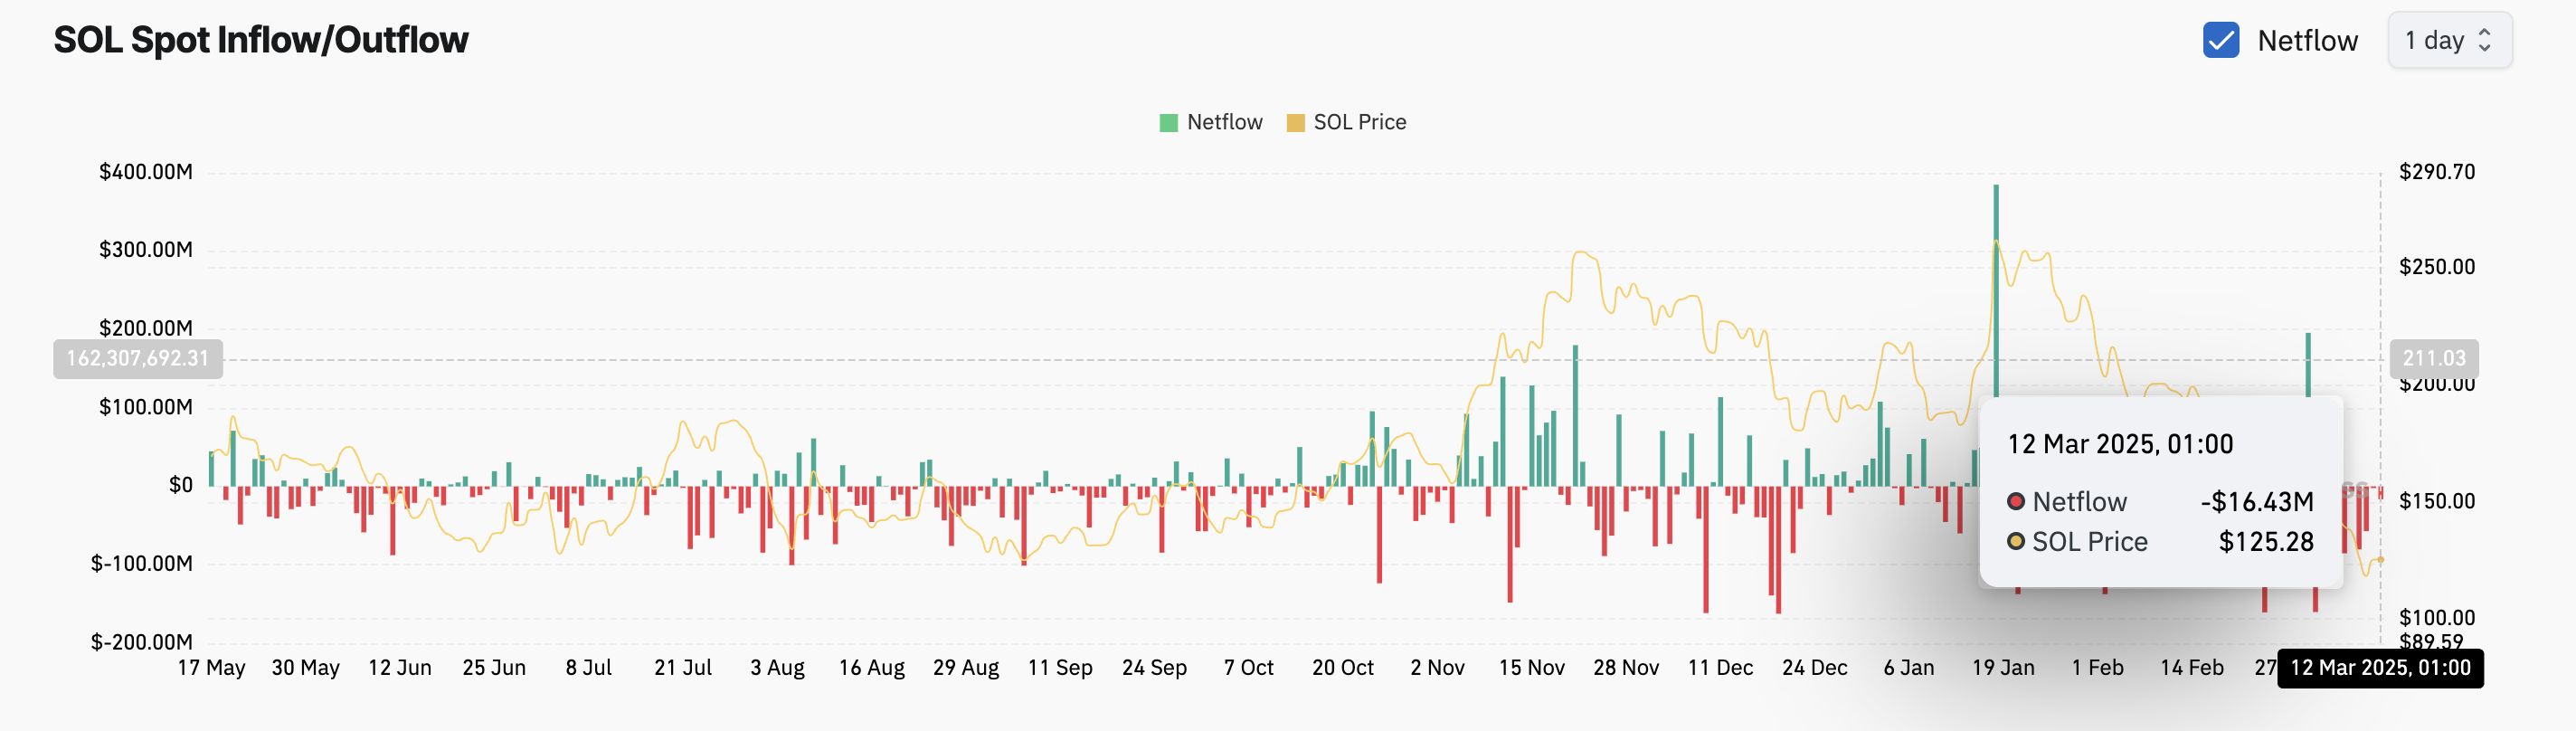
When an asset experiences spot outflows like this, its investors are selling their holdings. This trend reflects a lack of confidence in SOL’s short-term price recovery, with traders choosing to cash in their accrued gains to prevent further losses on investments.
Furthermore, SOL’s Moving Average Convergence Divergence (MACD) indicator, observed on a daily chart, supports this bearish outlook. As of this writing, the coin’s MACD line (blue) is below its signal line (orange).
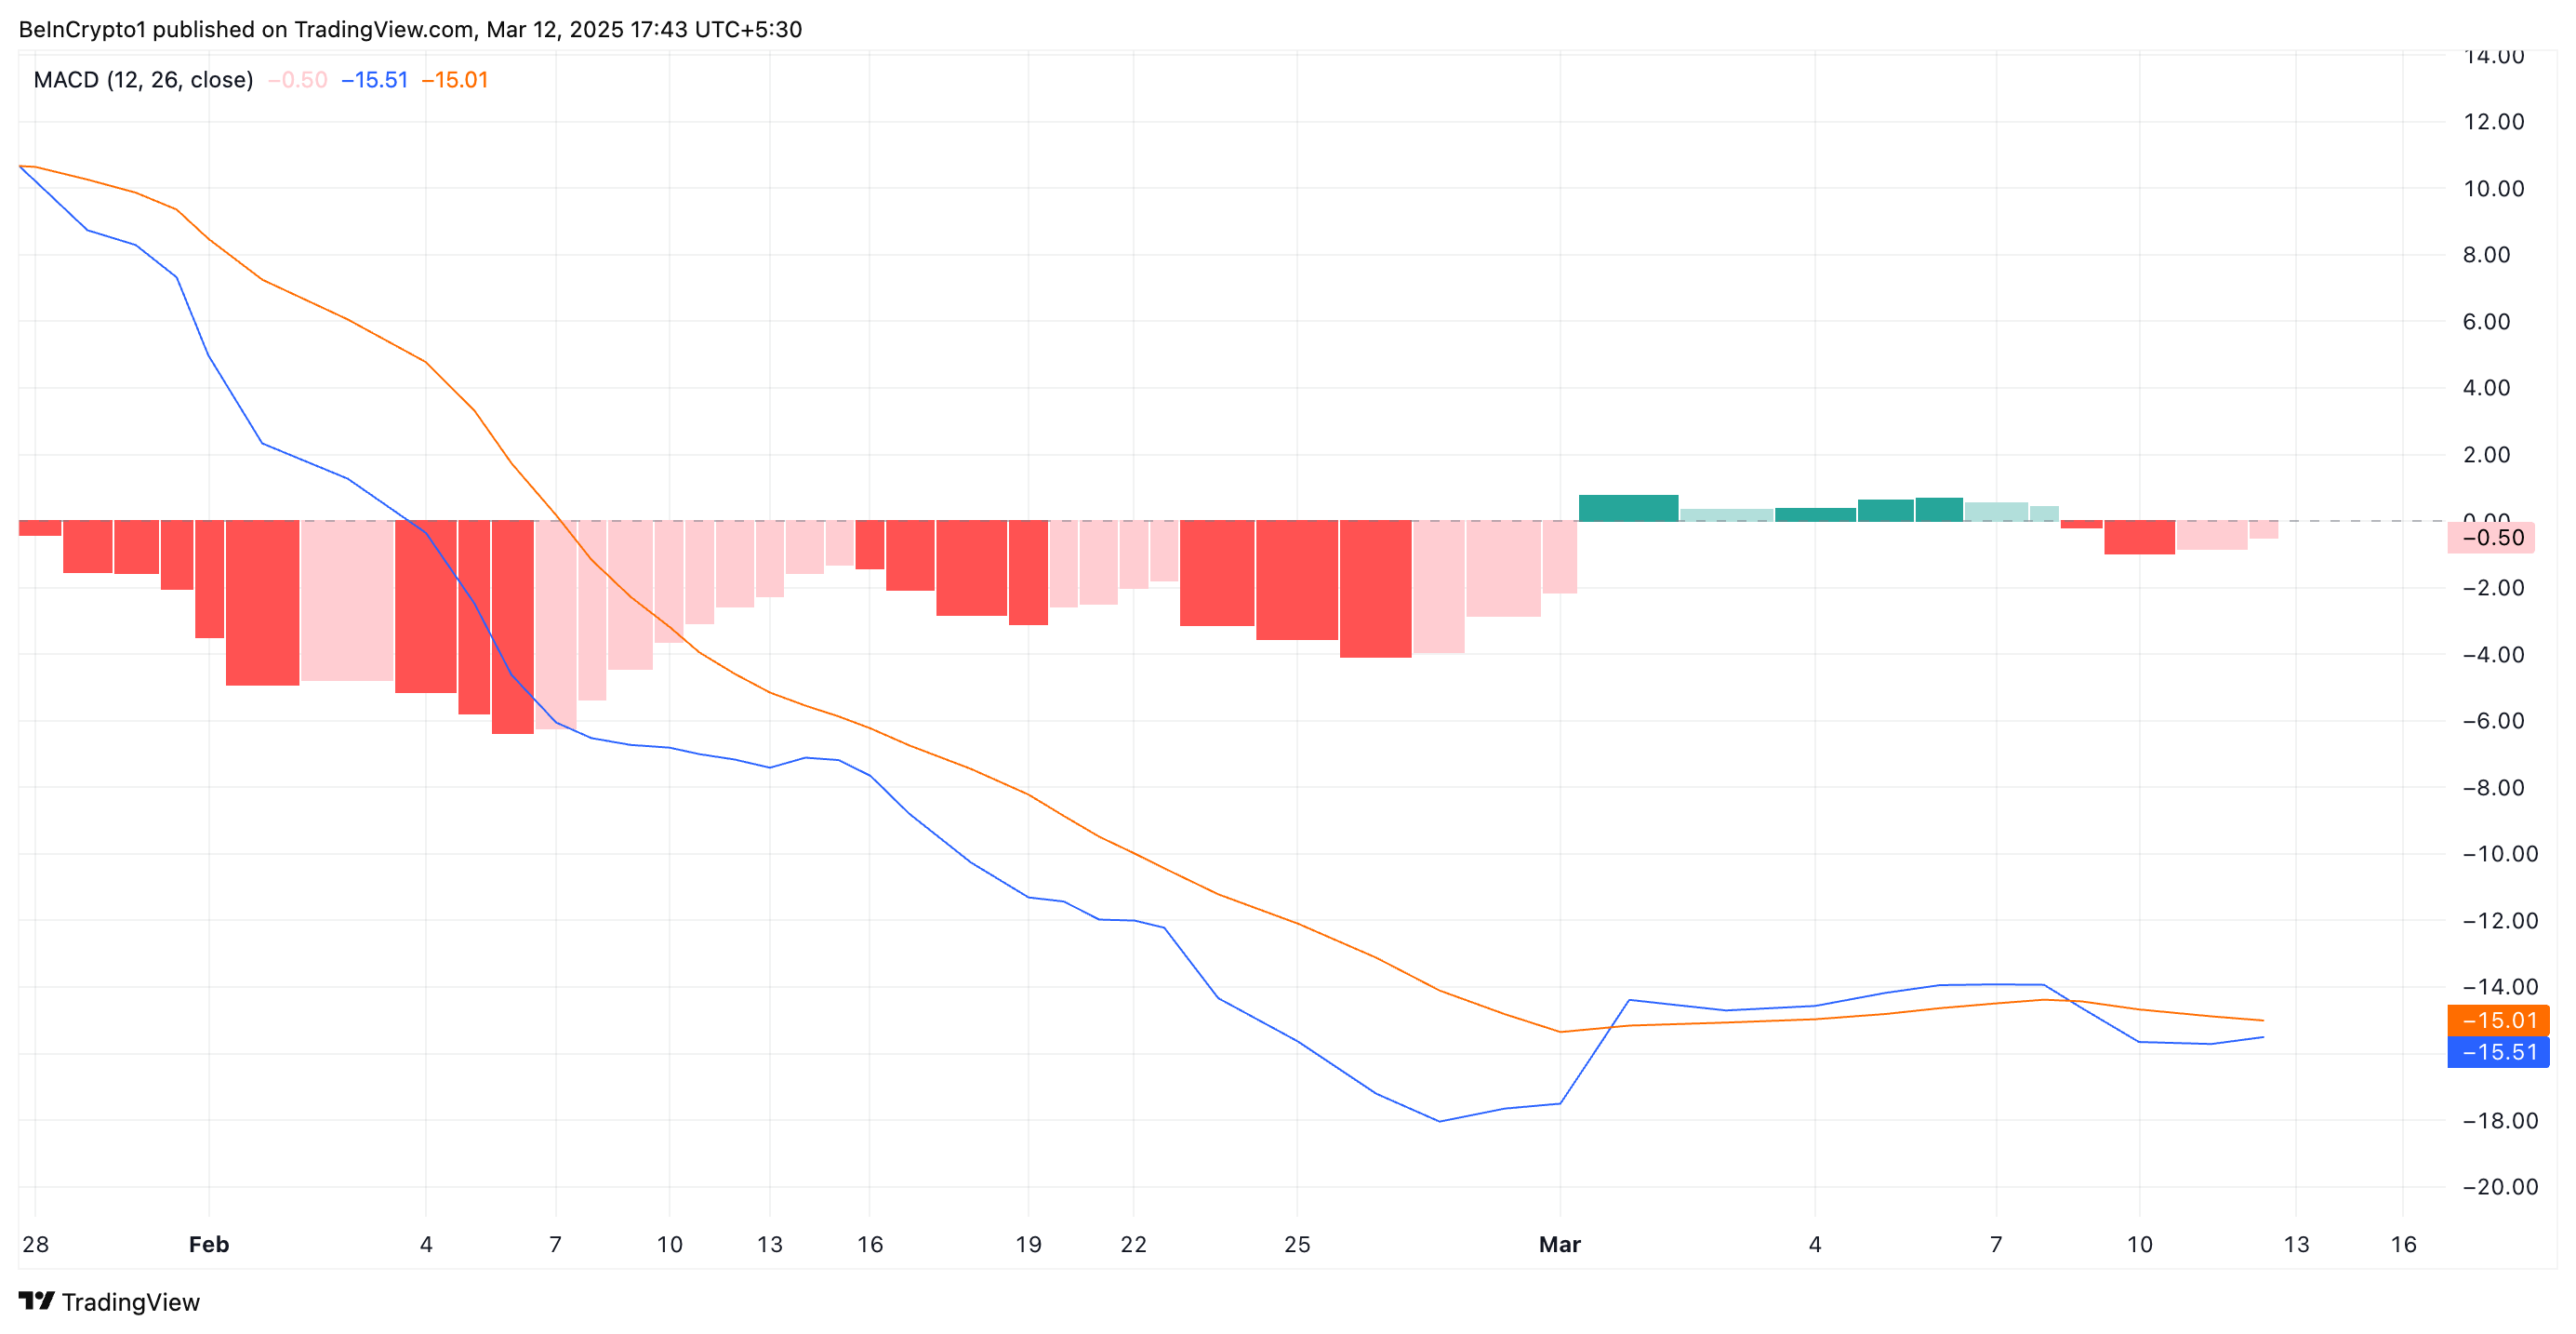
An asset’s MACD measures its price trends and momentum shifts and identifies potential buy or sell signals based on the crossing of the MACD line, signal line, and changes in the histogram.
When the MACD line rests under the signal line, the market is in a bearish trend. This indicates that SOL selloffs exceed buying activity among market participants, hinting at a further value drop.
Solana at Crossroads: Will SOL Hold $126 or Fall to $110?
SOL trades at $126.82 at press time. With waning buying pressure, it risks falling to $110, a low that it last reached in August 2024.
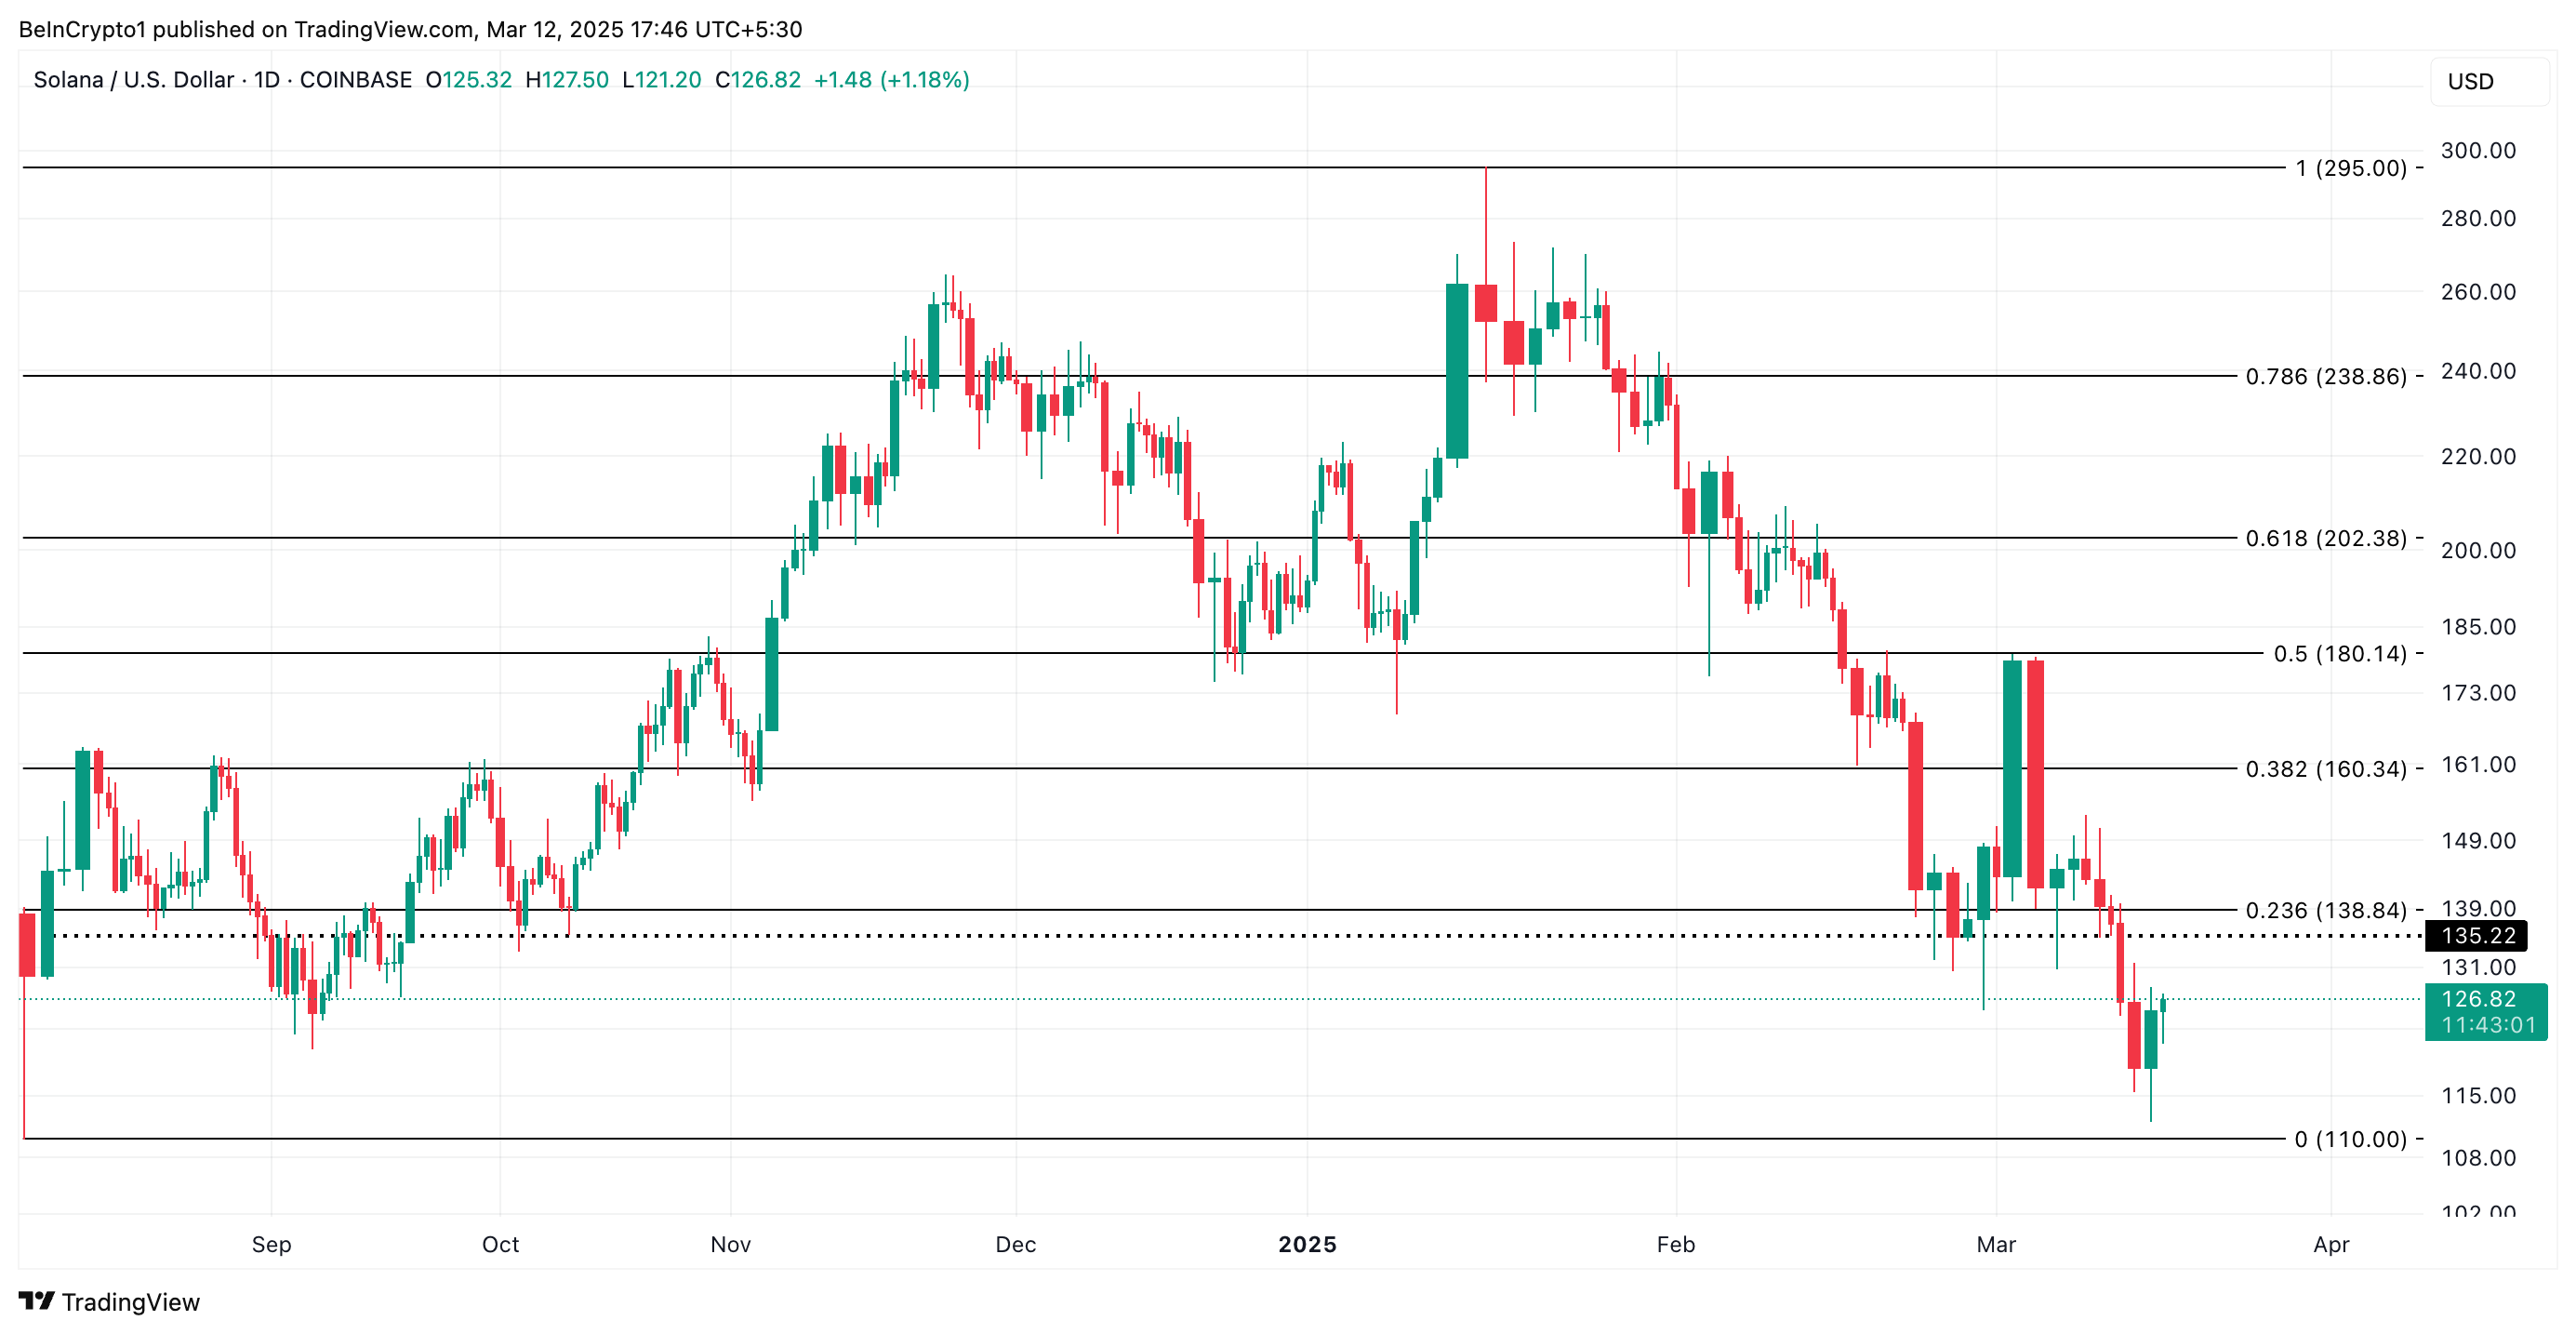
However, a strong resurgence in buying activity would prevent this. For this to happen, SOL has to establish a strong support flow at $135.22. If successful, it could propel its price to trade at $138.84 and above.
Disclaimer
In line with the Trust Project guidelines, this price analysis article is for informational purposes only and should not be considered financial or investment advice. BeInCrypto is committed to accurate, unbiased reporting, but market conditions are subject to change without notice. Always conduct your own research and consult with a professional before making any financial decisions. Please note that our Terms and Conditions, Privacy Policy, and Disclaimers have been updated.


Reason to trust
![]()
Strict editorial policy that focuses on accuracy, relevance, and impartiality
Created by industry experts and meticulously reviewed
The highest standards in reporting and publishing
Strict editorial policy that focuses on accuracy, relevance, and impartiality
Morbi pretium leo et nisl aliquam mollis. Quisque arcu lorem, ultricies quis pellentesque nec, ullamcorper eu odio.
Bitcoin price started a recovery wave above the $80,500 zone. BTC is now rising and might aim for a move above the $84,000 and $85,000 levels.
- Bitcoin started a decent recovery wave above the $81,000 zone.
- The price is trading above $81,500 and the 100 hourly Simple moving average.
- There was a break below a short-term bullish trend line with support at $83,000 on the hourly chart of the BTC/USD pair (data feed from Kraken).
- The pair could start another increase if it clears the $82,500 and $84,000 levels.
Bitcoin Price Eyes Steady Increase
Bitcoin price remained stable above the $78,000 level. BTC formed a base and recently started a recovery wave above the $80,500 resistance level.
The bulls pushed the price above the $82,000 resistance level. However, the bears were active near the $84,000 resistance zone. A high was formed at $84,200 and the price corrected some gains. There was a move below the $83,000 level.
The price dipped below the 50% Fib retracement level of the upward move from the $76,818 swing low to the $84,200 high. Besides, there was a break below a short-term bullish trend line with support at $83,000 on the hourly chart of the BTC/USD pair.
Bitcoin price is now trading above $81,200 and the 100 hourly Simple moving average. On the upside, immediate resistance is near the $82,450 level. The first key resistance is near the $84,000 level. The next key resistance could be $85,000.

A close above the $85,000 resistance might send the price further higher. In the stated case, the price could rise and test the $86,500 resistance level. Any more gains might send the price toward the $88,000 level or even $96,200.
Another Drop In BTC?
If Bitcoin fails to rise above the $82,450 resistance zone, it could start a fresh decline. Immediate support on the downside is near the $80,500 level. The first major support is near the $79,600 level or the 61.8% Fib retracement level of the upward move from the $76,818 swing low to the $84,200 high.
The next support is now near the $78,500 zone. Any more losses might send the price toward the $77,000 support in the near term. The main support sits at $76,500.
Technical indicators:
Hourly MACD – The MACD is now gaining pace in the bullish zone.
Hourly RSI (Relative Strength Index) – The RSI for BTC/USD is now above the 50 level.
Major Support Levels – $80,500, followed by $79,600.
Major Resistance Levels – $82,450 and $84,000.

Reason to trust
![]()
Strict editorial policy that focuses on accuracy, relevance, and impartiality
Created by industry experts and meticulously reviewed
The highest standards in reporting and publishing
Strict editorial policy that focuses on accuracy, relevance, and impartiality
Morbi pretium leo et nisl aliquam mollis. Quisque arcu lorem, ultricies quis pellentesque nec, ullamcorper eu odio.
Ethereum price started a recovery wave above the $1,820 zone. ETH is now consolidating and facing hurdles near the $1,950 resistance.
- Ethereum started a recovery wave above the $1,820 level.
- The price is trading below $1,920 and the 100-hourly Simple Moving Average.
- There is a short-term bearish trend line forming with resistance at $1,900 on the hourly chart of ETH/USD (data feed via Kraken).
- The pair must clear the $1,900 and $1,950 resistance levels to start a decent increase.
Ethereum Price Faces Resistance
Ethereum price formed a base above the $1,760 level and started a recovery wave, like Bitcoin. ETH was able to clear the $1,820 and $1,850 resistance levels.
The bulls pushed the price above the $1,920 level. There was a move above the 23.6% Fib retracement level of the downward wave from the $2,150 swing high to the $1,752 low. However, the bears seem to be active near the $1,950 resistance zone.
Ethereum price is now trading below $1,920 and the 100-hourly Simple Moving Average. On the upside, the price seems to be facing hurdles near the $1,900 level.
There is also a short-term bearish trend line forming with resistance at $1,900 on the hourly chart of ETH/USD. The next key resistance is near the $1,950 level or the 50% Fib retracement level of the downward wave from the $2,150 swing high to the $1,752 low.

The first major resistance is near the $1,990 level. A clear move above the $1,990 resistance might send the price toward the $2,050 resistance. An upside break above the $2,050 resistance might call for more gains in the coming sessions. In the stated case, Ether could rise toward the $2,120 resistance zone or even $2,250 in the near term.
Another Drop In ETH?
If Ethereum fails to clear the $1,950 resistance, it could start another decline. Initial support on the downside is near the $1,845 level. The first major support sits near the $1,800 zone.
A clear move below the $1,800 support might push the price toward the $1,750 support. Any more losses might send the price toward the $1,720 support level in the near term. The next key support sits at $1,650.
Technical Indicators
Hourly MACD – The MACD for ETH/USD is gaining momentum in the bullish zone.
Hourly RSI – The RSI for ETH/USD is now above the 50 zone.
Major Support Level – $1,800
Major Resistance Level – $1,920
Reason to trust
![]()
Strict editorial policy that focuses on accuracy, relevance, and impartiality
Created by industry experts and meticulously reviewed
The highest standards in reporting and publishing
Strict editorial policy that focuses on accuracy, relevance, and impartiality
Morbi pretium leo et nisl aliquam mollis. Quisque arcu lorem, ultricies quis pellentesque nec, ullamcorper eu odio.
Ethereum price started a recovery wave above the $1,820 zone. ETH is now consolidating and facing hurdles near the $1,950 resistance.
- Ethereum started a recovery wave above the $1,820 level.
- The price is trading below $1,920 and the 100-hourly Simple Moving Average.
- There is a short-term bearish trend line forming with resistance at $1,900 on the hourly chart of ETH/USD (data feed via Kraken).
- The pair must clear the $1,900 and $1,950 resistance levels to start a decent increase.
Ethereum Price Faces Resistance
Ethereum price formed a base above the $1,760 level and started a recovery wave, like Bitcoin. ETH was able to clear the $1,820 and $1,850 resistance levels.
The bulls pushed the price above the $1,920 level. There was a move above the 23.6% Fib retracement level of the downward wave from the $2,150 swing high to the $1,752 low. However, the bears seem to be active near the $1,950 resistance zone.
Ethereum price is now trading below $1,920 and the 100-hourly Simple Moving Average. On the upside, the price seems to be facing hurdles near the $1,900 level.
There is also a short-term bearish trend line forming with resistance at $1,900 on the hourly chart of ETH/USD. The next key resistance is near the $1,950 level or the 50% Fib retracement level of the downward wave from the $2,150 swing high to the $1,752 low.
The first major resistance is near the $1,990 level. A clear move above the $1,990 resistance might send the price toward the $2,050 resistance. An upside break above the $2,050 resistance might call for more gains in the coming sessions. In the stated case, Ether could rise toward the $2,120 resistance zone or even $2,250 in the near term.
Another Drop In ETH?
If Ethereum fails to clear the $1,950 resistance, it could start another decline. Initial support on the downside is near the $1,845 level. The first major support sits near the $1,800 zone.
A clear move below the $1,800 support might push the price toward the $1,750 support. Any more losses might send the price toward the $1,720 support level in the near term. The next key support sits at $1,650.
Technical Indicators
Hourly MACD – The MACD for ETH/USD is gaining momentum in the bullish zone.
Hourly RSI – The RSI for ETH/USD is now above the 50 zone.
Major Support Level – $1,800
Major Resistance Level – $1,920

Bitcoin Price Steadies—Is a Meaningful Bounce on the Horizon?

Ethereum Price Consolidates and Eyes Recovery—Is a Bounce Incoming?
Ethereum Price Consolidates and Eyes Recovery—Is a Bounce Incoming?

XRP Price Hints At Symmetrical Triangle, But A Crash Could Come Before The Surge

CertiK Expert Discusses Surge in Social Engineering Crypto Scams

Cardano (ADA) Struggle Persists—Is a Rebound Still Possible?

2.52 Million Altcoins Are Ruining Crypto’s Future

Animoca Brands Valuation Tanks 75% In Two Years, Here’s Why

Crypto exchange BingX hacked for $43 million

Are The Big Players Losing Interest?

Hong Kong’s Securities Association Tips Authorities On Crypto Self-Regulation

Coinbase cbBTC Set to go Live on Solana
2.52 Million Altcoins Are Ruining Crypto’s Future
Animoca Brands Valuation Tanks 75% In Two Years, Here’s Why
Crypto exchange BingX hacked for $43 million
Are The Big Players Losing Interest?
Hong Kong’s Securities Association Tips Authorities On Crypto Self-Regulation
Coinbase cbBTC Set to go Live on Solana
-

 Ethereum21 hours ago
Ethereum Net Taker Volume Signals Huge Selling Pressure – Can Bulls Hold Key Levels?
-

 Market23 hours ago
Aave Horizon RWA Product To Unlock Trillions in Tokenized Assets
-

 Regulation17 hours ago
Ripple Secures DFSA License in the UAE
-

 Market21 hours ago
Celestia TIA) Price Nears Consolidation After 31% Rally
-

 Market20 hours ago
Crypto Stocks Post Losses, But Bear Market Fears Diminish
-
 Market14 hours ago
Stellar (XLM) Jumps 10% as Bulls Take Charge: What’s Next?
-

 Market22 hours ago
XCN Dip Signals More Downside as Bearish Indicators Intensify
-
 Altcoin22 hours ago
Ripple Moves $457 Million XRP Amid Potential US SEC Settlement