
Market
Shiba Inu (SHIB) at Risk of Decline Despite Whale Activity

The last month has been marked by an uptick in Shiba Inu (SHIB) whale activity. However, this was not reflected in the price of the leading meme coin during that period.
Exchanging hands at $0.000025 at press time, SHIB’s value rallied to a peak of $0.000028 on May 29 and has since declined by almost 10%.
Shiba Inu Whales Fail to Move the Needle
In the last month, there has been a surge in the daily count of large SHIB transactions.
The number of transactions worth between $100,000 and $1 million has increased by 238% in the last 30 days, and the number of larger transactions valued between $1 million and $10 million has also increased by 50% during the same period.
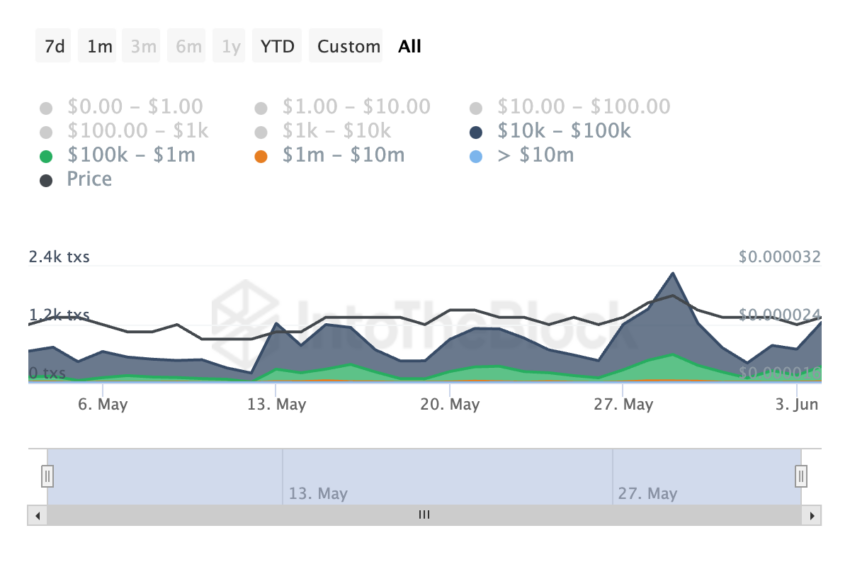
A rise in whale transaction counts suggests that large investors are becoming more interested in the asset. This may be due to a number of reasons varying from the asset’s positive price performance to the overall market outlook.
In SHIB’s case, the surge in the meme coin’s whale activity is attributable to the growth witnessed in the general meme market in May.
However, while this growth caused other meme assets such as Pepe (PEPE), dogwifhat (WIF), and Floki (FLOKI) to witness significant spikes in their values, the low demand for SHIB put downward pressure on its price.
Read More: 6 Best Platforms To Buy Shiba Inu (SHIB) in 2024
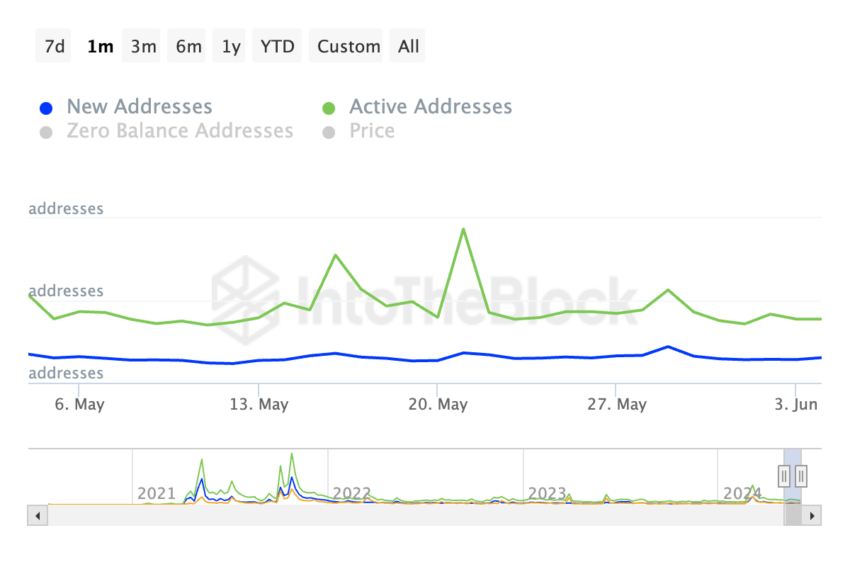
Still low at press time, the count of SHIB’s active and new addresses has plummeted by 13% and 9% in the past seven days. When the demand for an asset craters in this manner, it confirms that the market trend has shifted from positive to negative.
SHIB Price Prediction: Brace For a Price Drop?
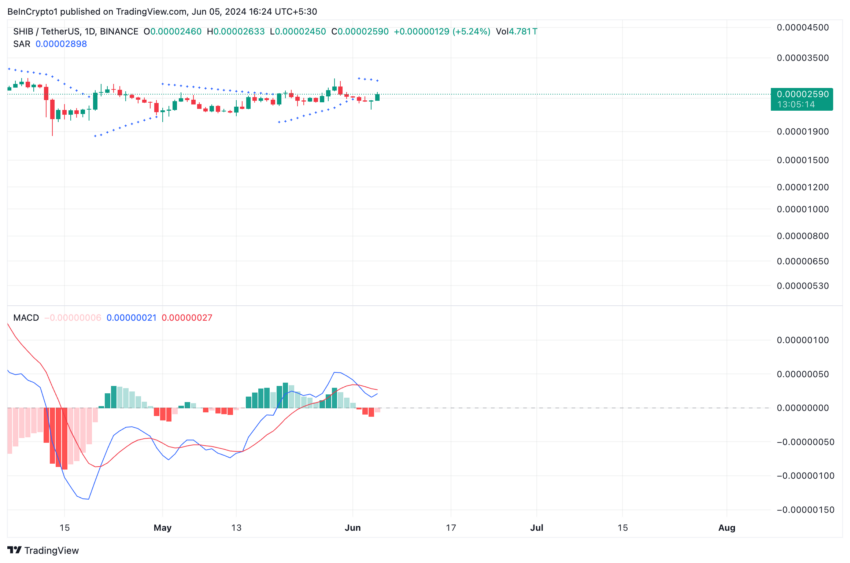
The dots that comprise SHIB’s Parabolic Stop and Reverse (SAR) indicator are above its price at press time.
This indicator identifies an asset’s potential trend direction and price reversals. When its dots lie above the price, it is a bearish sign. It suggests that the market is declining, and the asset’s price may continue to fall.
Also, readings from SHIB’s Moving Average Convergence Divergence (MACD) indicator revealed an upward intersection of the signal line (red) with the MACD line (blue) on June 2. This crossover is a bearish signal, which suggests that SHIB’s short-term average has fallen below its long-term average.
Traders view it as a sign to exit long and open short positions.
If this trend is sustained and market participants continue to close out their long positions, SHIB’s price may dip to $0.000023.
Read More: Shiba Inu (SHIB) Price Prediction 2024/2025/2030
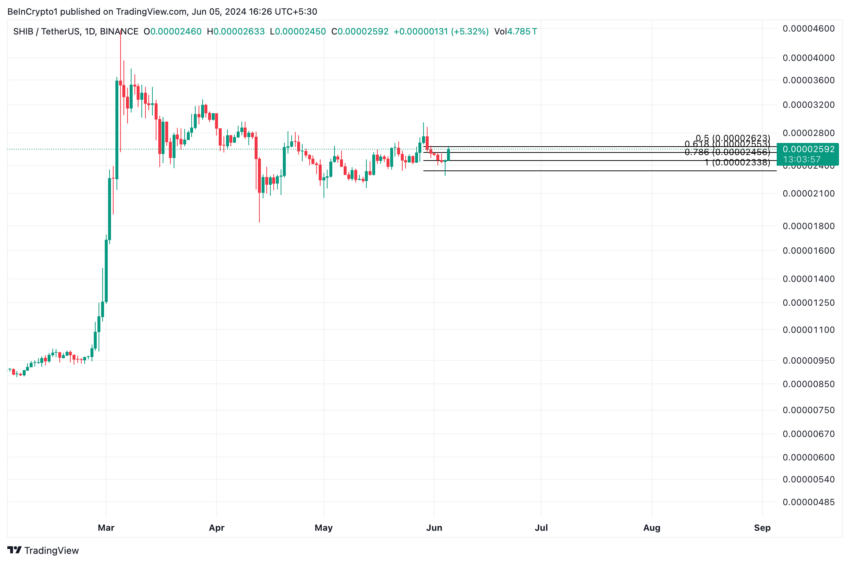
However, if this is invalidated, the meme coin might exchange hands at $0.000026.
Disclaimer
In line with the Trust Project guidelines, this price analysis article is for informational purposes only and should not be considered financial or investment advice. BeInCrypto is committed to accurate, unbiased reporting, but market conditions are subject to change without notice. Always conduct your own research and consult with a professional before making any financial decisions. Please note that our Terms and Conditions, Privacy Policy, and Disclaimers have been updated.


Global investment management firm VanEck has officially registered a statutory trust in Delaware for Binance’s BNB (BNB) exchange-traded fund (ETF).
This move marks the first attempt to launch a spot BNB ETF in the United States. It could potentially open new avenues for institutional and retail investors to gain exposure to the asset through a regulated investment vehicle.
VanEck Moves Forward with BNB ETF
The trust was registered on March 31 under the name “VanEck BNB ETF” with filing number 10148820. It was recorded on Delaware’s official state website.

The proposed BNB ETF would track the price of BNB. It is the native cryptocurrency of the BNB Chain ecosystem, developed by the cryptocurrency exchange Binance.
As per the latest data, BNB ranks as the fifth-largest cryptocurrency by market capitalization at $87.1 billion. Despite its significant market position, both BNB’s price and the broader cryptocurrency market have faced some challenges recently.
Over the past month, the altcoin’s value has declined 2.2%. At the time of writing, BNB was trading at $598. This represented a 1.7% dip in the last 24 hours, according to data from BeInCrypto.

While the trust filing hasn’t yet led to a price uptick, the community remains optimistic about the prospects of BNB, especially with this new development.
“Send BNB to the moon now,” an analyst posted on X (formerly Twitter).
The filing comes just weeks after VanEck made a similar move for Avalanche (AVAX). On March 10, VanEck registered a trust for an AVAX-focused ETF.
This was quickly followed by the filing of an S-1 registration statement with the US Securities and Exchange Commission (SEC). Given this precedent, a similar S-1 filing for a BNB ETF could follow soon.
“A big step toward bringing BNB to US institutional investors!” another analyst wrote.
Meanwhile, the industry has seen an influx of crypto fund applications at the SEC following the election of a pro-crypto administration. In fact, a recent survey revealed that 71% of ETF investors are bullish on crypto and plan to increase their allocations to cryptocurrency ETFs in the next 12 months.
“Three-quarters of allocators expect to increase their investment in cryptocurrency-focused ETFs over the next 12 months, with demand highest in Asia (80%), and the US (76%), in contrast to Europe (59%),” the survey revealed.
This growing interest in crypto ETFs could drive further demand for assets like BNB, making the VanEck BNB ETF a potentially significant product in the market.
Disclaimer
In adherence to the Trust Project guidelines, BeInCrypto is committed to unbiased, transparent reporting. This news article aims to provide accurate, timely information. However, readers are advised to verify facts independently and consult with a professional before making any decisions based on this content. Please note that our Terms and Conditions, Privacy Policy, and Disclaimers have been updated.
XRP price started a fresh decline from the $2.20 zone. The price is now consolidating and might face hurdles near the $2.120 level.
- XRP price started a fresh decline after it failed to clear the $2.20 resistance zone.
- The price is now trading below $2.150 and the 100-hourly Simple Moving Average.
- There is a connecting bearish trend line forming with resistance at $2.120 on the hourly chart of the XRP/USD pair (data source from Kraken).
- The pair might extend losses if it fails to clear the $2.20 resistance zone.
XRP Price Faces Rejection
XRP price failed to continue higher above the $2.20 resistance zone and reacted to the downside, like Bitcoin and Ethereum. The price declined below the $2.150 and $2.120 levels.
The bears were able to push the price below the 50% Fib retracement level of the recovery wave from the $2.023 swing low to the $2.199 high. There is also a connecting bearish trend line forming with resistance at $2.120 on the hourly chart of the XRP/USD pair.
The price is now trading below $2.150 and the 100-hourly Simple Moving Average. However, the bulls are now active near the $2.10 support level. They are protecting the 61.8% Fib retracement level of the recovery wave from the $2.023 swing low to the $2.199 high.

On the upside, the price might face resistance near the $2.120 level and the trend line zone. The first major resistance is near the $2.150 level. The next resistance is $2.20. A clear move above the $2.20 resistance might send the price toward the $2.240 resistance. Any more gains might send the price toward the $2.2650 resistance or even $2.2880 in the near term. The next major hurdle for the bulls might be $2.320.
Another Decline?
If XRP fails to clear the $2.150 resistance zone, it could start another decline. Initial support on the downside is near the $2.10 level. The next major support is near the $2.0650 level.
If there is a downside break and a close below the $2.0650 level, the price might continue to decline toward the $2.020 support. The next major support sits near the $2.00 zone.
Technical Indicators
Hourly MACD – The MACD for XRP/USD is now gaining pace in the bearish zone.
Hourly RSI (Relative Strength Index) – The RSI for XRP/USD is now below the 50 level.
Major Support Levels – $2.10 and $2.050.
Major Resistance Levels – $2.120 and $2.20.

Circle’s initial public offering (IPO) filing has raised concerns among industry experts, who are sounding alarms over the company’s financial health, distribution costs, and valuation.
While the move marks a significant step toward mainstream financial integration, experts’ skepticism casts doubt on the company’s long-term prospects.
Analysts Highlight Red Flags With Circle IPO
On April 1, BeInCrypto reported that Circle had filed for an IPO. The company plans to list its Class A common stock on the New York Stock Exchange (NYSE) under “CRCL.”
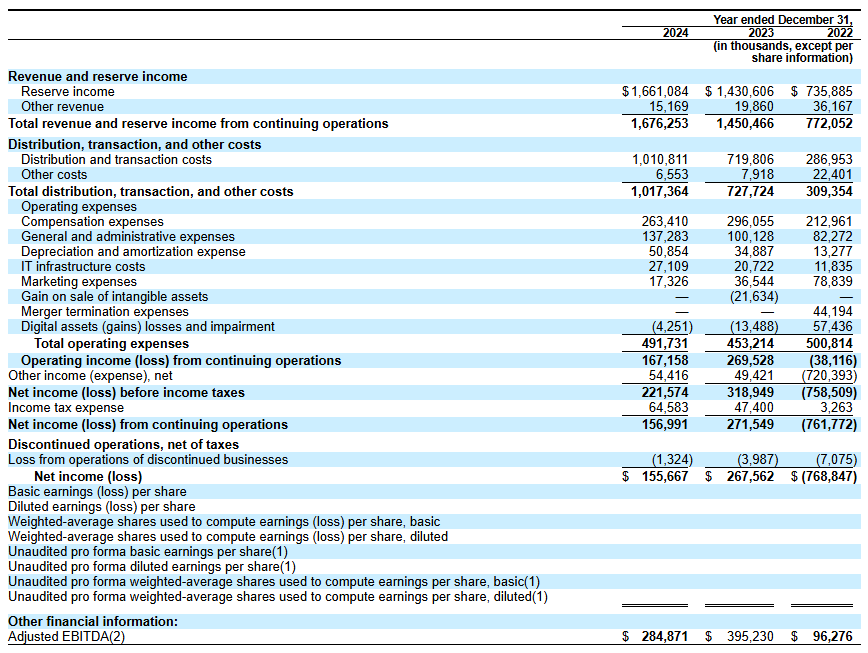
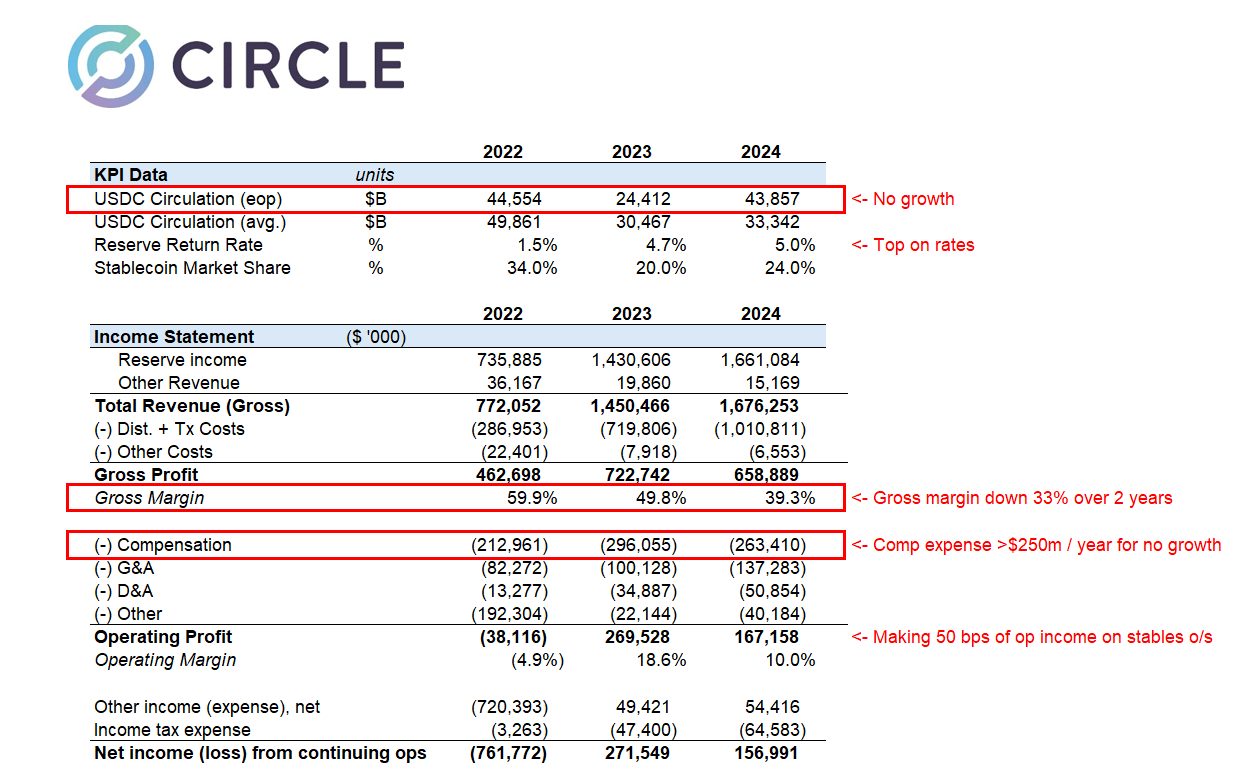
Circle’s IPO filing reveals revenue of $1.67 billion in 2024, a notable increase from previous years. However, a closer examination of the company’s financials has uncovered some challenges.
Matthew Sigel, Head of Digital Assets Research at VanEck, noted that revenue increased 16% year over year. Yet, at the same time, the company reported a 29% decrease in EBITDA year over year, indicating a decline in operational profitability. Additionally, net income fell by 42%, reflecting a significant drop in overall profitability.
Sigel pointed out four factors contributing to the decline in these financial metrics. He explained that the company’s rapid expansion and new service integrations negatively impacted net income.
Furthermore, the discontinuation of services like Circle Yield reduced other revenue streams. This, in turn, exacerbated the decline in profitability.
“Costs related to restructuring, legal settlements, and acquisition-related expenses also played a role in the decline in EBITDA and net income, despite overall revenue growth,” Sigel added.
Importantly, he focused on Circle’s increased distribution and transaction costs. Sigel revealed that the cost rose due to higher fees paid to partners like Coinbase and Binance.
A related post by Farside Investors on X (formerly Twitter) shed further light on these expenses.
“In 2024, the company spent over $1 billion on “distribution and transaction costs,” probably much higher than Tether as a % of revenue,” the post read.
This prompts speculation that Circle may be overspending to maintain its market share in the competitive stablecoin sector. The company’s historical performance further fuels skepticism.
Farside Investors added that in 2022, Circle recorded a staggering $720 million loss. Notably, the year was marked by significant turmoil in the crypto industry, including the high-profile collapses of FTX and Three Arrows Capital (3AC).
This suggests that Circle may be vulnerable to market shocks. Thus, it calls into question the company’s risk management capabilities—especially in the inherently volatile crypto market.
“The gross creation and redemption numbers are a lot higher than we would have thought for USDC. Gross creations in a year are many multiples higher than the outstanding balance,” Farside Investors remarked.
In addition, analyst Omar expressed doubts about Circle’s $5 billion valuation.
“Nothing to love in the Circle IPO filing and no idea how it prices at $5 billion,” he questioned.
He drew attention to several concerns, including the company’s gross margins being severely impacted by high distribution costs. The analyst also pointed out that the deregulation of the US market is poised to disrupt Circle’s position.
Additionally, Omar stressed that Circle spends over $250 million annually on compensation and another $140 million on general and administrative costs, raising questions about its financial efficiency. He also noted that interest rates—core income drivers for Circle—will likely decline, presenting additional challenges.
“32x ’24 earnings for a business that just lost its mini-monopoly and facing several headwinds is expensive when growth structurally challenged,” Omar said.
Ultimately, the analyst concluded that the IPO filing was a desperate attempt to secure liquidity before facing serious market difficulties.
Meanwhile, Wyatt Lonergan, General Partner at VanEck, shared his predictions for Circle’s IPO, outlining four potential scenarios. In the base case, he forecasted that Circle would capitalize on the stablecoin narrative and secure key partnerships to drive growth.
In a bear case, Lonergan speculated that poor market conditions might lead to a Coinbase buyout.
“Circle IPOs, the market continues to tank, Circle stock goes with it. Poor business fundamentals cited. Coinbase swoops in to buy at a discount to the IPO price. USDC is all theirs at long last. Coinbase acquires Circle for something close to the IPO price, and they never go public,” Lonergan claimed.
Lastly, he outlined a probable scenario where Ripple bids up Circle’s valuation to a staggering $15 to $20 billion and acquires the company.
Disclaimer
In adherence to the Trust Project guidelines, BeInCrypto is committed to unbiased, transparent reporting. This news article aims to provide accurate, timely information. However, readers are advised to verify facts independently and consult with a professional before making any decisions based on this content. Please note that our Terms and Conditions, Privacy Policy, and Disclaimers have been updated.

Tokenized Gold Market Cap Tops $1.2 Billion as Gold Prices Surge

VanEck Sets Stage for BNB ETF with Official Trust Filing

Pi Network Faces Community Backlash, Is Pi Coin Price Heading to Zero?

XRP Recovery Stalls—Are Bears Still In Control?

Institutional Risk Aversion Drives $218 Million Bitcoin ETF Outflows

PENDLE Price Jumps 8% Today Amid Huge Whale Accumulation

2.52 Million Altcoins Are Ruining Crypto’s Future

Animoca Brands Valuation Tanks 75% In Two Years, Here’s Why

Crypto exchange BingX hacked for $43 million

Are The Big Players Losing Interest?

Hong Kong’s Securities Association Tips Authorities On Crypto Self-Regulation

Coinbase cbBTC Set to go Live on Solana
2.52 Million Altcoins Are Ruining Crypto’s Future
Animoca Brands Valuation Tanks 75% In Two Years, Here’s Why
Crypto exchange BingX hacked for $43 million
Are The Big Players Losing Interest?
Hong Kong’s Securities Association Tips Authorities On Crypto Self-Regulation
Coinbase cbBTC Set to go Live on Solana
-

 Market23 hours ago
Bitcoin Price Battles Key Hurdles—Is a Breakout Still Possible?
-

 Bitcoin20 hours ago
$500 Trillion Bitcoin? Saylor’s Bold Prediction Shakes the Market!
-

 Bitcoin22 hours ago
Big Bitcoin Buy Coming? Saylor Drops a Hint as Strategy Shifts
-

 Market20 hours ago
Coinbase Stock Plunges 30% in Worst Quarter Since FTX Collapse
-
 Altcoin19 hours ago
Will XRP, SOL, ADA Make the List?
-

 Market21 hours ago
Fake Gemini Bankruptcy Emails Target Users
-

 Market14 hours ago
Ethereum Struggles to Break Out as Bear Trend Fades
-

 Market19 hours ago
Ethereum Reclaims Top DeFi Spot As Solana DEX Volume Drops