Market
Shiba Inu Price Down 27% in 30 Days

Shiba Inu (SHIB) price has been trading sideways over the past seven days but remains down 27% in the last 30 days, reflecting a broader period of weakness. Despite recent signs of recovery, momentum indicators like the RSI and BBTrend suggest that SHIB is still struggling to establish a clear direction.
However, a potential golden cross forming on the EMA lines could signal a bullish breakout, with SHIB eyeing key resistance levels at $0.000017 and $0.000019. On the downside, if selling pressure resumes, SHIB could retest support at $0.000014.
SHIB RSI Is Currently Neutral, Down From 60.8
Shiba Inu RSI is currently at 52 after a sharp move yesterday that saw it surge from 50 to 60.8. The Relative Strength Index (RSI) is a momentum indicator used to measure whether an asset is overbought or oversold on a scale of 0 to 100.
Typically, an RSI above 70 signals overbought conditions and a potential price pullback, while an RSI below 30 indicates oversold conditions and the possibility of a rebound.
When the RSI hovers around the 50 mark, it suggests a lack of strong momentum in either direction, meaning the asset is in a neutral zone without a defined trend.

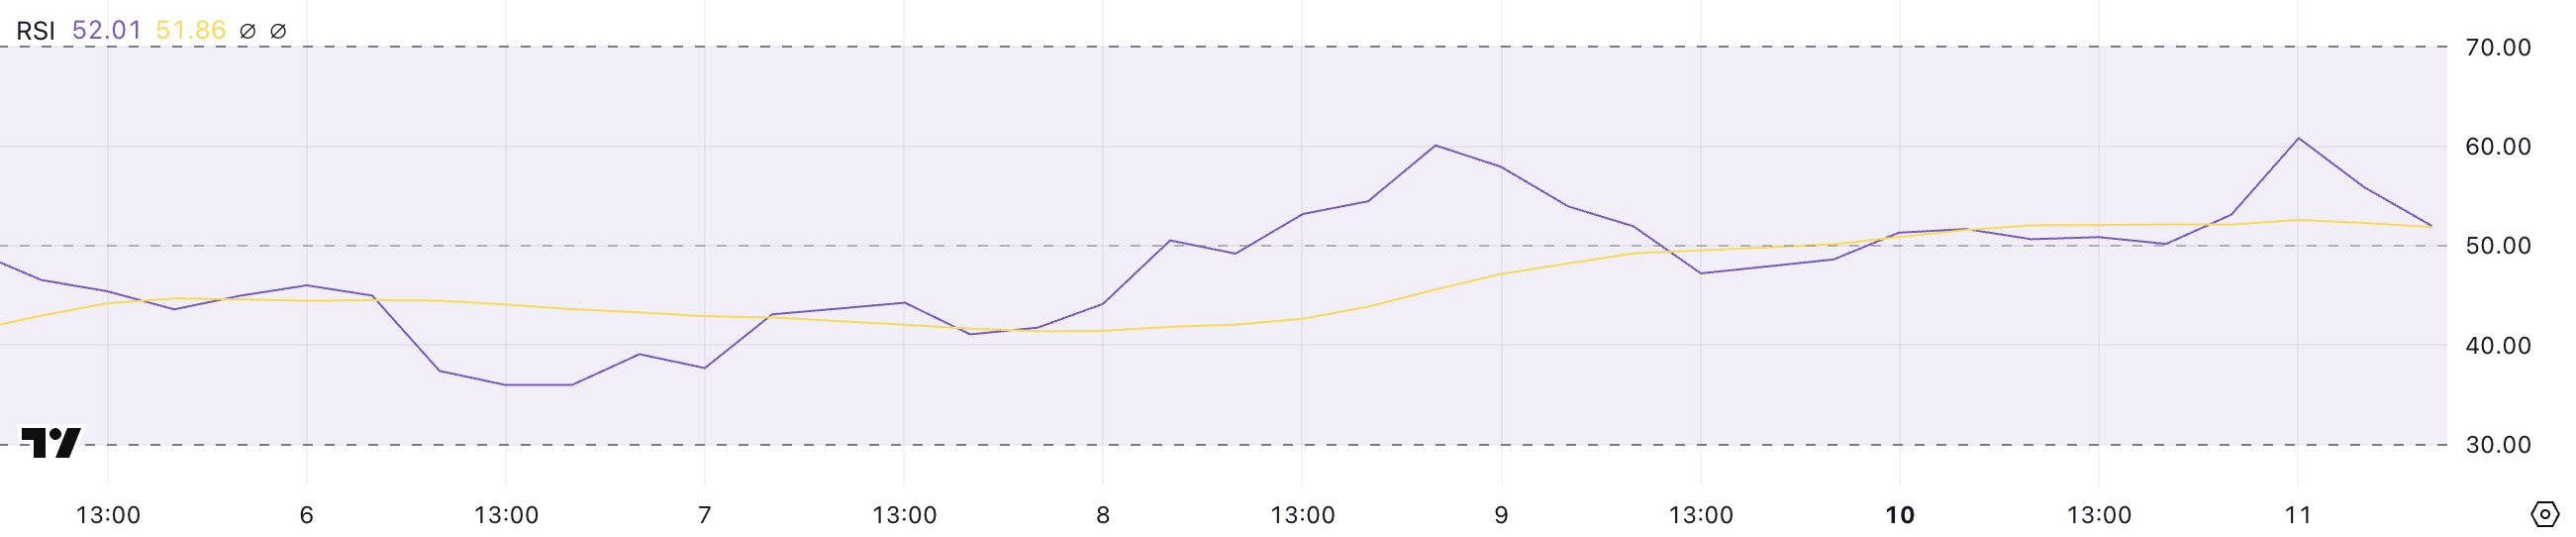
With the meme coin’s RSI now sitting at 52, it indicates that the recent bullish momentum has faded slightly, but the price is not yet in a bearish state. While RSI above 50 can suggest slight bullish strength, it is not strong enough to confirm a breakout.
If SHIB can regain momentum and push RSI back above 60, it could signal increasing buying pressure and a potential continuation of the uptrend.
However, if RSI continues to decline below 50, it may indicate weakening demand, leaving SHIB vulnerable to further consolidation or even a pullback.
Shiba Inu BBTrend Is Now Positive, But Still Low
Shiba Inu BBTrend indicator has turned positive, currently at 2.29, after spending six consecutive days in negative territory and reaching a low of -19.3 on February 6. The BBTrend, or Bollinger Bands Trend, is a volatility-based indicator that helps determine the strength and direction of a trend.
A positive BBTrend value suggests bullish momentum, while a negative value indicates bearish pressure. The deeper the negative reading, the stronger the selling pressure, whereas higher positive values signal an increasing uptrend.

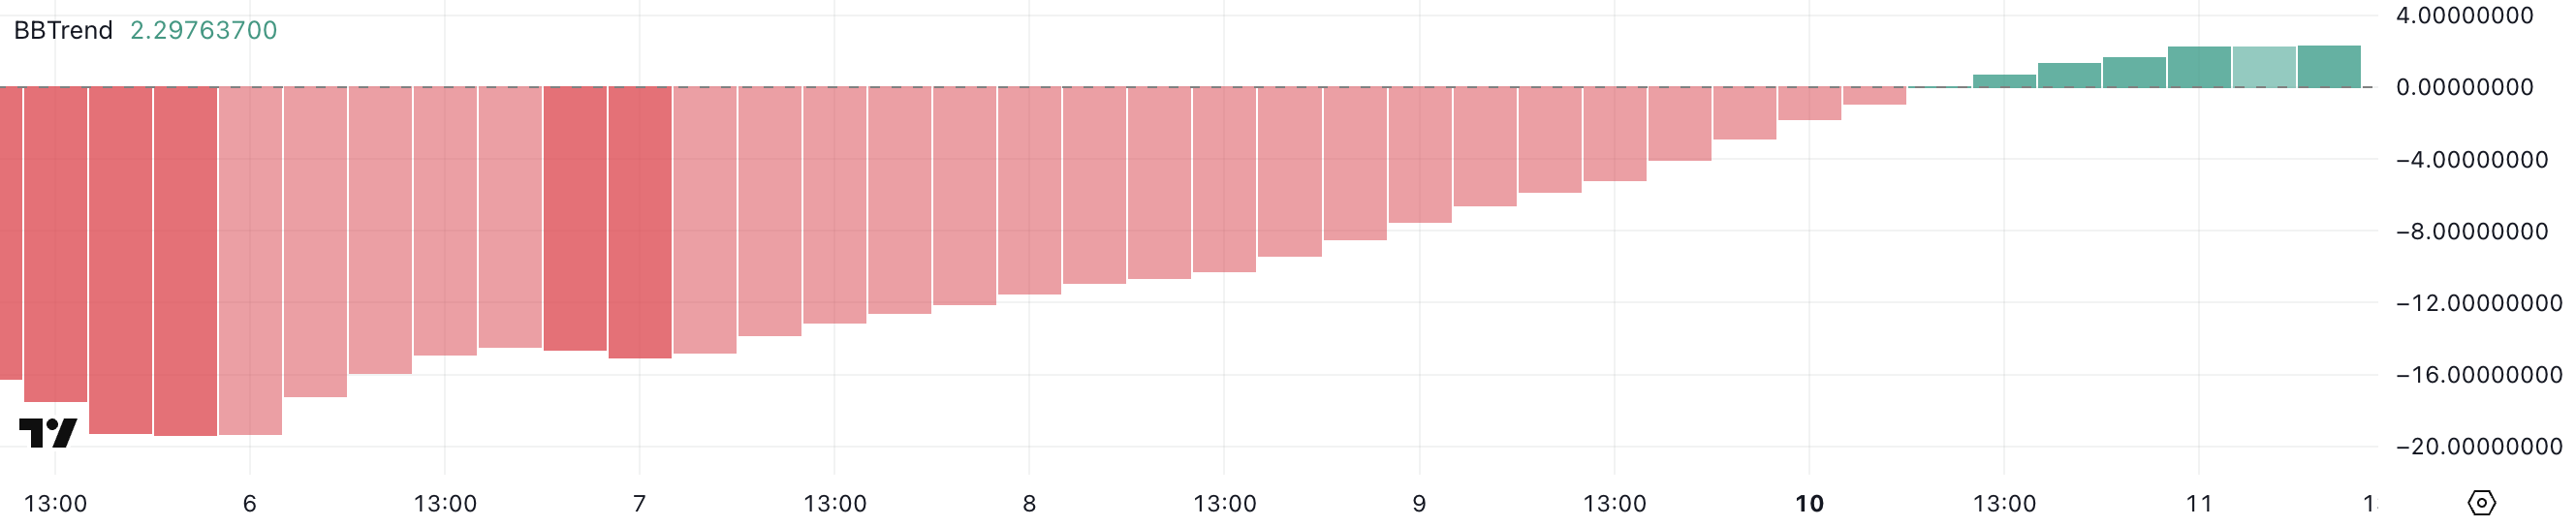
With SHIB BBTrend now at 2.29, the shift from negative territory suggests that bearish momentum has weakened, and buying pressure is starting to build. While this does not yet confirm a strong uptrend, it indicates a potential transition toward a more bullish structure.
If BBTrend continues rising, it could signal increasing volatility in favor of buyers, pushing SHIB toward further gains.
However, if the indicator struggles to move higher or turns negative again, it would suggest that the recent recovery lacks strength, leaving SHIB at risk of renewed downward pressure.
SHIB Price Prediction: A Potential 57% Surge
Shiba Inu’s EMA lines suggest that a golden cross could form soon. A golden cross is a bullish signal that occurs when a short-term moving average crosses above a long-term moving average. If this pattern materializes, SHIB price could gain momentum and first test the resistance at $0.000017.
A breakout above this level could push the price higher toward $0.000019, and if bullish momentum continues, SHIB could target $0.0000249, representing a potential 57% upside.

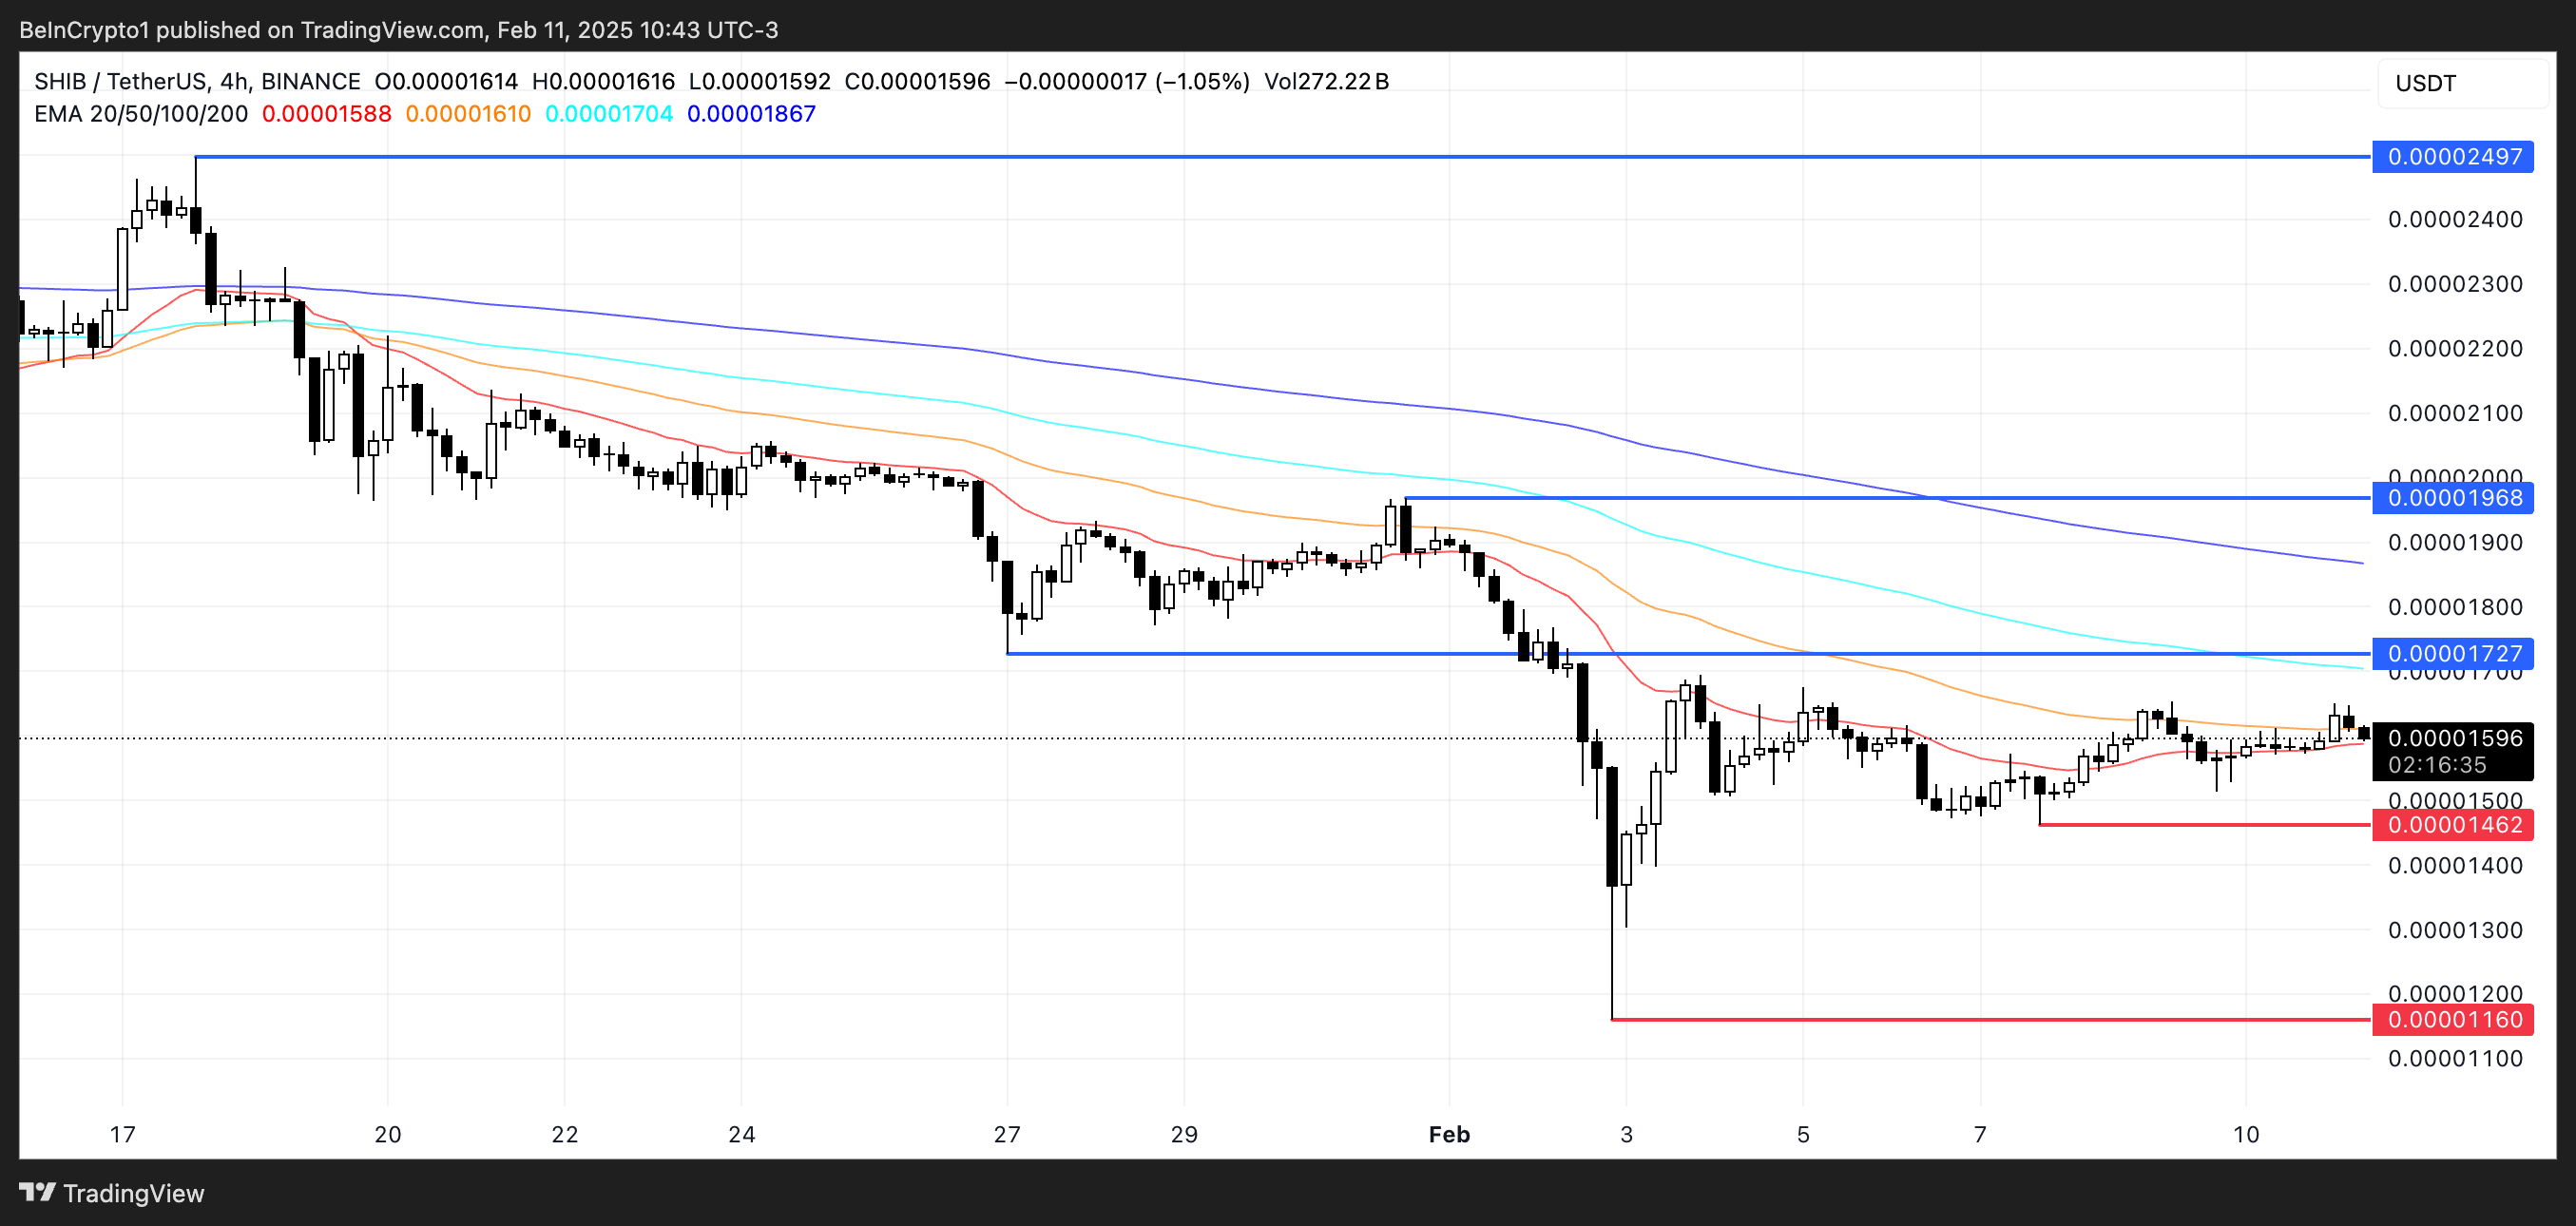
On the other hand, if SHIB price fails to sustain buying pressure and enters a renewed downtrend, it may test the key support at $0.000014.
A breakdown below this level would open the door for further downside, with the price potentially falling to $0.0000116, marking a 27% decline. This would indicate that the bearish momentum seen in recent weeks remains intact, increasing the likelihood of further losses.
Disclaimer
In line with the Trust Project guidelines, this price analysis article is for informational purposes only and should not be considered financial or investment advice. BeInCrypto is committed to accurate, unbiased reporting, but market conditions are subject to change without notice. Always conduct your own research and consult with a professional before making any financial decisions. Please note that our Terms and Conditions, Privacy Policy, and Disclaimers have been updated.