
Market
RWA Tokens to Watch This November

As broader market sentiment improves and trading activity gains momentum, Real World Assets (RWAs) altcoins are also witnessing a rally.
Notable real-world asset tokens, including Maple (MPL), Clearpool (CPOOL), Parcl (PRCL), Chintai (CHEX), and LABS Group (LABS), have demonstrated significant growth in recent weeks and are among the top coins to watch in November.
Maple (MPL)
MPL, the native token of the decentralized lending platform Maple Finance, has witnessed a 39% price growth over the past week, making it one of the key RWA-based altcoins to watch in November. As of this writing, MPL is trading at $24.85, its highest since April.
MPL’s rally over the past seven days has caused its price to cross above its 20-day exponential moving average (EMA) and its 50-day small moving average (SMA). The 20-day EMA tracks the asset’s average price over the past 20 trading days, while its 50-day SMA measures its average price over the past 50 trading days.
When an asset’s price crosses above the 20-day EMA, it suggests a short-term bullish sentiment, potentially signaling that buyers are entering the market, and momentum may continue upward.
Read more: Real World Asset (RWA) Backed Tokens Explained
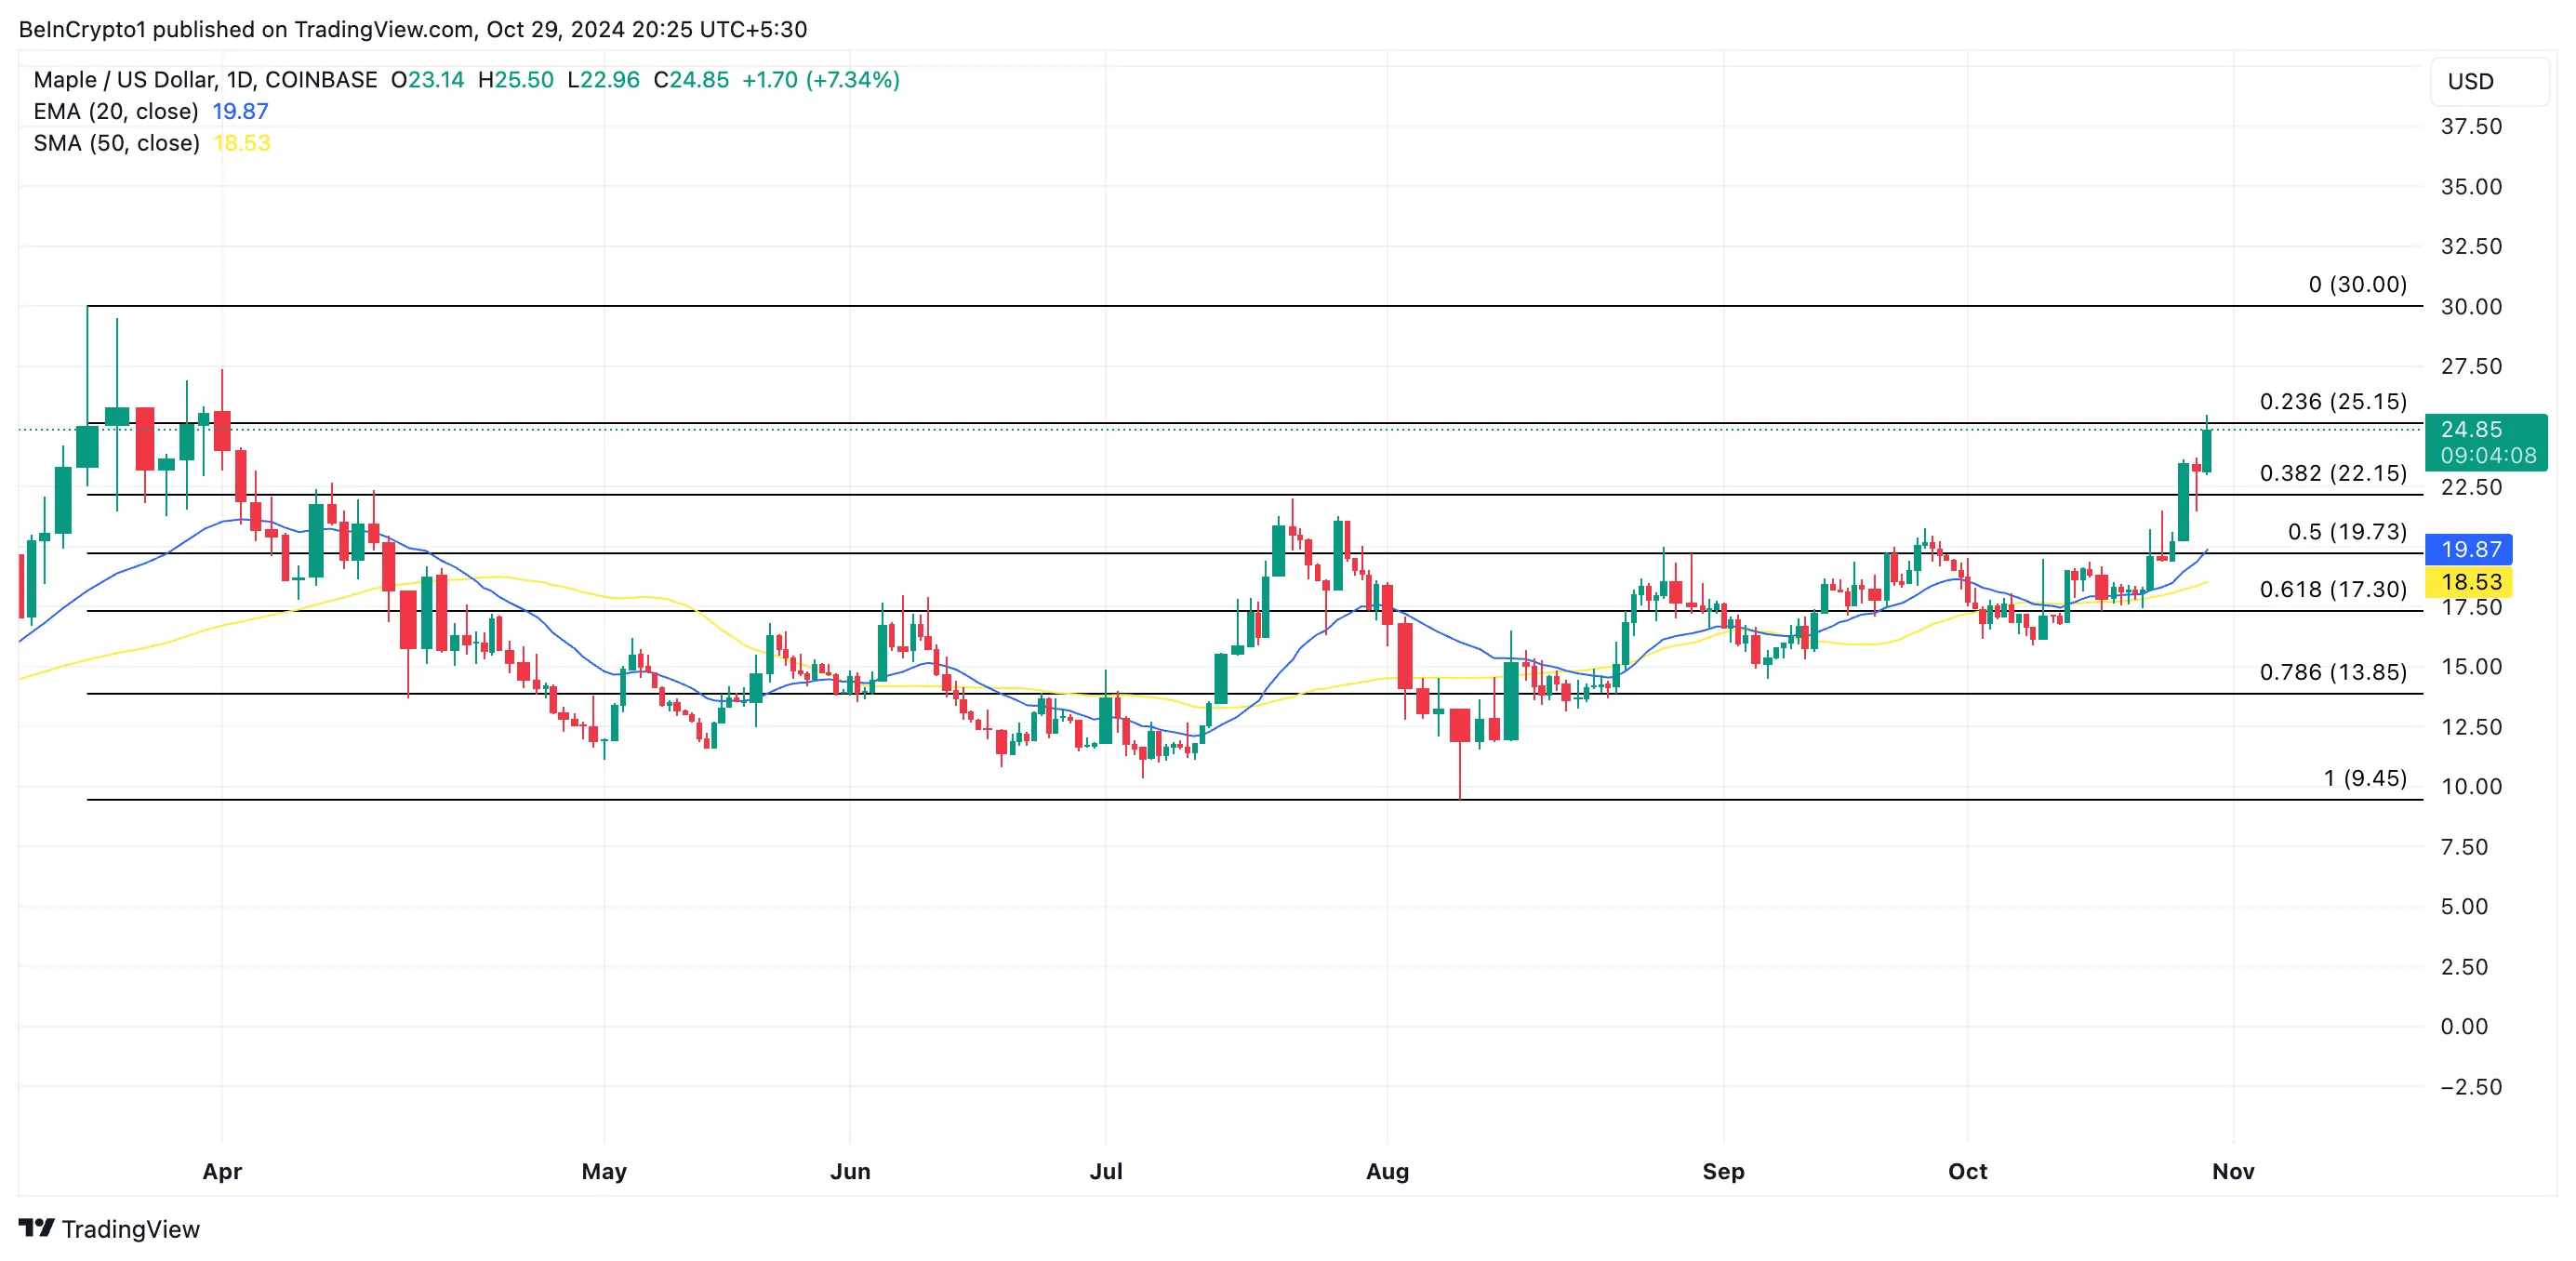
A cross above the 50-day SMA indicates the potential start of a medium-term uptrend, as this crossing suggests sustained buying interest. If this buying pressure persists, MPL’s price will climb to $30, a high last reached in March.
However, an uptick in profit-taking will cause the altcoin’s price to plummet toward $19.73, where major support lies. If this level fails to hold, MPL’s value will drop further to $17.30.
Clearpool (CPOOL)
Clearpool is a decentralized capital market platform that connects institutional borrowers with decentralized finance (DeFi) lenders. It is powered by its CPOOL token, whose value has skyrocketed by 32% in the last seven days, making it another RWA token to pay attention to in November.
As of this writing, CPOOL’s Aroon Up Line is 100%, confirming the strength of its current uptrend. The Aroon indicator measures the strength and direction of a trend. When the Aroon Up Line reaches 100%, it suggests that bullish sentiment is dominant, with buyers pushing the price higher and achieving a peak within the most recent period.
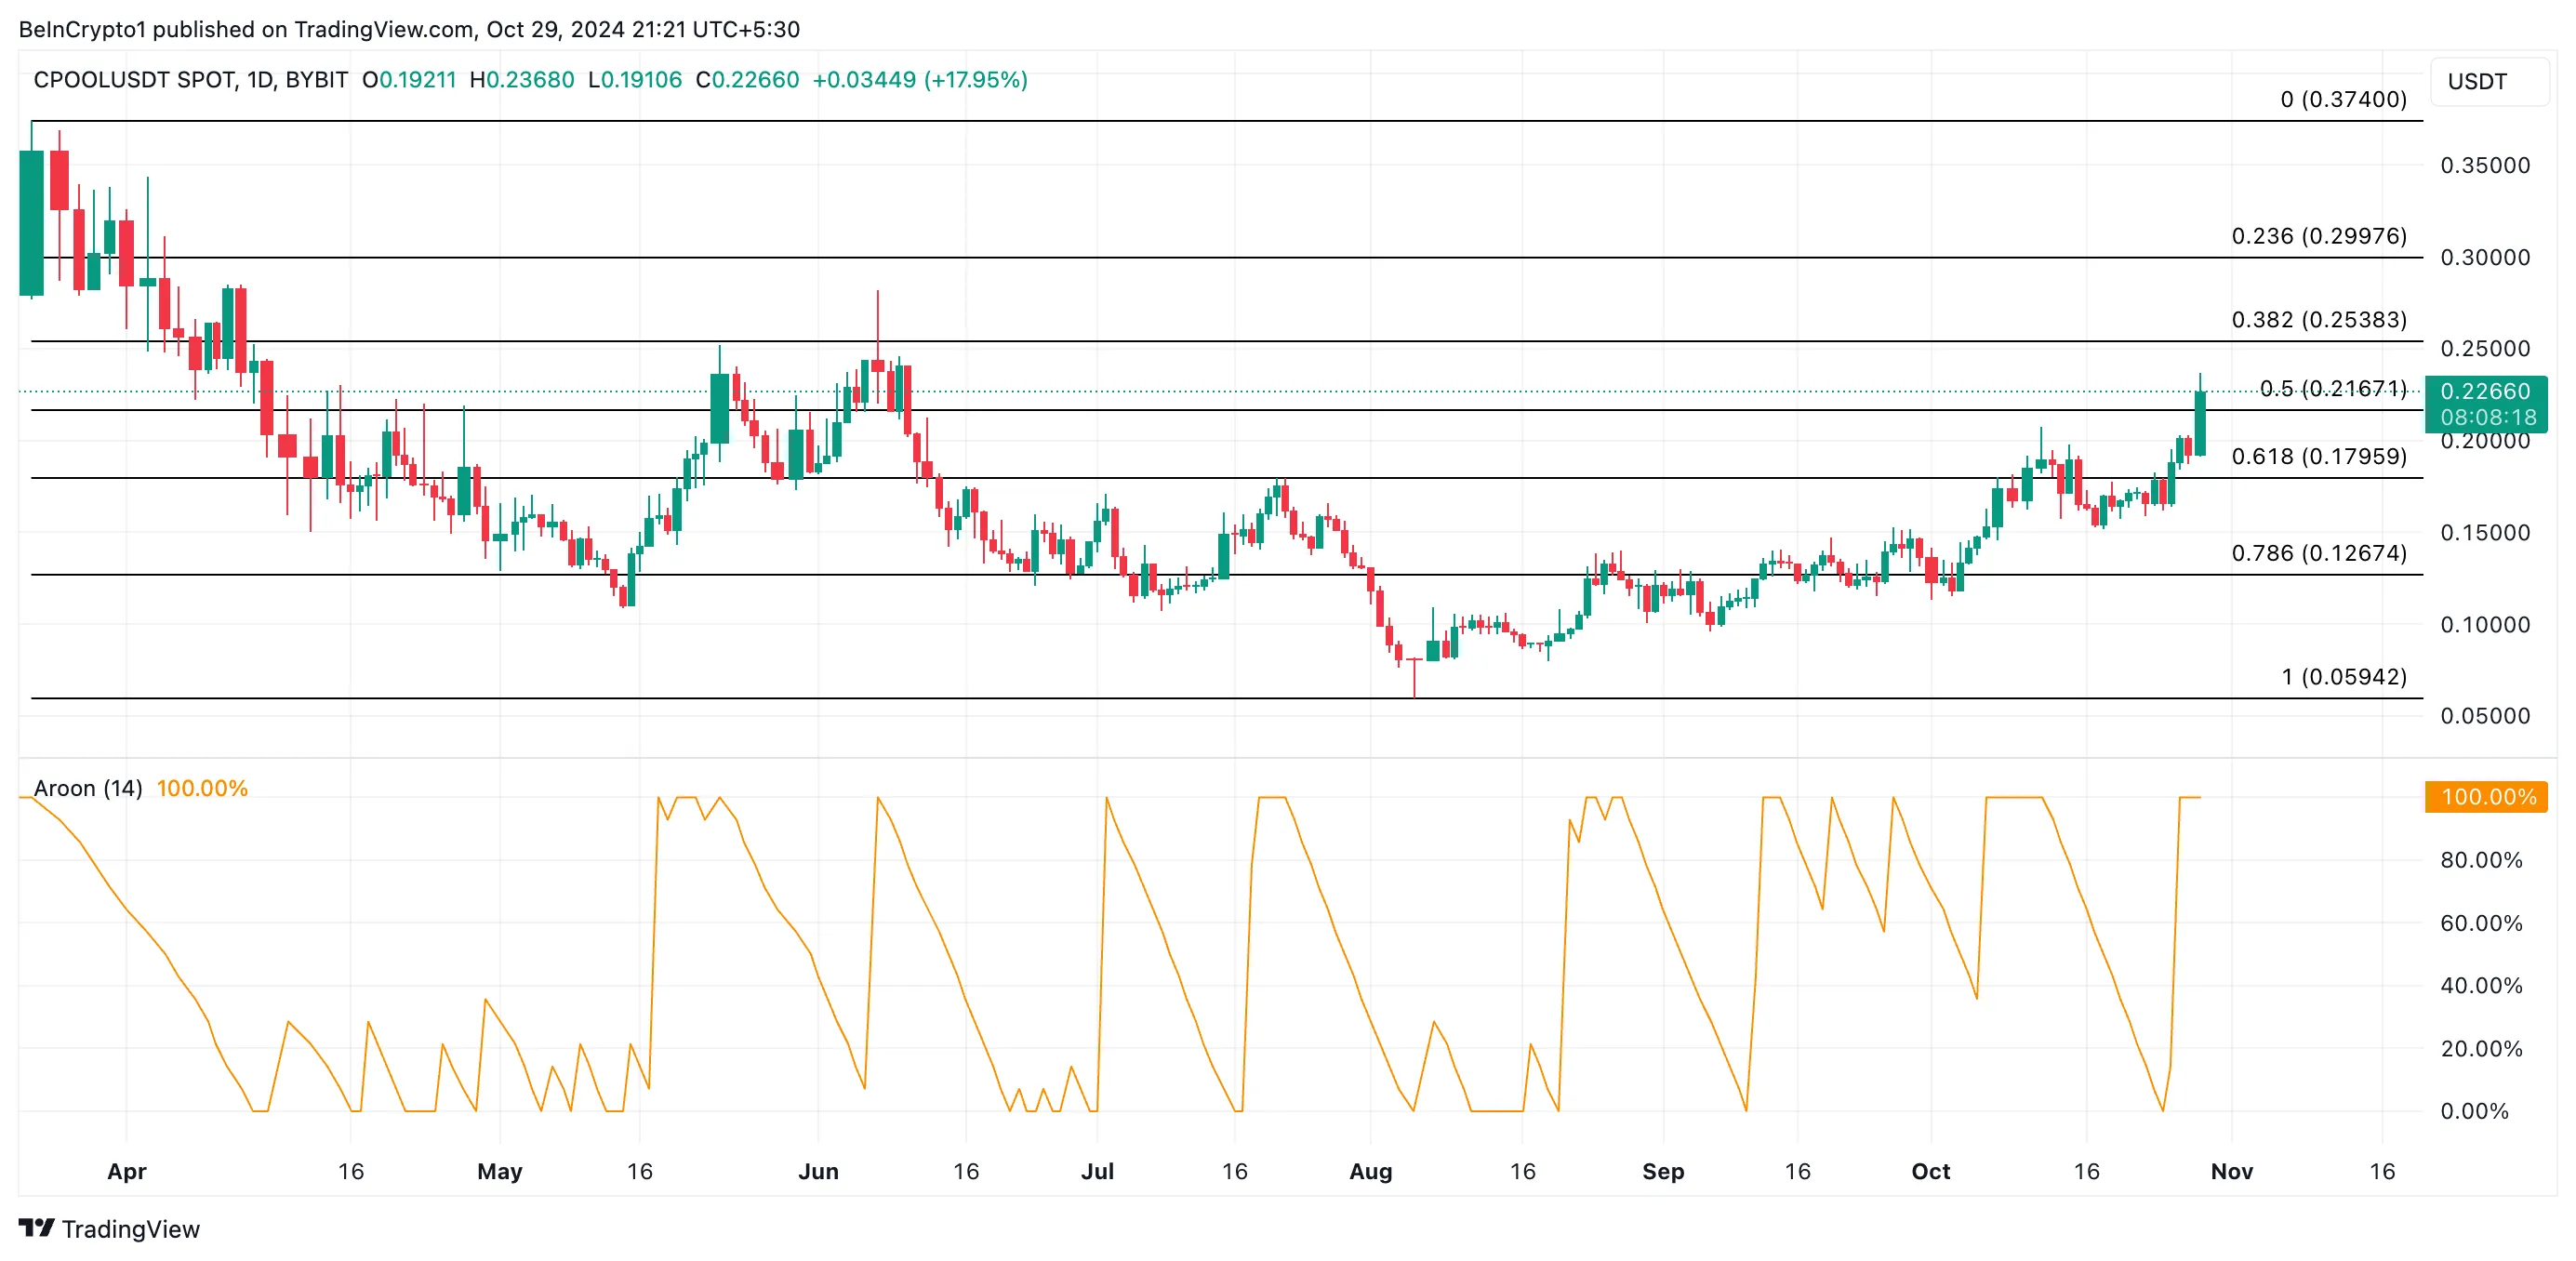
If CPOOL’s uptrend strengthens, its price could rise to $0.25, the most critical barrier between its current value of $0.22 and the yearly high of $0.37. A successful break above this barrier would set it on track to approach this price peak.
Parcl (PRCL)
Parcl is a decentralized real estate trading platform. Its native token has recorded a 28% price growth in the past seven days. The growing demand for the altcoin is reflected in its rising Relative Strength Index (RSI), which tracks market conditions to identify whether an asset is overbought or oversold.
At press time, PRCL’s RSI is in an uptrend at 60.13. This RSI reading indicates strong buying activity and suggests the potential for an extended rally.
If the demand for the altcoin is sustained, it will attempt a break above $0.31, a high it last reached in June. Should buying pressure remain, PRCL will continue its rally toward $0.46, where critical resistance lies.
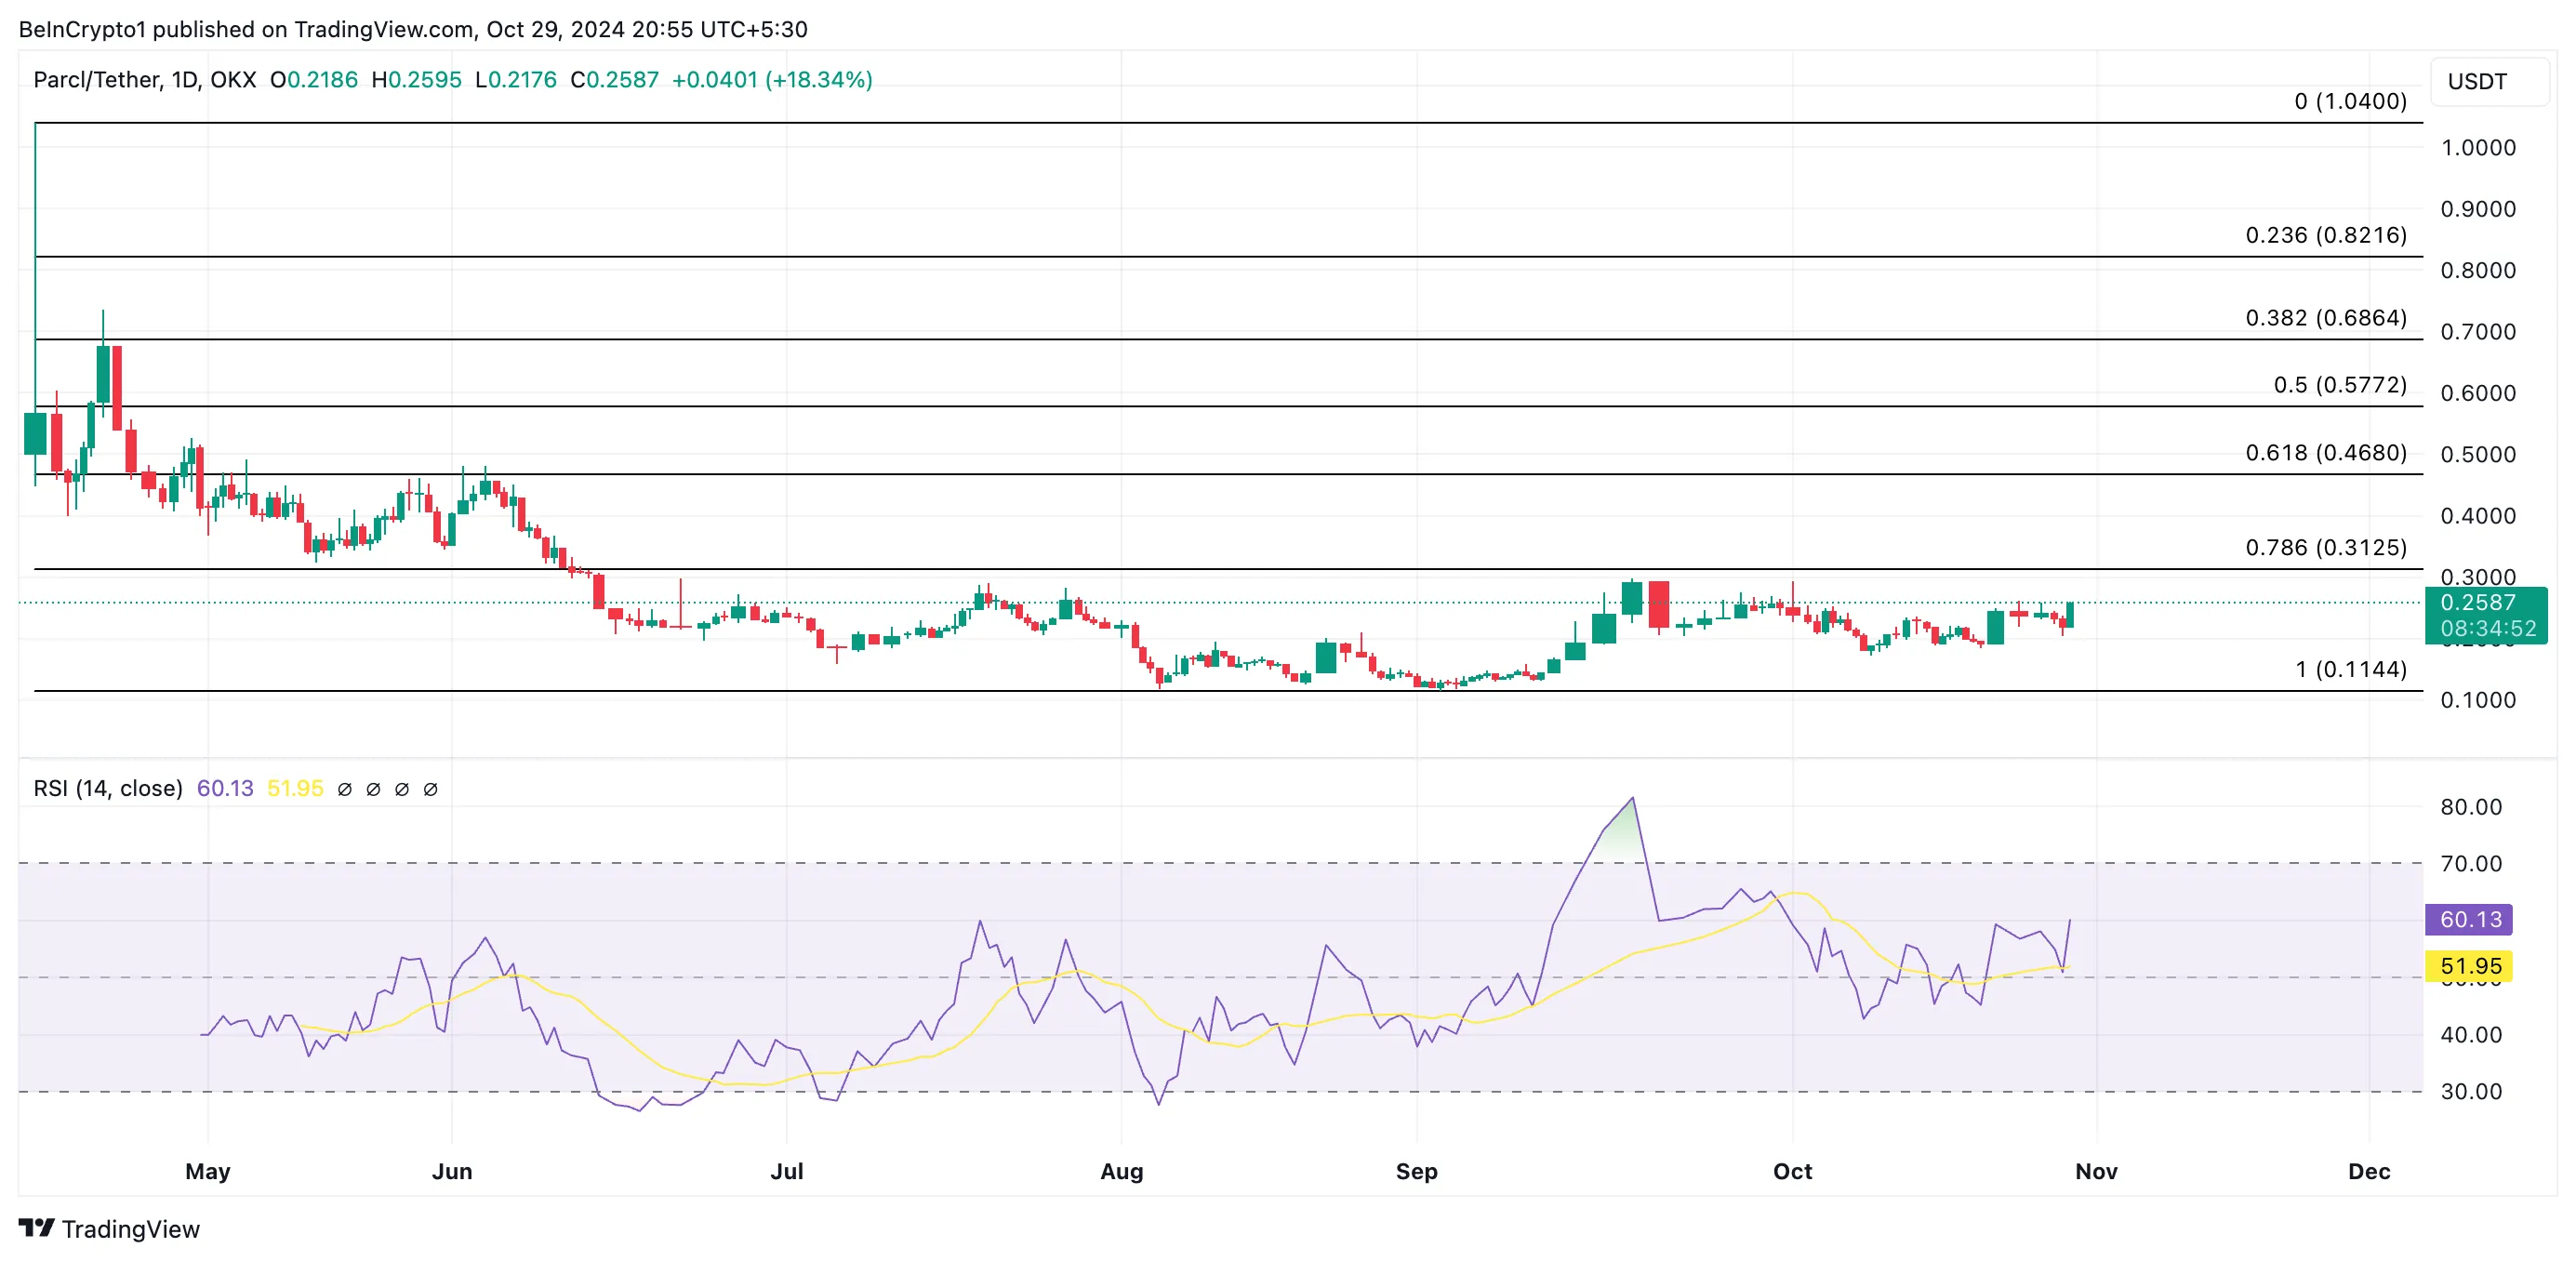
However, this bullish projection will be invalidated if bearish sentiment grows. If selling pressure gains momentum, PRCL’s price will fall to its all-time low of $0.11.
Chintai (CHEX)
CHEX, the utility token of the Chintai Network, is currently trading at $0.30, marking a 22% increase over the past month. Moving average convergence/divergence (MACD) readings suggest the potential for an extended price rally, with CHEX’s MACD line (blue) positioned above its signal line (orange).
The MACD is an indicator that tracks an asset’s price trends and momentum, identifying possible buy or sell signals. When the MACD line crosses and holds above the signal line, it’s considered a bullish signal, indicating that recent price momentum is stronger than in the past — often seen as a buy signal for traders.
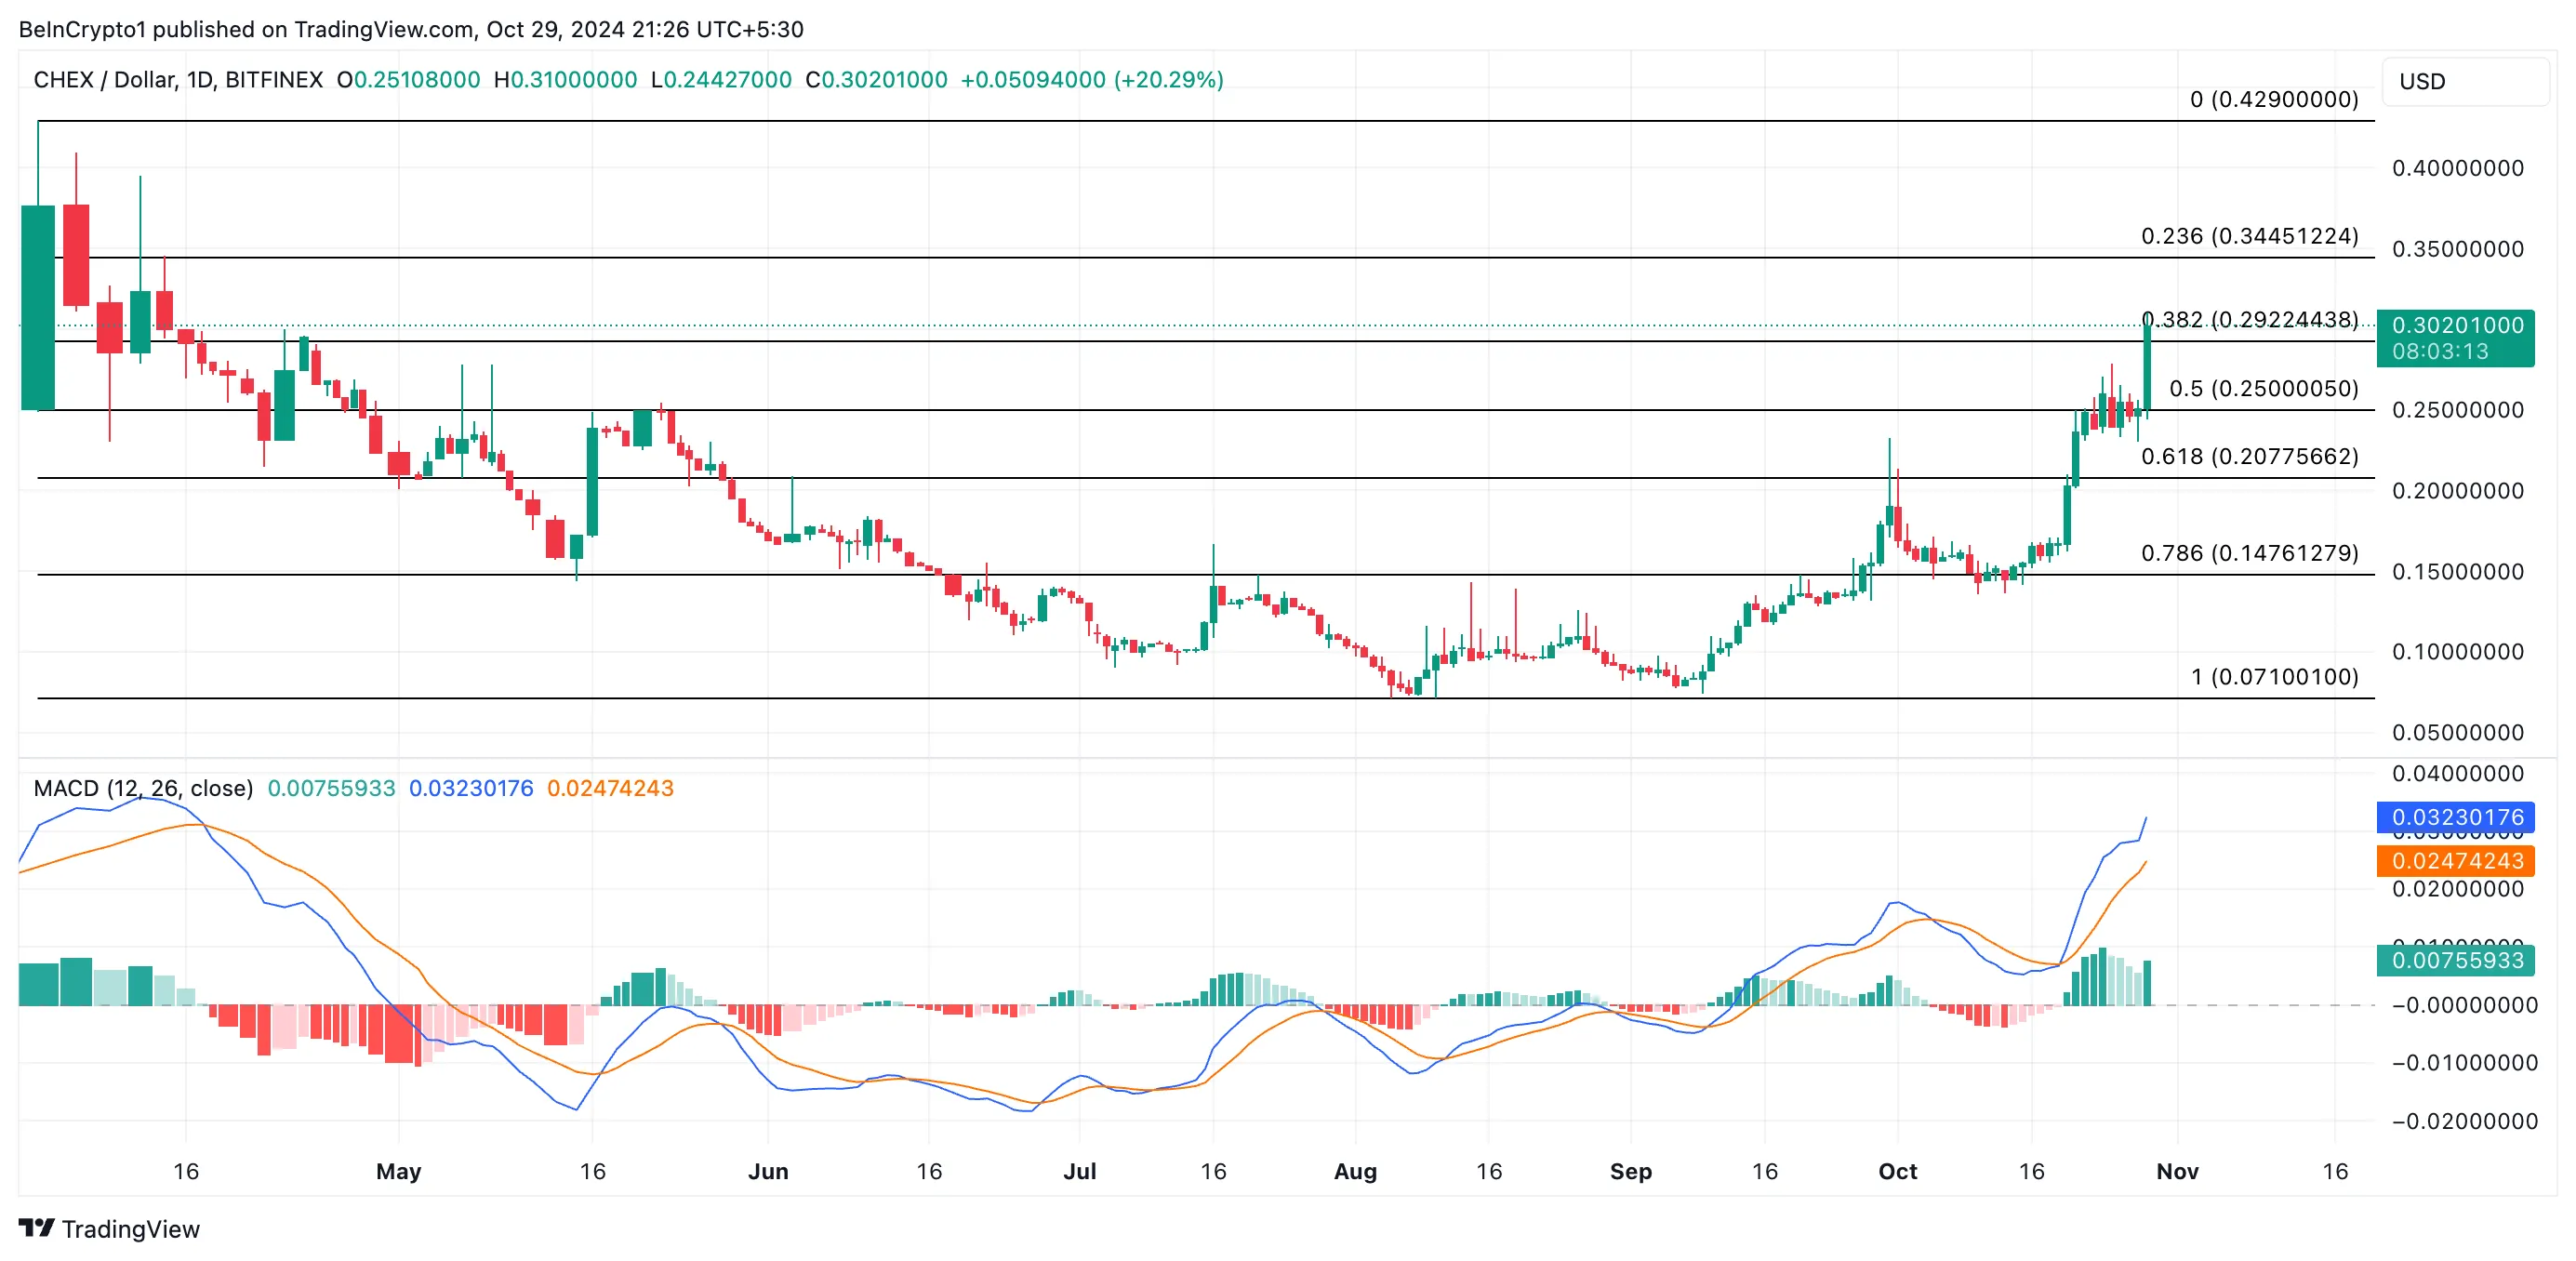
If buying pressure strengthens and the uptrend continues, CHEX may attempt to retest its year-to-date high of $0.42. However, renewed bearish sentiment could push the price down to a key support level around $0.14.
LABS Group (LABS)
LABS Group, powered by its LABS token, fractionalizes real estate assets into digital shares, making it a notable RWA token to watch in November.
The token has surged 14% over the past week, with its Balance of Power (BoP) indicator currently at 0.48, reflecting a bullish bias. The BoP measures the relative strength of buyers against sellers, with positive values indicating buyer control in the market.
Read more: How To Invest in Real-World Crypto Assets (RWA)?
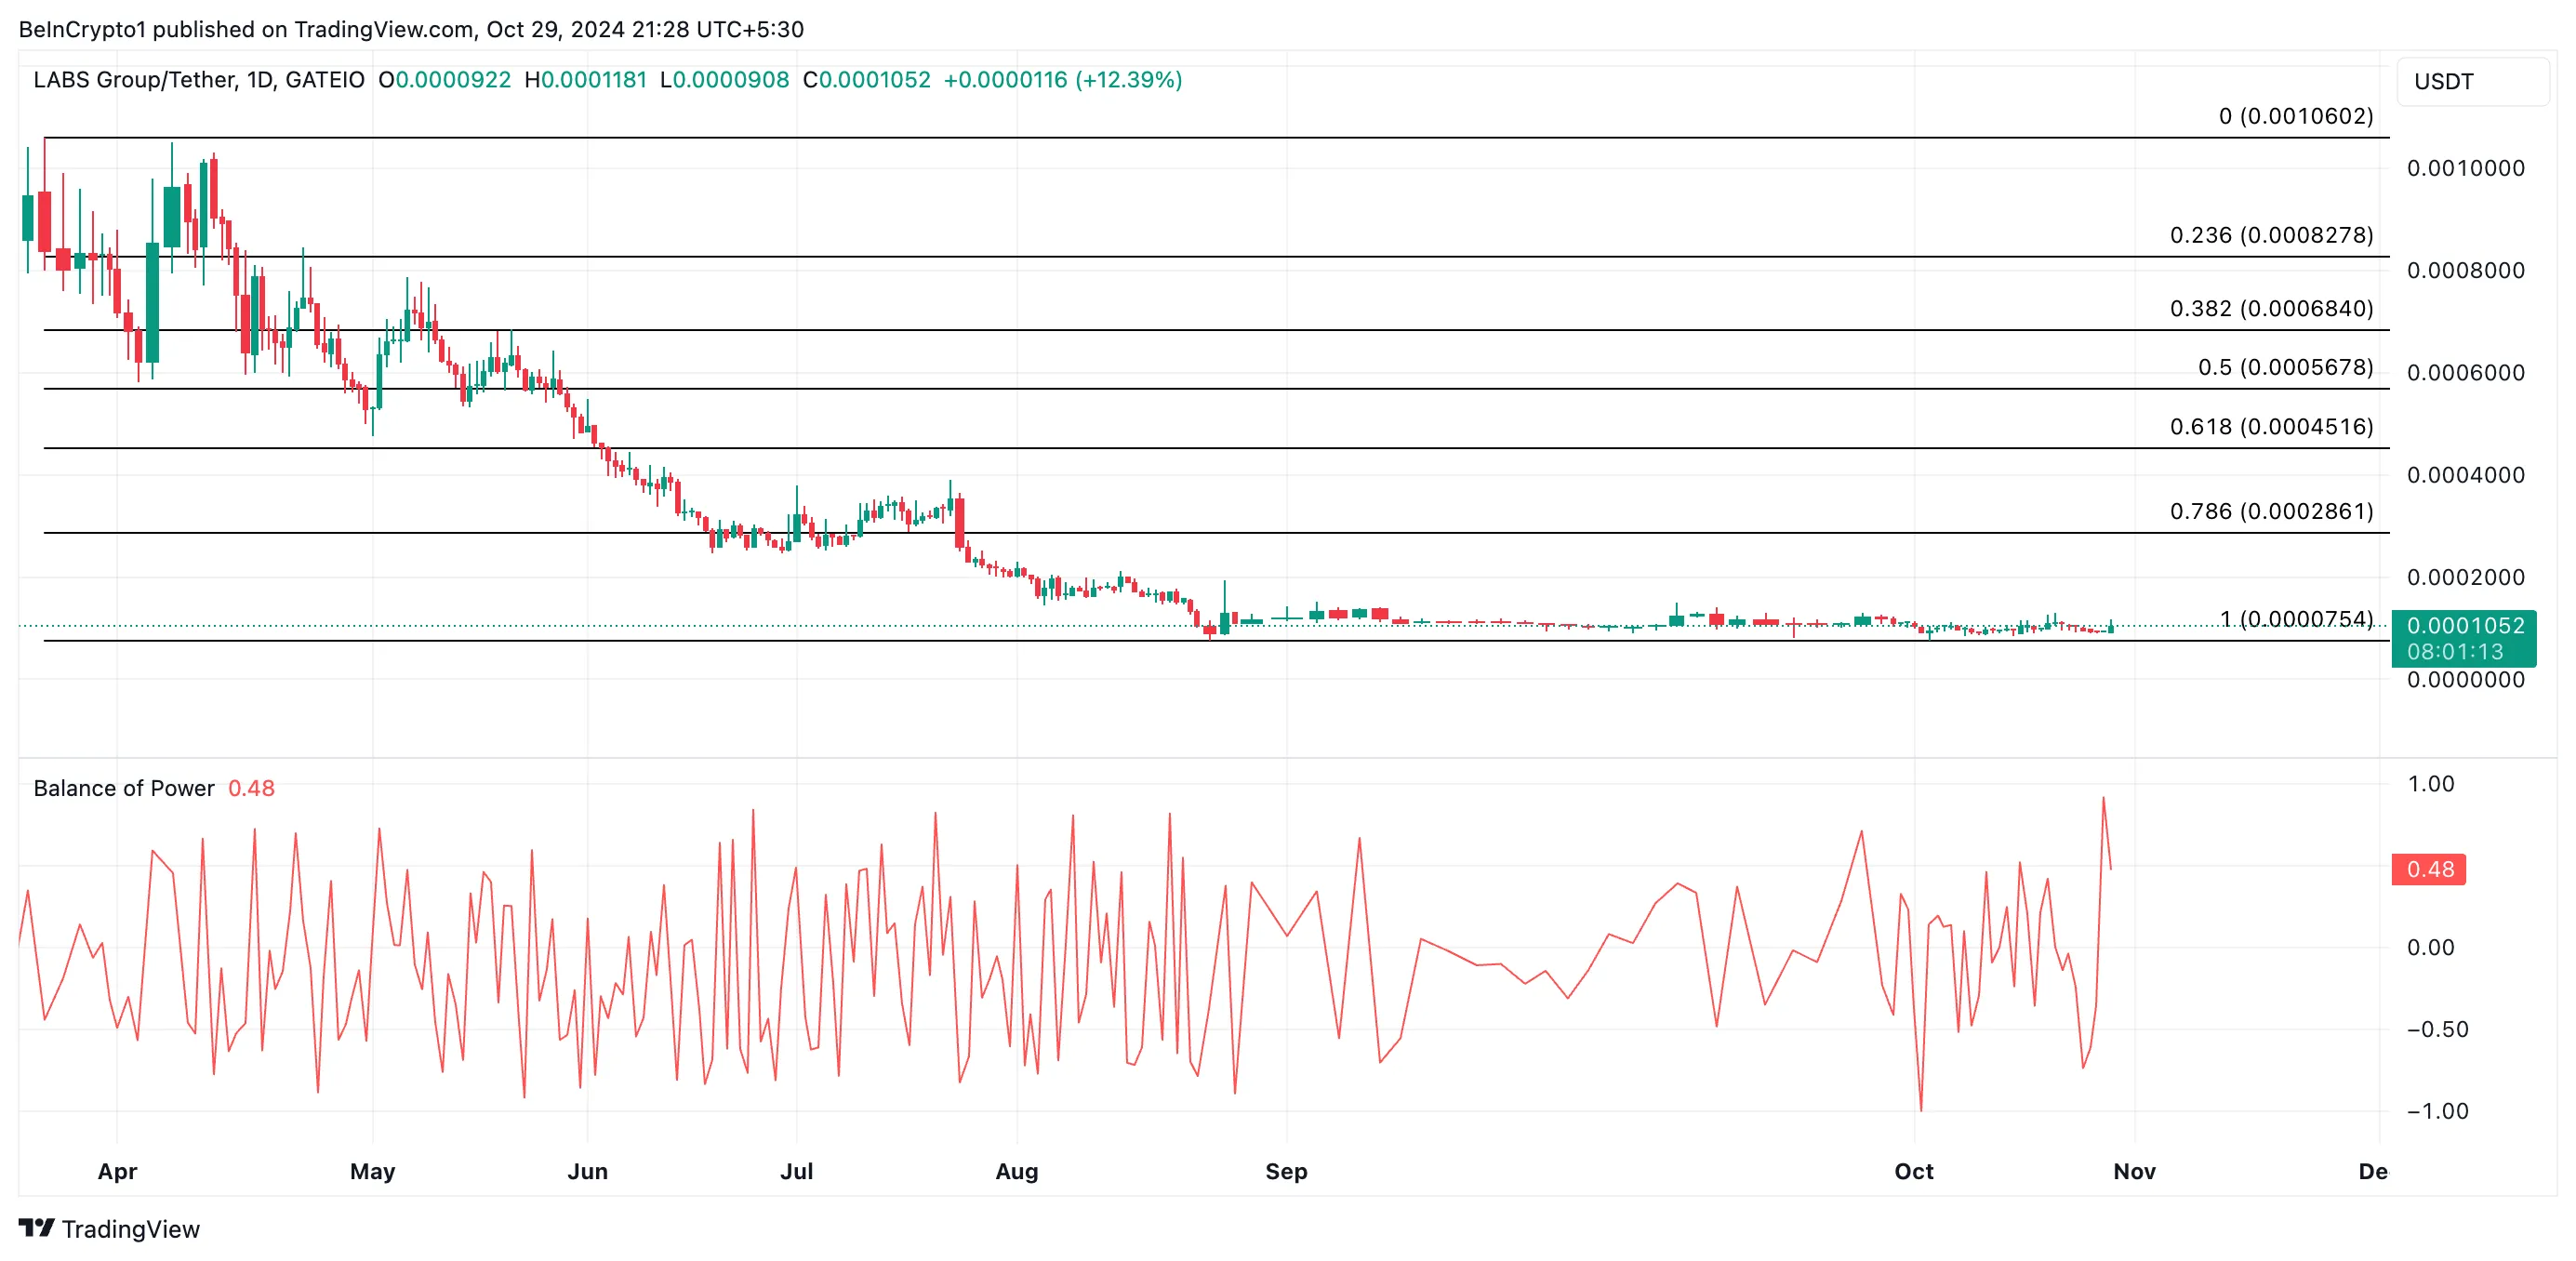
If buying momentum holds, LABS could climb to $0.00028, a level last seen in July. However, reduced token accumulation may drive the price down toward the support level of $0.000075.
Disclaimer
In line with the Trust Project guidelines, this price analysis article is for informational purposes only and should not be considered financial or investment advice. BeInCrypto is committed to accurate, unbiased reporting, but market conditions are subject to change without notice. Always conduct your own research and consult with a professional before making any financial decisions. Please note that our Terms and Conditions, Privacy Policy, and Disclaimers have been updated.


The Solana-based meme coin FARTCOIN has once again claimed its spot as the market’s top gainer, surging to a two-month high of $0.73.
It has seen an impressive 39% price increase over the past 24 hours, reflecting a notable uptick amid an otherwise declining market.
FARTCOIN Defies the Odds, Soars to Two-Month High
FARTCOIN plunged to a year-to-date low of $0.19 on March 10. This presented a buying opportunity for the meme coin holders, who have since increased their buy orders for the token. Trading at a two-month high of $0.72 as of this writing, FARTCOIN’s value has since soared by 279% in the past month.
On the daily chart, FARTCOIN’s triple-digit rally has pushed its price above the Leading Span A (green line) of its Ichimoku Cloud. The strengthening bullish momentum is now driving the altcoin toward the Leading Span B (red line) of this indicator, a breakout of which would further validate FARTCOIN’s current bull run.
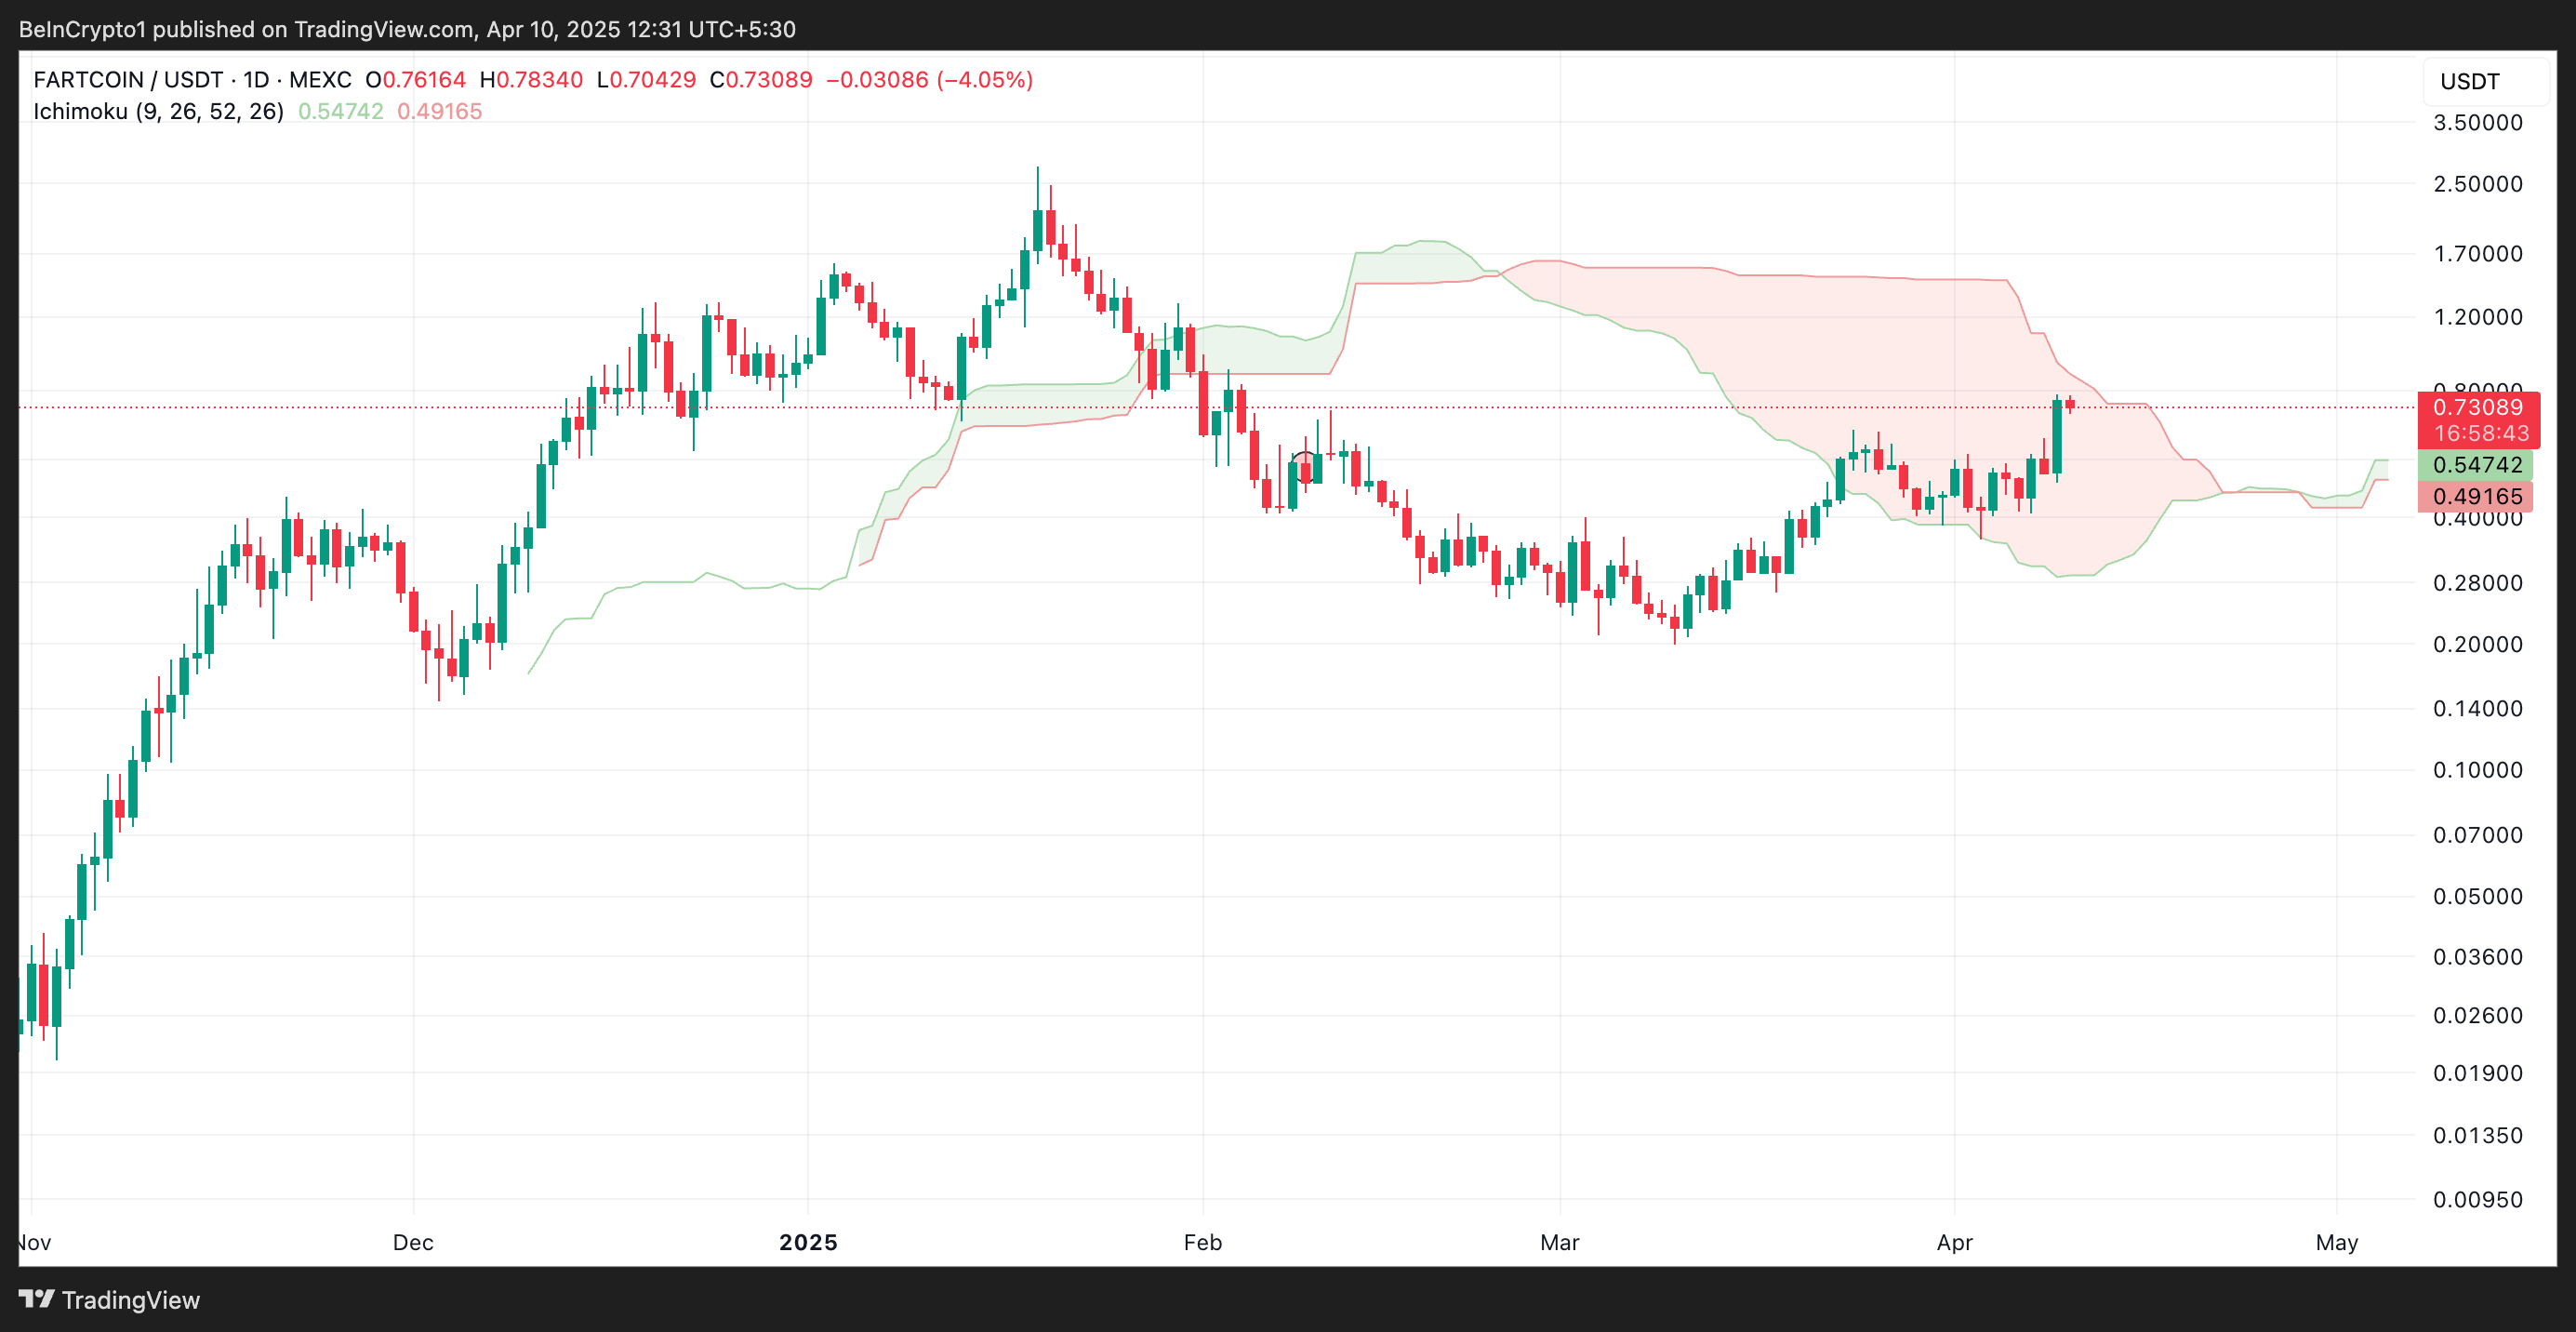
The Ichimoku Cloud tracks the momentum of an asset’s market trends and identifies potential support/resistance levels.
When an asset’s price breaks above Leading Span A and is poised to break above Leading Span B, it signals a strengthening bullish trend. This hints at the potential for further upward movement as FARTCOIN moves into a more favorable market position.
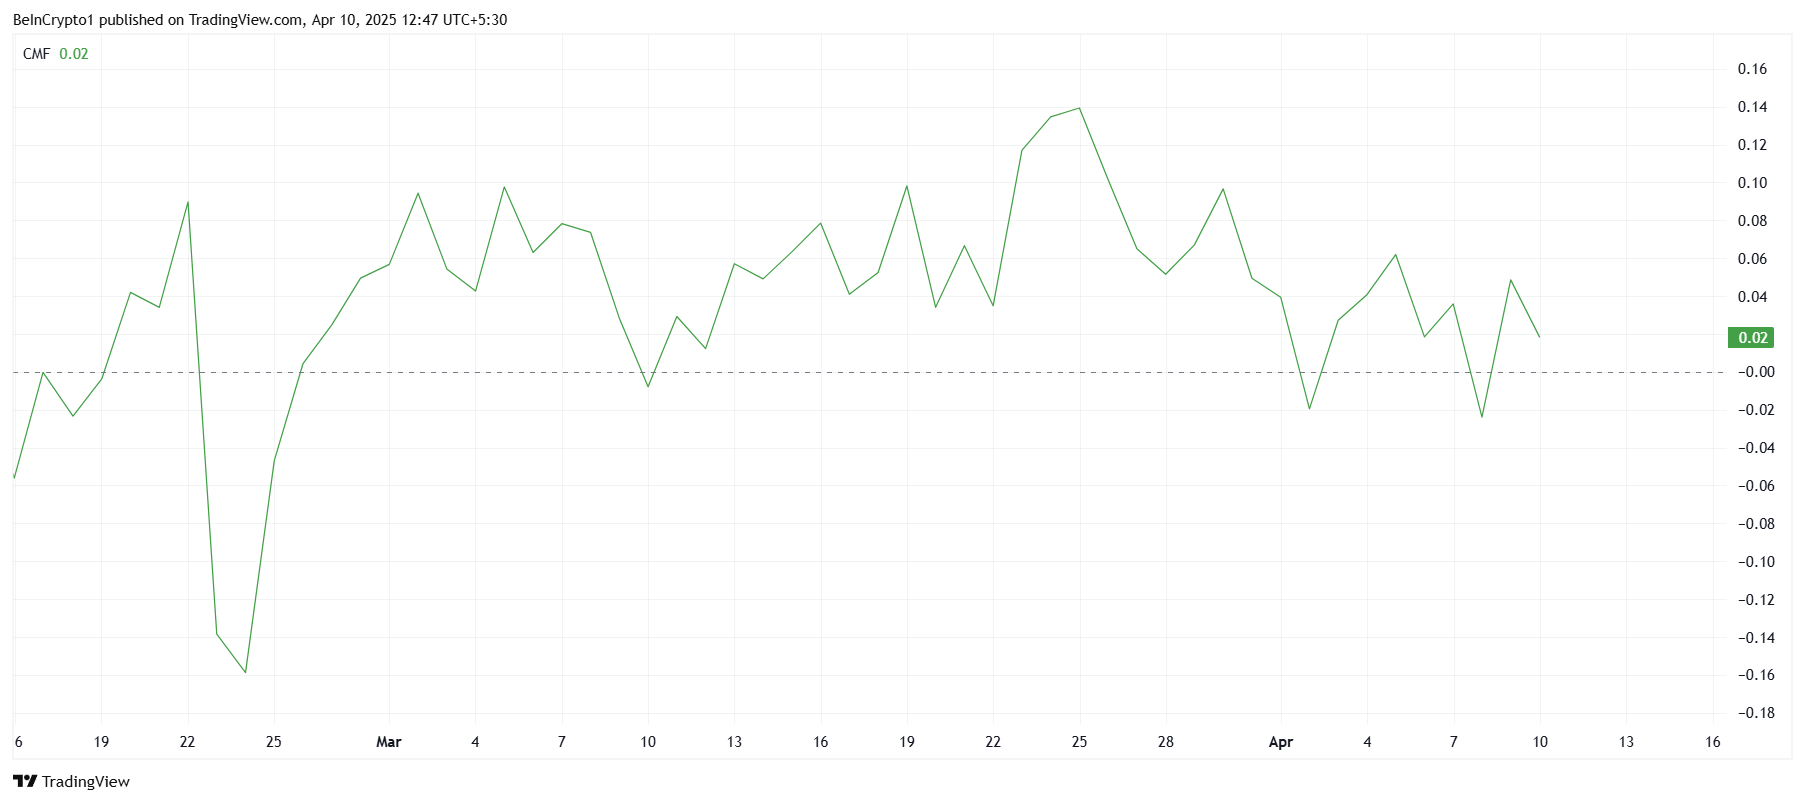
Further, the altcoin’s Chaikin Money Flow (CMF) remains above the zero line, confirming the preference for FARTCOIN accumulation over selloffs. At press time, this momentum indicator, which measures how money flows into and out of an asset, is at 0.13.
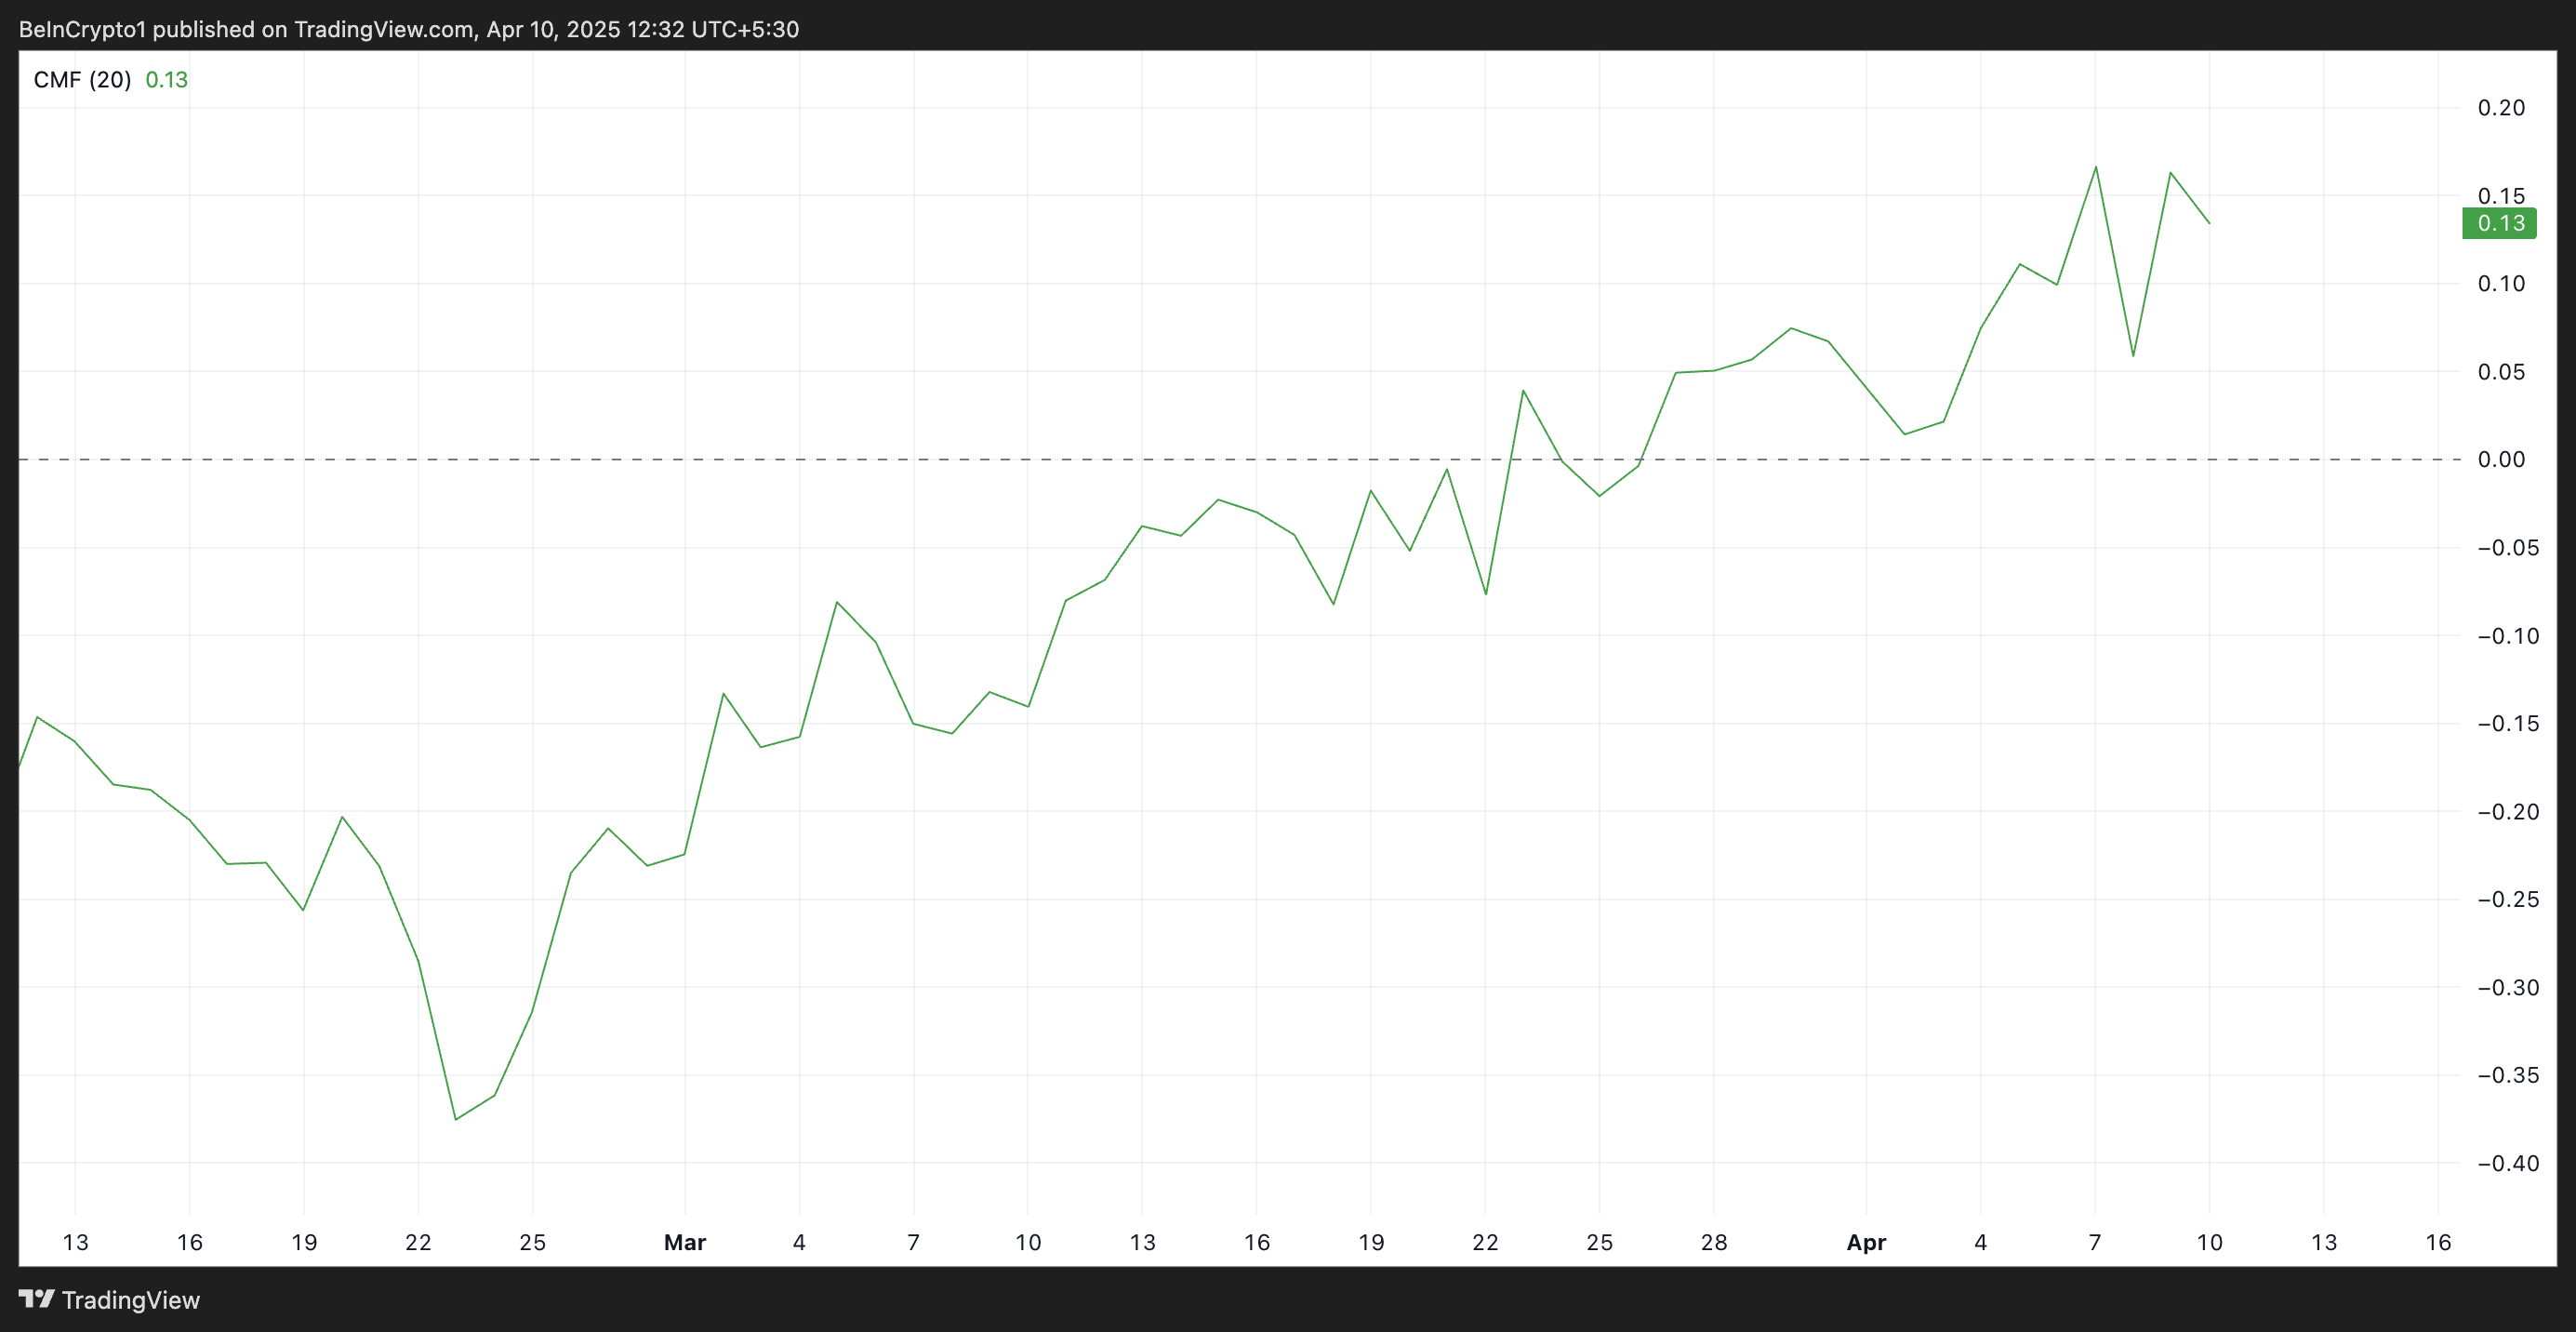
A positive CMF reading during a rally like this indicates strong buying pressure and market participation, as the volume of buy orders outweighs sell orders. This suggests that FARTCOIN’s rally is supported by solid demand, reinforcing the sustainability of the upward movement.
FARTCOIN is on Track for $1
Since its rally began on March 10, FARTCOIN has traded within an ascending parallel channel. This bullish pattern confirms the growing demand for the meme coin.
If buying pressure strengthens, FARTCOIN could extend its gains. In that case, its price could break above the Leading Span B, which currently forms a dynamic resistance above its price. A successful break above this level could propel the token toward $1.
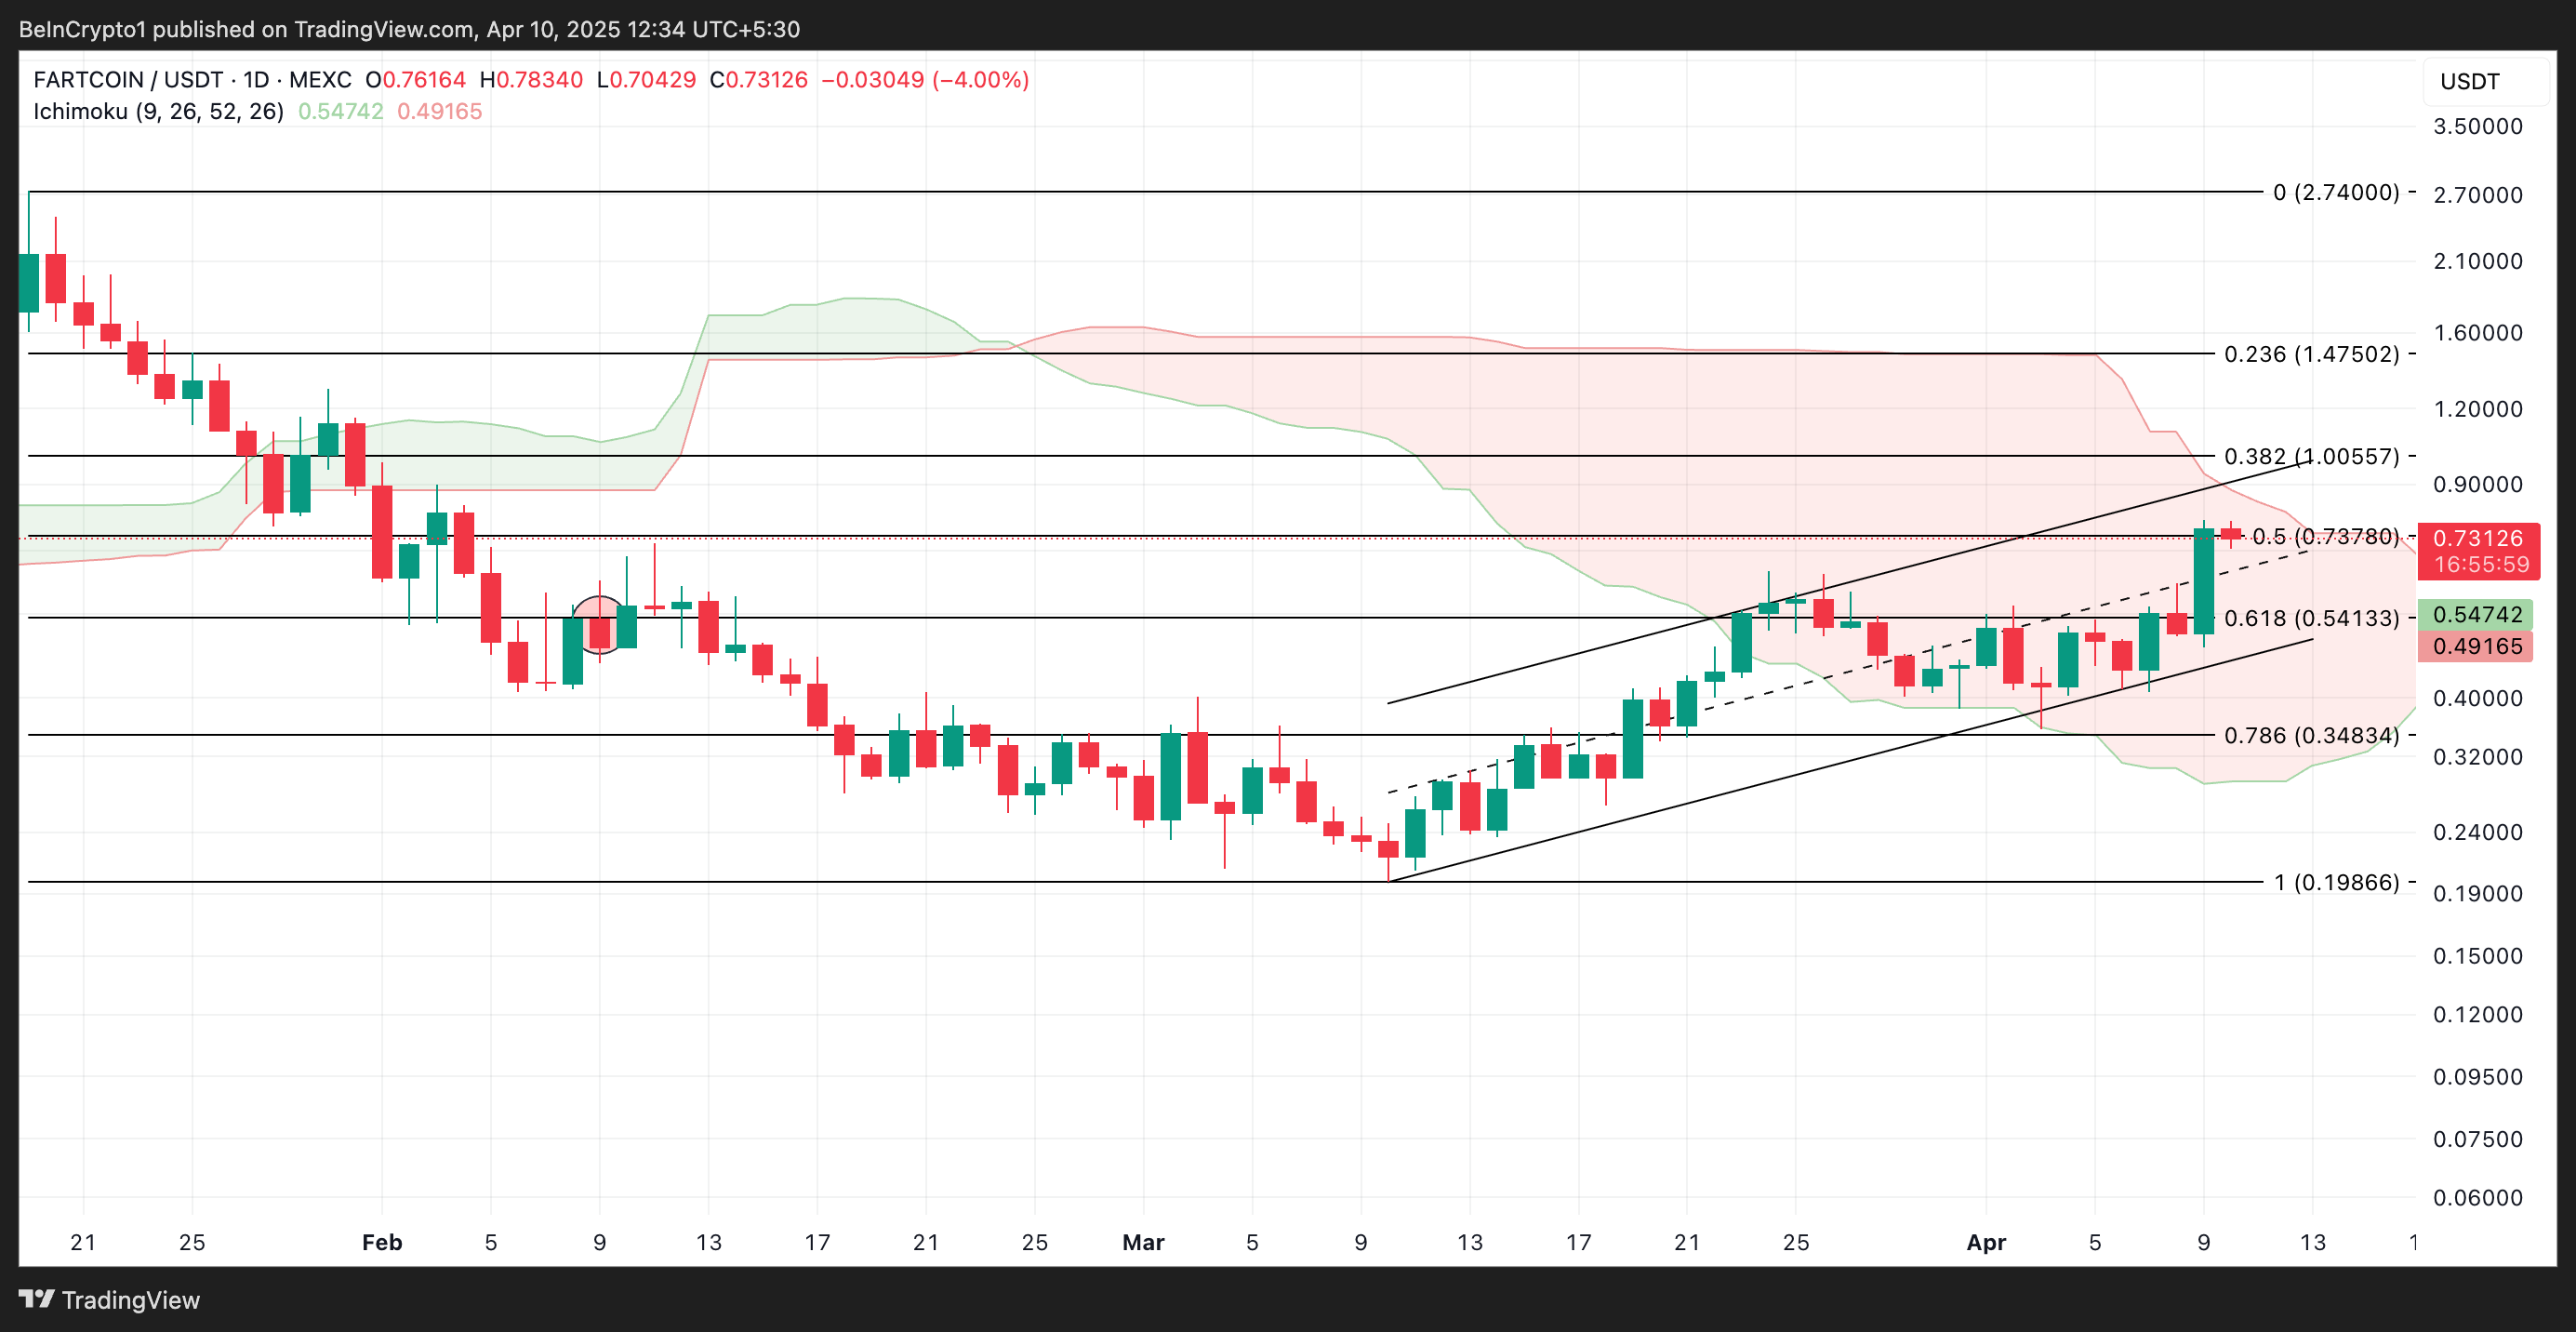
However, if profit-taking resumes, this bullish projection will be invalidated. In that scenario, meme coin FARTCOIN’s price could dip to $0.54.
Disclaimer
In line with the Trust Project guidelines, this price analysis article is for informational purposes only and should not be considered financial or investment advice. BeInCrypto is committed to accurate, unbiased reporting, but market conditions are subject to change without notice. Always conduct your own research and consult with a professional before making any financial decisions. Please note that our Terms and Conditions, Privacy Policy, and Disclaimers have been updated.

Despite breaking above $3 earlier this year, the XRP price has since gone on to disappoint investors with multiple crashes that have rocked the altcoin. This has seen the cryptocurrency lose almost 50% of its acquired value between late 2024 and early 2025. Nevertheless, this has failed to erode bullish sentiment, with predictions for higher prices dominating the community.
Time To Go Long On The XRP Price?
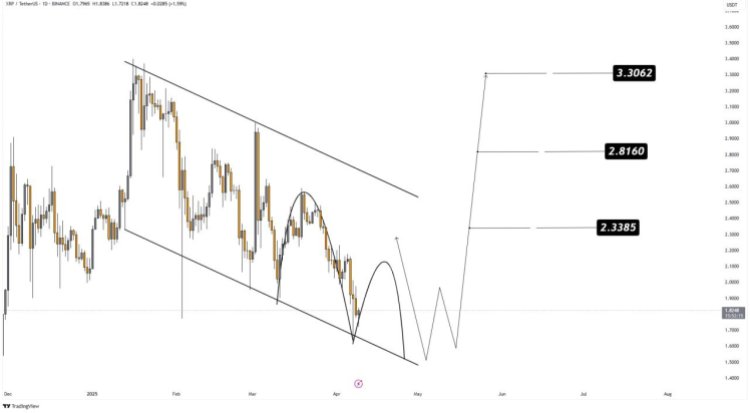
A crypto analyst on X (formerly Twitter) has renewed bullish hope after identifying an important formation on the XRP price chart. The analysis pointed out that the XRP Price is still moving within a descending channel, a formation that usually signals a bearish move.
However, the downtrend has pushed the altcoin’s price to the point where it is now testing the bottom trend line. This bottom trend line has been known to act as strong support previously and is expected to do so this time around.
With the support forming, it is likely that the XRP Price is gearing up for a bounce from this level. Furthermore, the crypto analyst points out that XRP is also forming a rounded bottom inside this descending channel. Such a rounded bottom could signal an end to the downtrend from here.
As the formation grows, the main level of support is now sitting at $1.6. So far, this level has held up quite nicely and bulls have been using it as a bounce-off point for recovery. Given this, the crypto analyst advises that entries for the XRP price are best at around $1.70 to $1.85.
This is not the only good news for the XRP price with support forming. If it holds and the altcoin does indeed bounce from this level toward $2, then the next important levels lie between $2 and $2.2. These serve as the levels for the bulls to beat to confirm a bullish continuation toward a possible all-time high.
If the bulls are successful, then three profit targets are placed by the crypto analyst. These include $2.3385, $2.8160, and $3.3062, pushing it toward January 2025 highs.
The Bearish Case
While the analysis is inherently bullish, there is still the possibility of invalidation that could send the XRP price tumbling further. As the analyst points out, the major support currently lies at $1.6. This means that bulls must hold this level. Otherwise, there is the risk of a much deeper correction as a liquidity sweep could send support further down to $1.3.
Nevertheless, with buy sentiments building once again, it is likely that XRP will follow the bullish scenario in this case.
Chart from TradingView.com

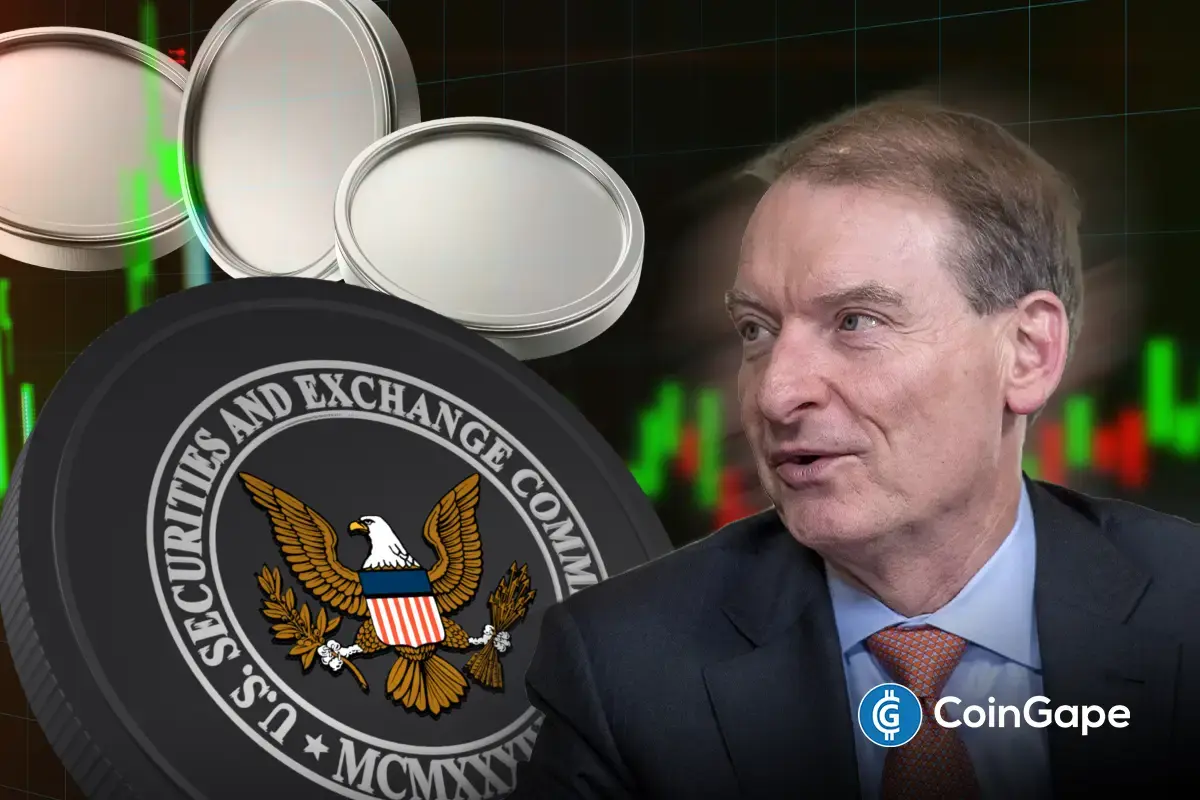
Reserve Rights (RSR) has experienced a notable 22% increase in its price over the last 24 hours. This surge follows the news of Paul Atkins, former Reserve Rights Foundation advisor, becoming the new chair of the US Securities and Exchange Commission (SEC).
Additionally, US President Donald Trump’s decision to pause reciprocal tariffs has added a layer of optimism to the cryptocurrency market, further buoying RSR’s price.
Reserve Rights Investors May Note Profits Soon
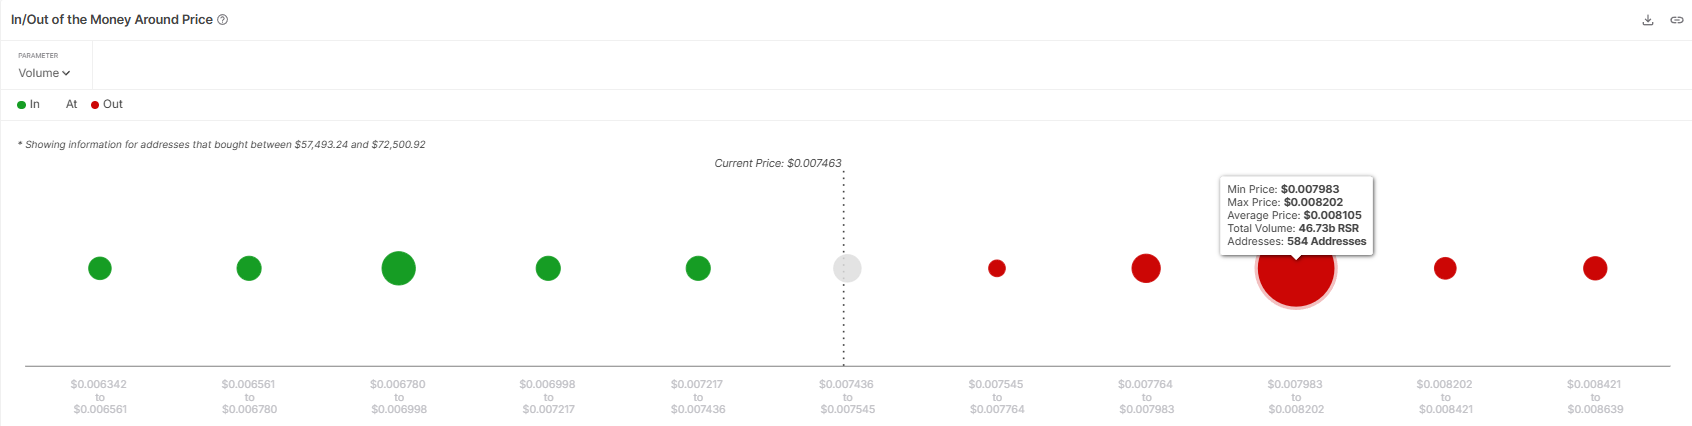
The market sentiment surrounding RSR remains cautiously optimistic, driven by a significant accumulation of tokens. According to the IOMAP, around 46.73 billion RSR tokens, valued at over $350 million, are currently sitting at a price range between $0.007983 and $0.008202.
These tokens have not yet reached a profit zone, but an 8% rally would make them profitable for investors. As these large holders are likely to maintain a bullish outlook, the anticipation of possible profits could further strengthen the buying sentiment, contributing to a price increase.
However, if the holders aim to sell for a break-even, it might negatively impact the RSR price rally.
Despite the news of Paul Atkins becoming SEC Chair, the overall macro momentum for RSR appears to be lackluster. The Chaikin Money Flow (CMF) indicator, which measures market liquidity and investor buying pressure, has not seen any sharp upticks, even after the recent announcements.
This suggests that, while the netflows have been positive, they remain underwhelming compared to the size of the positive developments. If RSR’s price continues its uptick in the coming days, there is a chance that the CMF will start to reflect stronger positive sentiment.
RSR Price Is Rising
Reserve Rights (RSR) price is currently trading at $0.007543, with a strong support level at $0.007386. Given the 22% rally over the last 24 hours, it is possible that the token will continue to rise if it holds above this support.
A bounce off $0.007386 could see RSR making its way to $0.008196. This would bring the altcoin closer to a profitable range for many investors as well as imbue confidence regarding further rally.

However, should RSR fail to breach the $0.008196 resistance or fall below the support of $0.007386, the altcoin’s price could drop to $0.006601 or even lower towards $0.005900. This would significantly damage the bullish thesis and extend recent losses, potentially leading to a further period of consolidation.
Disclaimer
In line with the Trust Project guidelines, this price analysis article is for informational purposes only and should not be considered financial or investment advice. BeInCrypto is committed to accurate, unbiased reporting, but market conditions are subject to change without notice. Always conduct your own research and consult with a professional before making any financial decisions. Please note that our Terms and Conditions, Privacy Policy, and Disclaimers have been updated.

Analyst Reveals How XRP Price Can Hit $22 If BTC Rallies To This Level

Meme Coin FARTCOIN Hits Two-Month High, Could It Reach $1?

Will Q2 2025 Mark the Return of Altcoin Season?

XRP Price Forms Rounded Bottom Within Descending Channel, Target Set Above $3

RSR Price Climbs 22% After Paul Atkins Gets Named SEC Chair

Is Trump’s Tariff Delay Masking a Crypto Dead Cat Bounce?

2.52 Million Altcoins Are Ruining Crypto’s Future

Animoca Brands Valuation Tanks 75% In Two Years, Here’s Why

Crypto exchange BingX hacked for $43 million

Are The Big Players Losing Interest?

Hong Kong’s Securities Association Tips Authorities On Crypto Self-Regulation

Coinbase cbBTC Set to go Live on Solana
2.52 Million Altcoins Are Ruining Crypto’s Future
Animoca Brands Valuation Tanks 75% In Two Years, Here’s Why
Crypto exchange BingX hacked for $43 million
Are The Big Players Losing Interest?
Hong Kong’s Securities Association Tips Authorities On Crypto Self-Regulation
Coinbase cbBTC Set to go Live on Solana
-
 Bitcoin12 hours ago
MicroStrategy Bitcoin Dump Rumors Circulate After SEC Filing
-

 Market24 hours ago
How Ripple’s $1.25 Billion Deal Could Surge XRP Demand
-
 Market11 hours ago
XRP Primed for a Comeback as Key Technical Signal Hints at Explosive Move
-

 Altcoin15 hours ago
NFT Drama Ends For Shaquille O’Neal With Hefty $11 Million Settlement
-

 Market7 hours ago
Bitcoin Rallies After Trump Pauses Tariff—Crypto Markets Cheer the Move
-

 Market13 hours ago
SEC Approves Ethereum ETF Options Trading After Delays
-

 Bitcoin24 hours ago
Goldman Sachs Raises US Recession Odds to 45%
-
 Regulation11 hours ago
US Senate Confirms Pro-Crypto Paul Atkins As SEC Chair