Market
Render (RNDR) Decline Risk Looms, But There’s a Twist

Render (RNDR) is on course to extend its 30-day-long price decline. In the last month, the altcoin’s value has plunged by almost 25%.
Daily traders continue to profit from offloading their RNDR holdings despite the altcoin’s double-digit price rally.
Render Holders Realize Gains
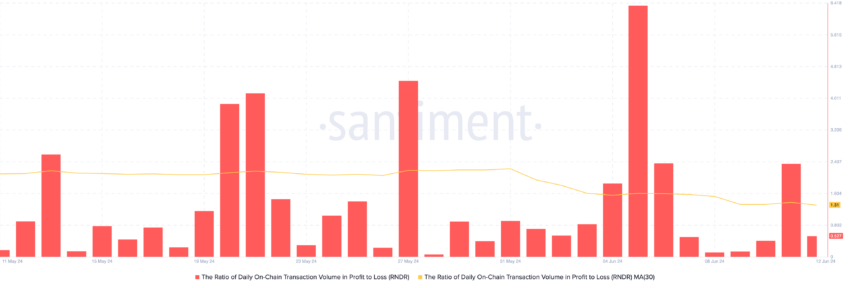
As of this writing, RNDR is trading at $8.46, its lowest price since May 5. Despite the price decline, RNDR continues to return profits to its holders. An assessment of RNDR’s daily ratio of transaction volume in profit to loss (observed using a 30-day moving average) returned a value of 1.31.
This metric compares the volume of profitable RNDR transactions to those that are not. At 1.31, the volume of profitable transactions is 1.31 times that of those that end in loss.
This means that for every 1 unit of transaction volume that ends in a loss, there are 1.31 units of transaction volume that return a profit.

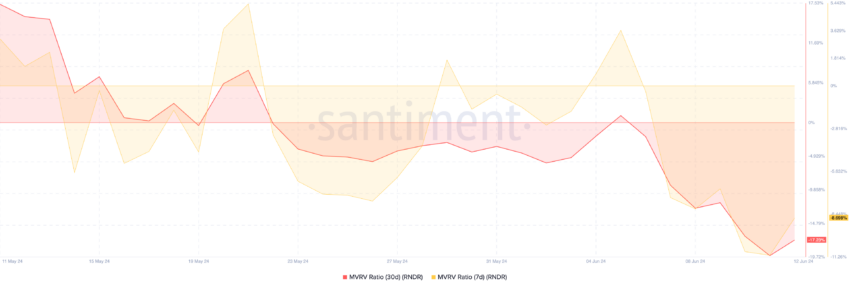
For those looking to trade against the current market trend, RNDR’s price decline offers an opportunity. Readings from the altcoin’s Market Value to Realized Value (MVRV) ratio show that the metric flashes a buy signal.
RNDR’s MVRV ratio, assessed over the 7-day and 30-day moving averages, returned negative values of -8.6% and -17.23%, respectively.
Read More: Render Token (RNDR): A Guide to What It Is and How It Works
This metric tracks the ratio between an asset’s current market price and the average price of every coin or token acquired for that asset.
When it returns a value above one, the asset is considered overvalued and due to a price decline. This is because the asset’s current value is significantly higher than the price at which most investors acquired their holdings. Therefore, they often sell at this point to record profits.
On the other hand, a negative MVRV value shows that the asset in question is undervalued. It suggests that its market value is below the average purchase price of all its tokens in circulation.
It offers a buying opportunity because it suggests that the asset in question currently trades below its historical cost basis.
RNDR Price Prediction: Look Before You Leap
While a buying opportunity might exist, it is trite to note that RNDR bears continue to have significant control.
As of this writing, RNDR’s Moving Average Convergence/Divergence (MACD) showed its MACD line (orange) below its signal line (blue) and trending toward the zero line.
Traders use this indicator to identify an asset’s price trends and reversal points. When its MACD and signal lines are positioned this way, it signals a spike in buying pressure.

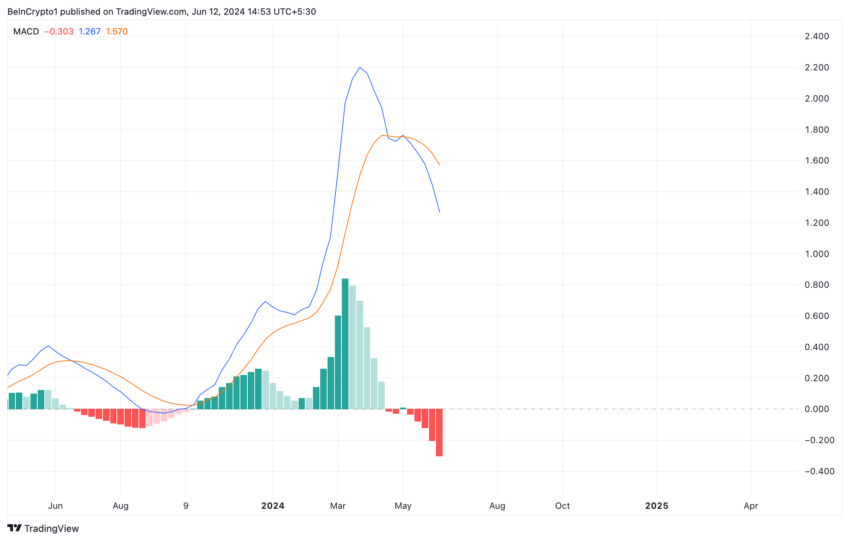
Traders view this bearish crossover as a sign to exit long and take short positions.
If the bearish bias towards RNDR intensifies, its value may decline from the $8 price level to exchange hands at $5.65.
Read More: Render Token (RNDR) Price Prediction 2024/2025/2030
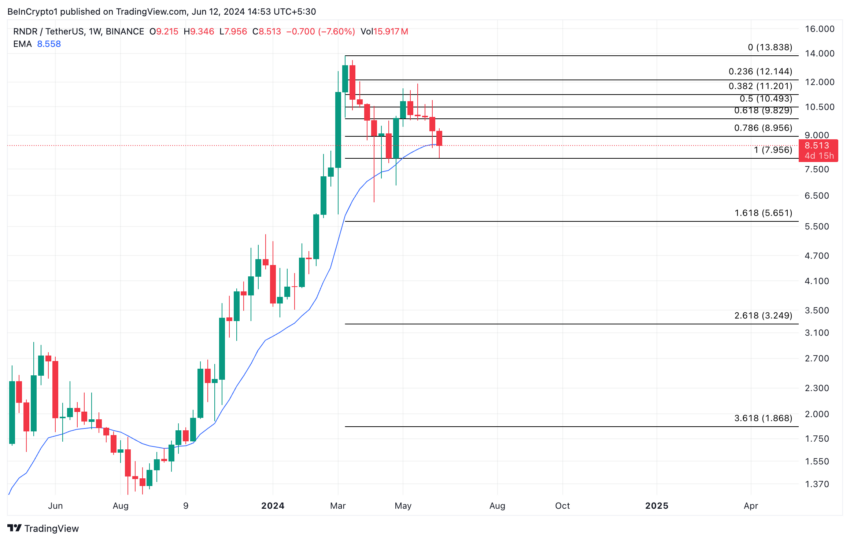
However, if invalidated and buying momentum spikes, the bulls can push RNDR’s value above $8.95.
Disclaimer
In line with the Trust Project guidelines, this price analysis article is for informational purposes only and should not be considered financial or investment advice. BeInCrypto is committed to accurate, unbiased reporting, but market conditions are subject to change without notice. Always conduct your own research and consult with a professional before making any financial decisions. Please note that our Terms and Conditions, Privacy Policy, and Disclaimers have been updated.