
Market
Polkadot (DOT) Bearish Trends Amid Declining Interest

Polkadot (DOT) faces bearish price trends with nearly a 50% decline from the local high of $12.
Analyzing Key Indicators Such as Total Open Interest and Social Dominance.
Technical Analysis of Polkadot
The price of DOT has once again rejected the Ichimoku Cloud and is currently testing the Ichimoku Baseline in red, which aligns with the lower boundary of the Ichimoku Cloud. The trading price stands at $6.45.
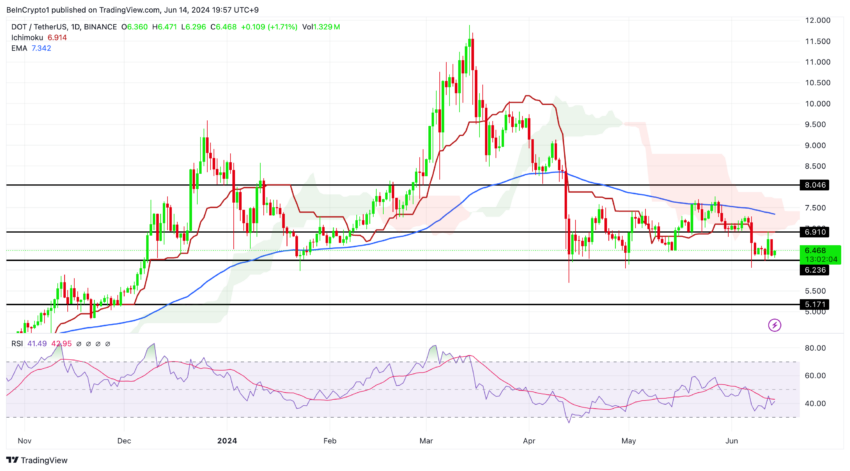
The RSI trend indicates a downward movement, with the 14-day simple moving average (SMA) of the RSI reflecting this bearish momentum. Recently, the RSI has been trending towards the oversold territory, nearing the critical level of 30. This downward trend points to increasing selling pressure and potential further declines in price if the RSI falls below 30.
The 4-hour chart highlights crucial resistance and support zones. The price recently fell below the 4-hour Ichimoku Cloud, indicating a bearish trend in this timeframe. The $6.23 price level has emerged as significant support.
Read More: What Is Polkadot (DOT)?
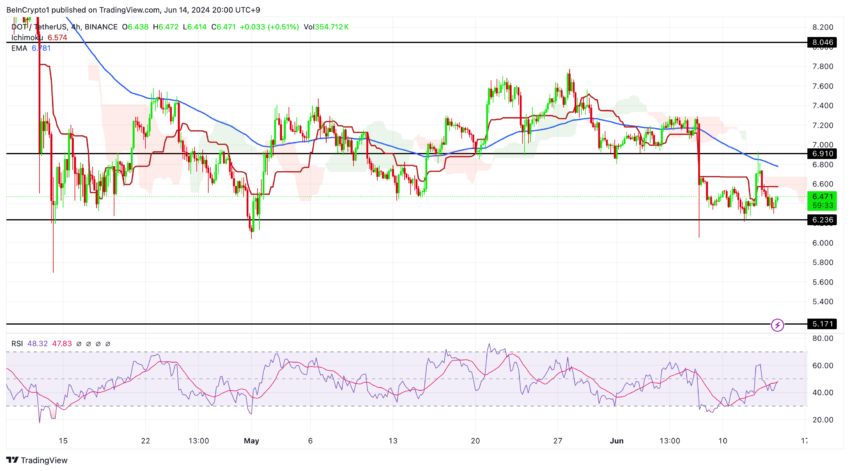
If DOT drops below this support level, it could signal a continuation of the bearish trend. Conversely, if the price climbs above the Ichimoku Cloud and the red baseline of the 4-hour Ichimoku Cloud, it could suggest a trend reversal and a potential shift to a bullish outlook.
DOT Total Open Interest: Understanding the Bearish Trends
From June 1 to June 13, the total open interest in USD for DOT across all exchanges showed a notable decline. Open interest was relatively higher on June 1 but began a downward trend, indicating reduced trading activity and interest.
By June 13, open interest had decreased significantly, suggesting potential market uncertainty or a reduction in speculative positions. This trend aligns with the broader price action observed during the same period, indicating a bearish sentiment among traders.
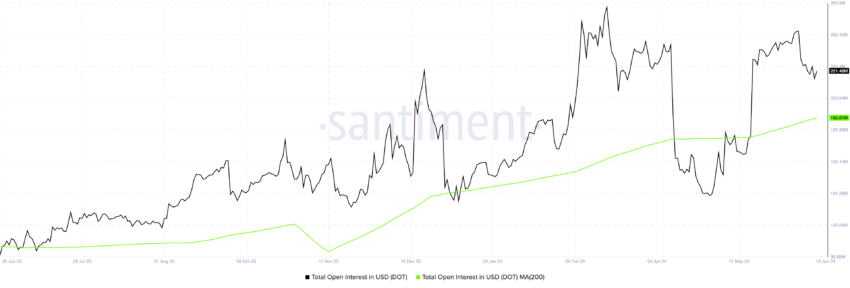
The correlation between Polkadot’s price and total open interest in USD from May 14 to June 14, 2024, is approximately 0.44. This positive correlation suggests a relationship between these two variables. Indicating that as open interest increases, Polkadot’s price tends to rise as well.
This relationship highlights that growing market participation and investment interest in Polkadot often accompanies an upward movement in its price. However, the correlation is not strong, implying that other factors significantly influence Polkadot’s price movements.
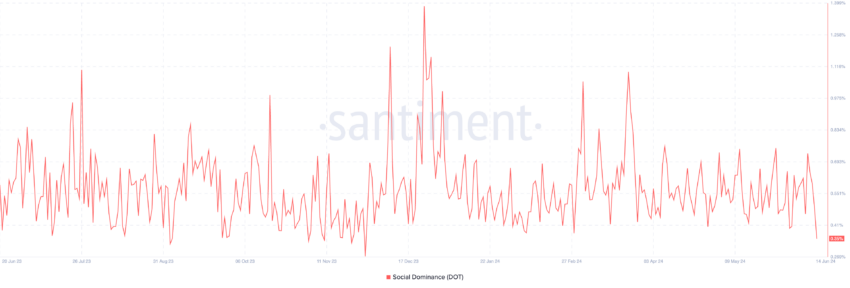
Social dominance peaked at 0.7537 on May 27, a 64.56% increase from 0.4579 on May 14. This rise indicates heightened community interest and engagement. Social interest sharply declined by 53.92% to 0.3474 by June 13.
This aligns with the price drop and suggests waning social media activity or interest in DOT.
Read More: 5 Best Polkadot (DOT) Wallets To Consider In 2024
Polkadot is approaching a critical support level at $6.23. If the price breaks below this level, it could signal a continuation of the bearish trend. Conversely, if the price reverts and moves above the 4-hour Ichimoku Cloud, it might indicate a potential shift in outlook.
The social dominance clearly highlights the current bearish trend that Polkadot is facing, reflecting a noticeable decline in interest from social media users regarding cryptocurrency.
Technical analysis highlights that a confirmed bullish trend will require the price to enter the daily Ichimoku Cloud and break above the daily Ichimoku Baseline.
Disclaimer
In line with the Trust Project guidelines, this price analysis article is for informational purposes only and should not be considered financial or investment advice. BeInCrypto is committed to accurate, unbiased reporting, but market conditions are subject to change without notice. Always conduct your own research and consult with a professional before making any financial decisions. Please note that our Terms and Conditions, Privacy Policy, and Disclaimers have been updated.


XRP has been on a consistent downtrend in recent days, with its price falling sharply and approaching the $2 mark. This has resulted in extended losses for the cryptocurrency, with a notable rise in selling pressure.
Despite the bearish momentum, key investors are trying to offset the negative impact.
XRP Whales Are Uncertain
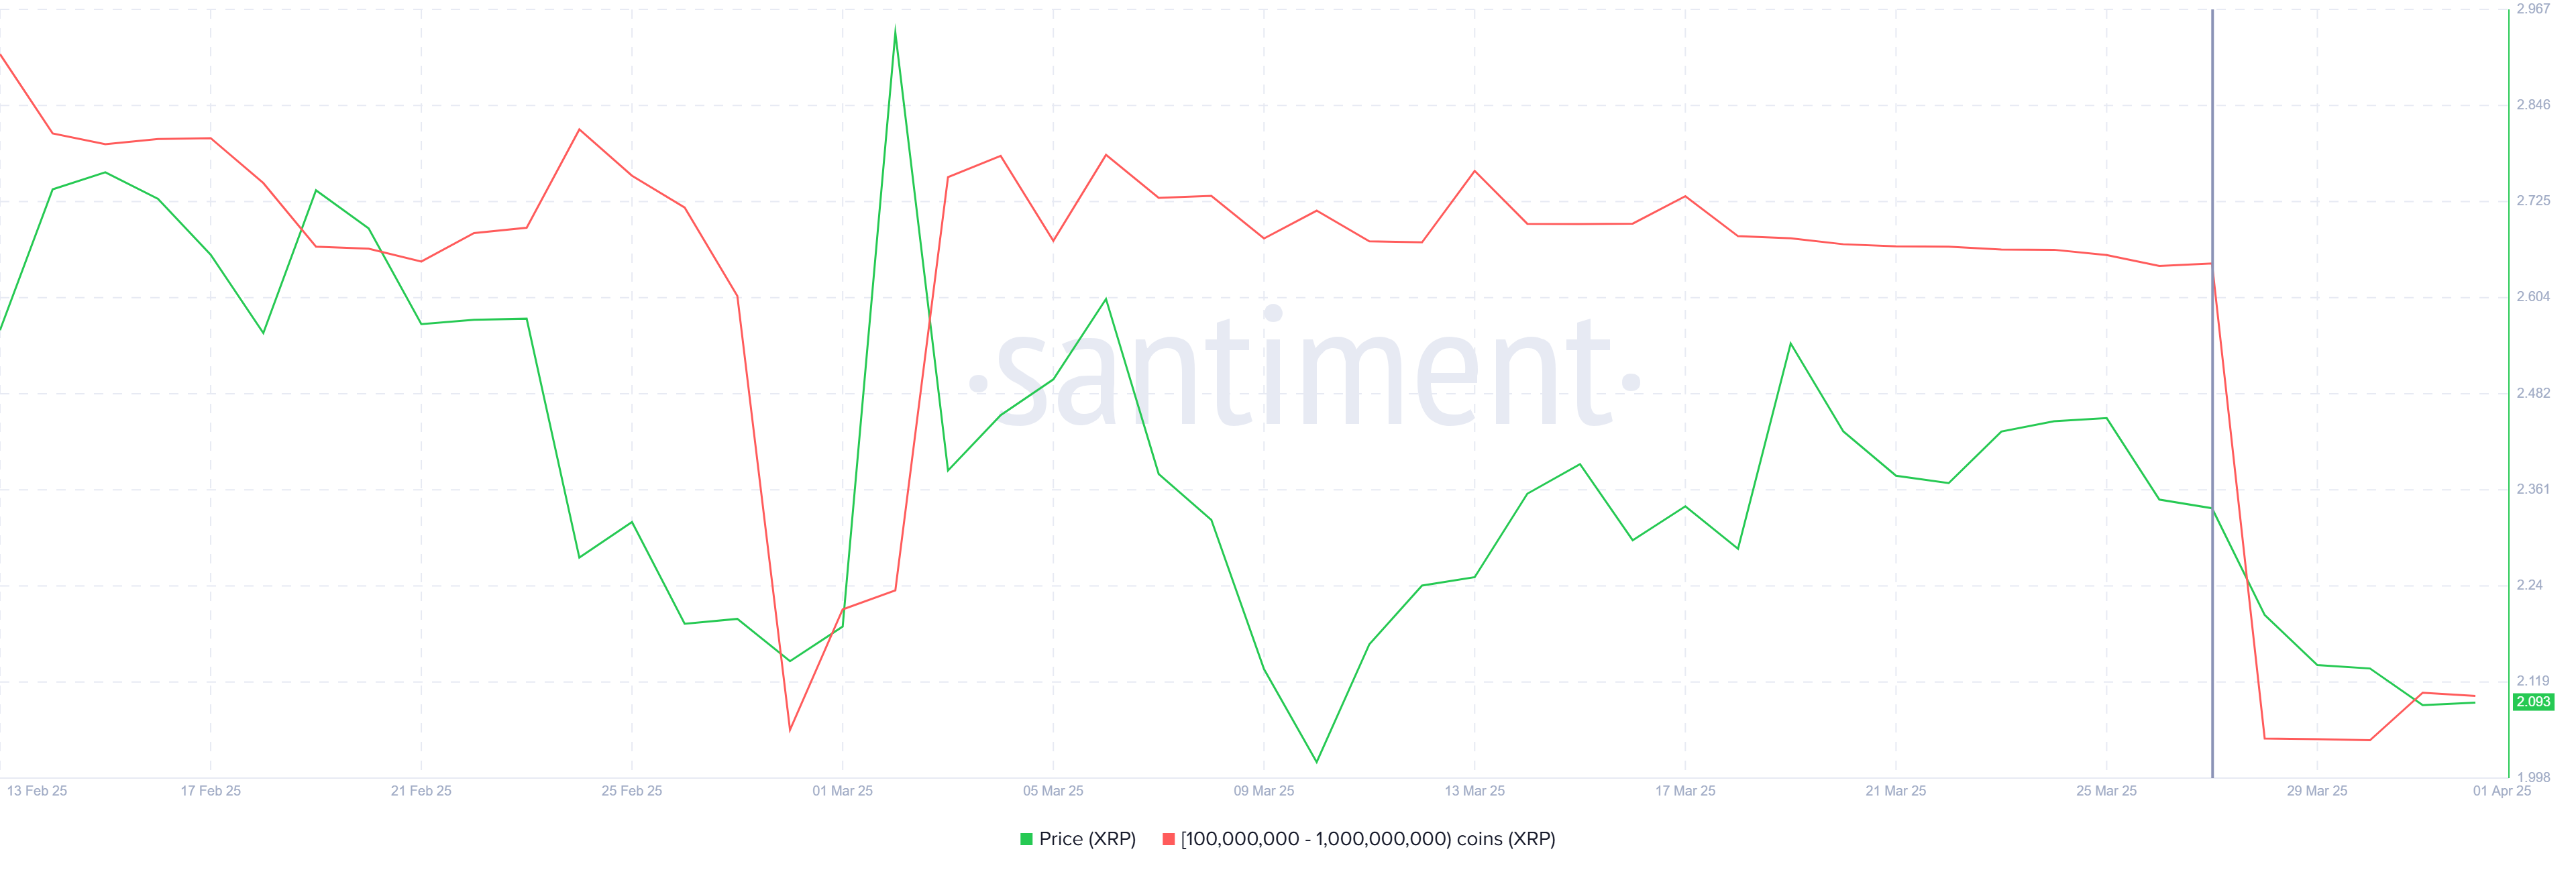
Whale activity has been a major factor contributing to the recent decline in XRP’s price. Addresses holding between 100 million and 1 billion XRP have sold over 1.12 billion XRP, worth $2.34 billion, in the past seven days. This has brought their total holdings down to 8.98 billion XRP.
The selling activity from these whale addresses reflects a cautious outlook for XRP. While whale selling often indicates uncertainty in the market, it’s important to note that their behavior can also have significant short-term price movements. The recent heavy selling could signal that market participants are unsure about the short-term price action, and further bearish trends could follow if this continues.
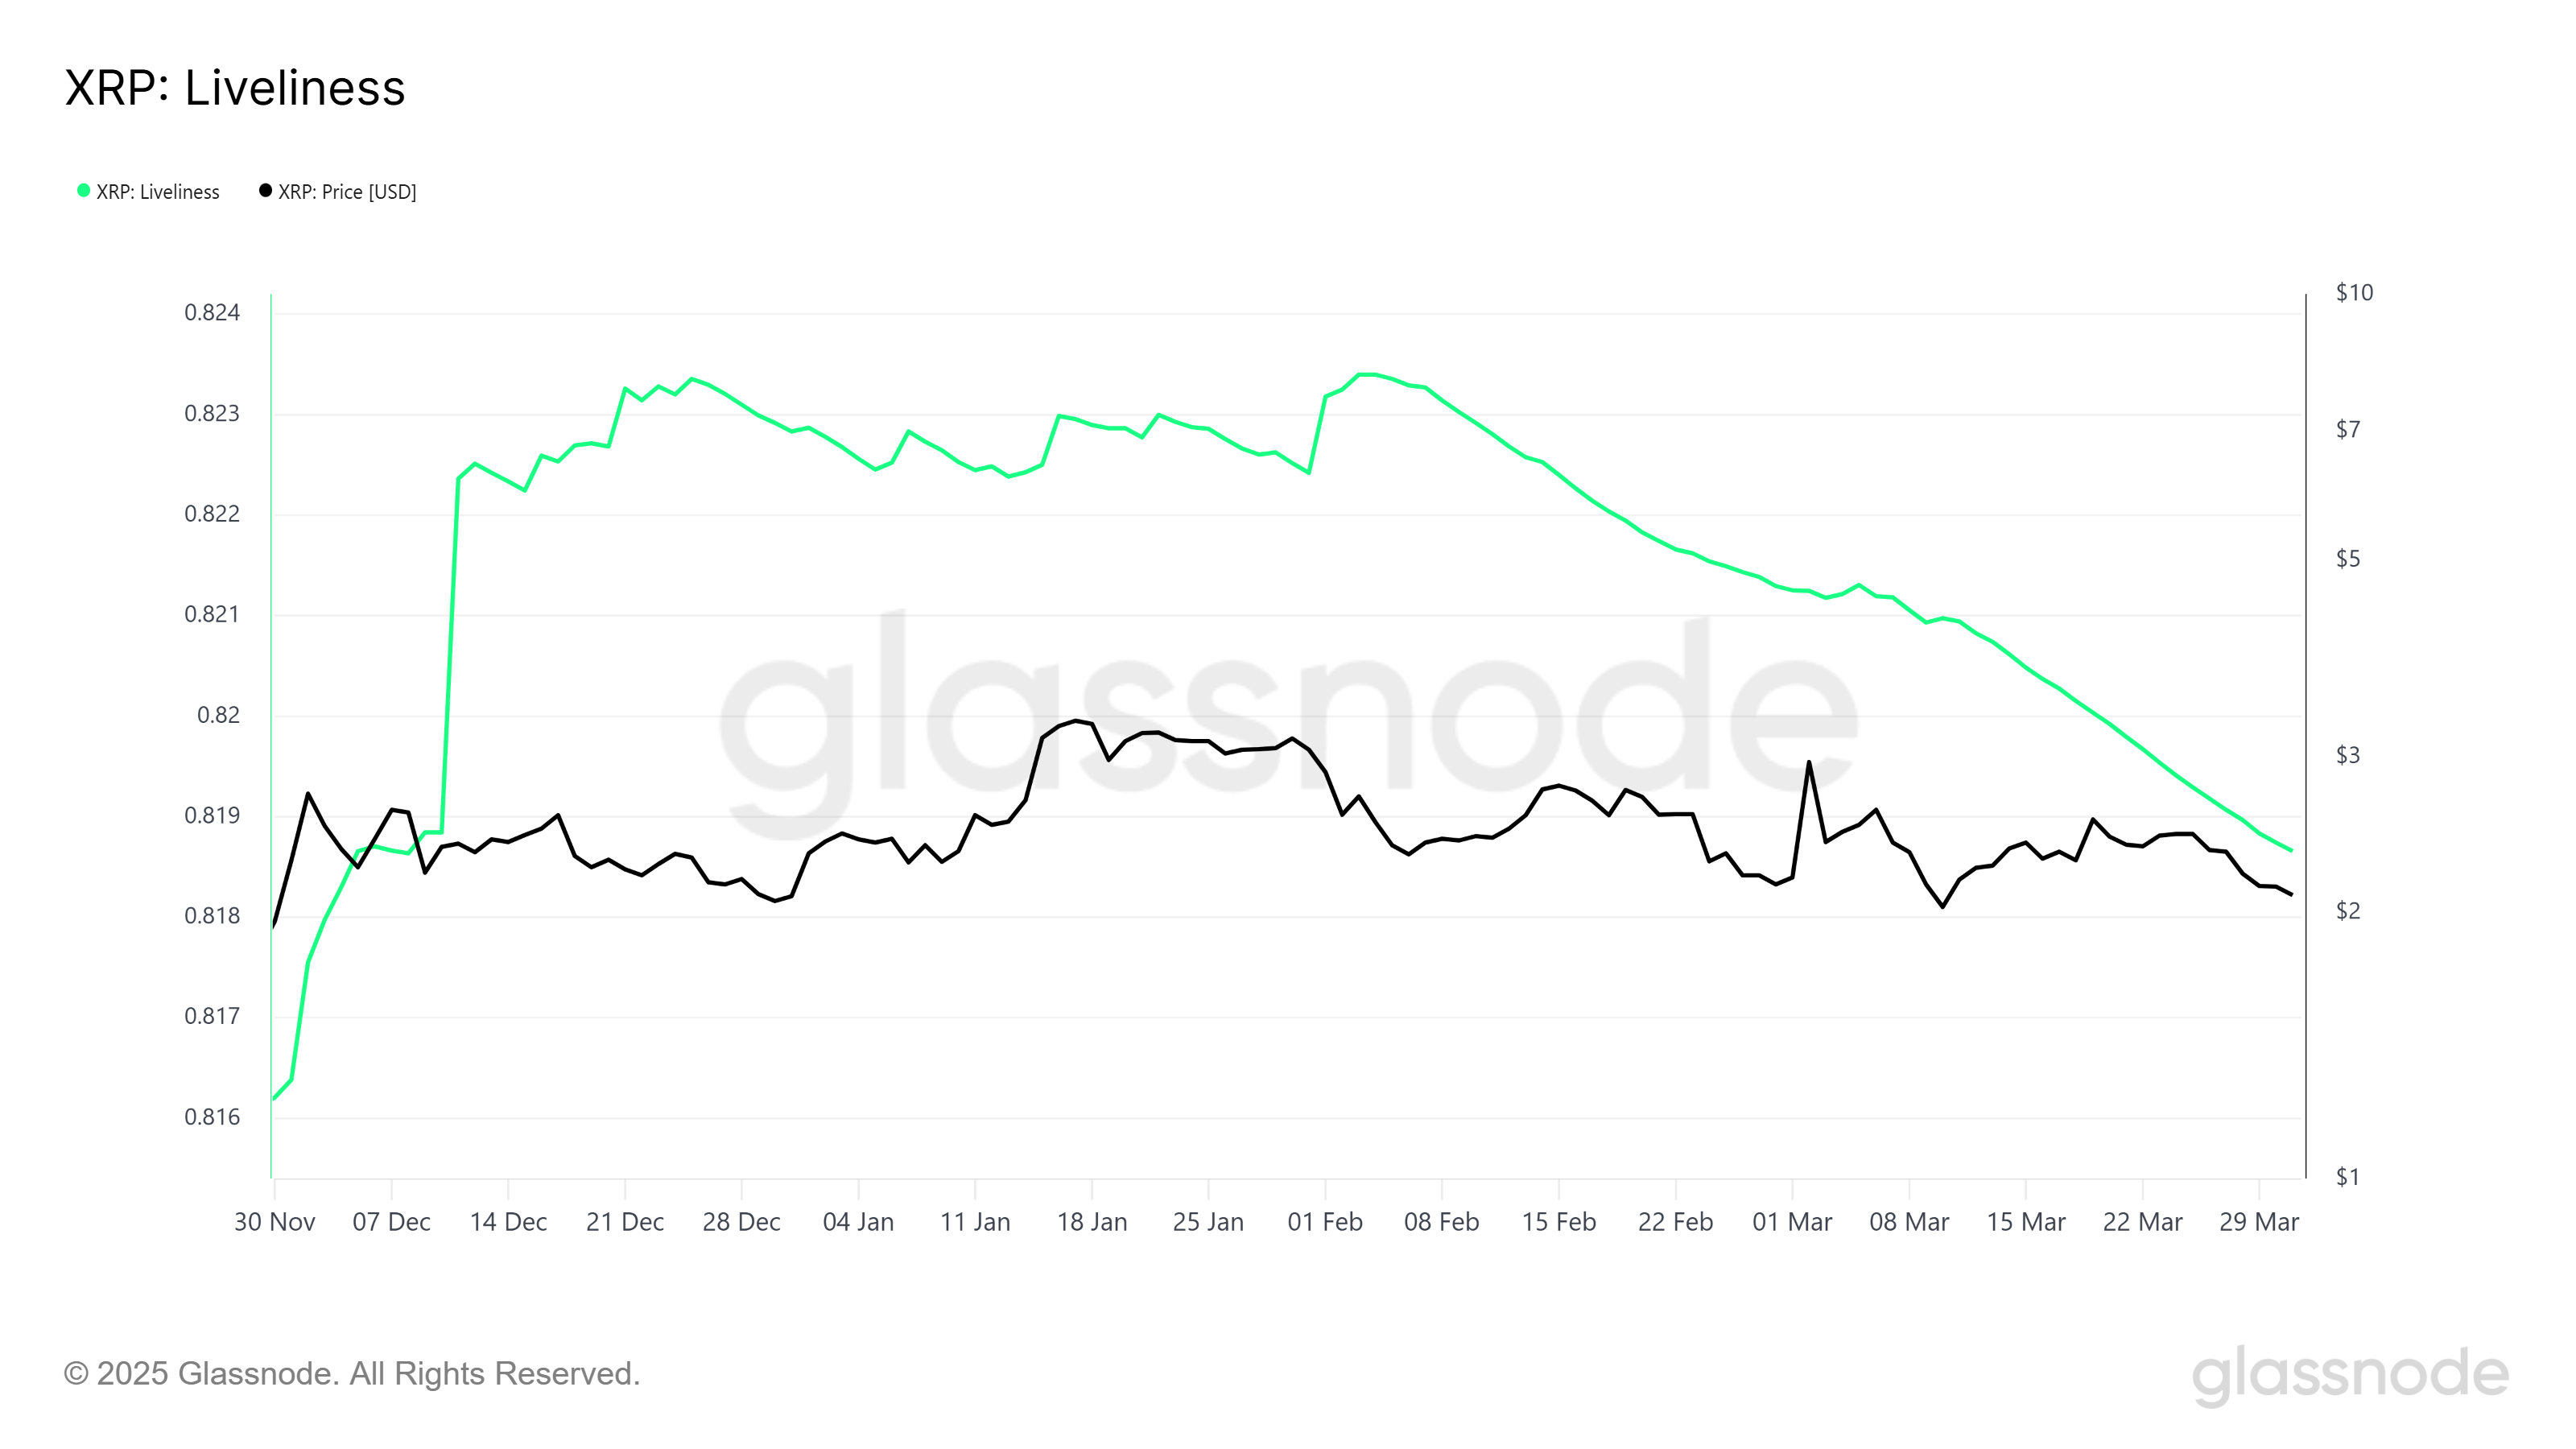
On the broader market level, XRP’s macro momentum shows signs of divergence from the whale selling. The Liveliness metric, which tracks the behavior of long-term holders (LTHs), is currently declining.
A falling Liveliness typically signals that LTHs are accumulating more of the asset at lower prices rather than selling. This drop to a three-month low suggests that long-term holders are sticking to their conviction and accumulating XRP, even as whale selling intensifies.
The steady accumulation of LTHs might help cushion the bearish effects created by the whales. This behavior can counteract the selling pressure, potentially offering stability to XRP’s price and supporting a recovery if market conditions improve.
XRP Price Needs To Find Direction
XRP’s price has fallen by 14.5% this week, bringing it to $2.09, which is dangerously close to losing the critical $2.02 support level. The ongoing bearish momentum has created mixed signals in the market, which are likely to keep the price stuck in a narrow range for the time being.
If XRP can bounce back from the $2.02 support, it could recover some of the recent losses. However, the altcoin may remain consolidated below the $2.27 resistance level unless more positive news or market conditions arise to push it higher.
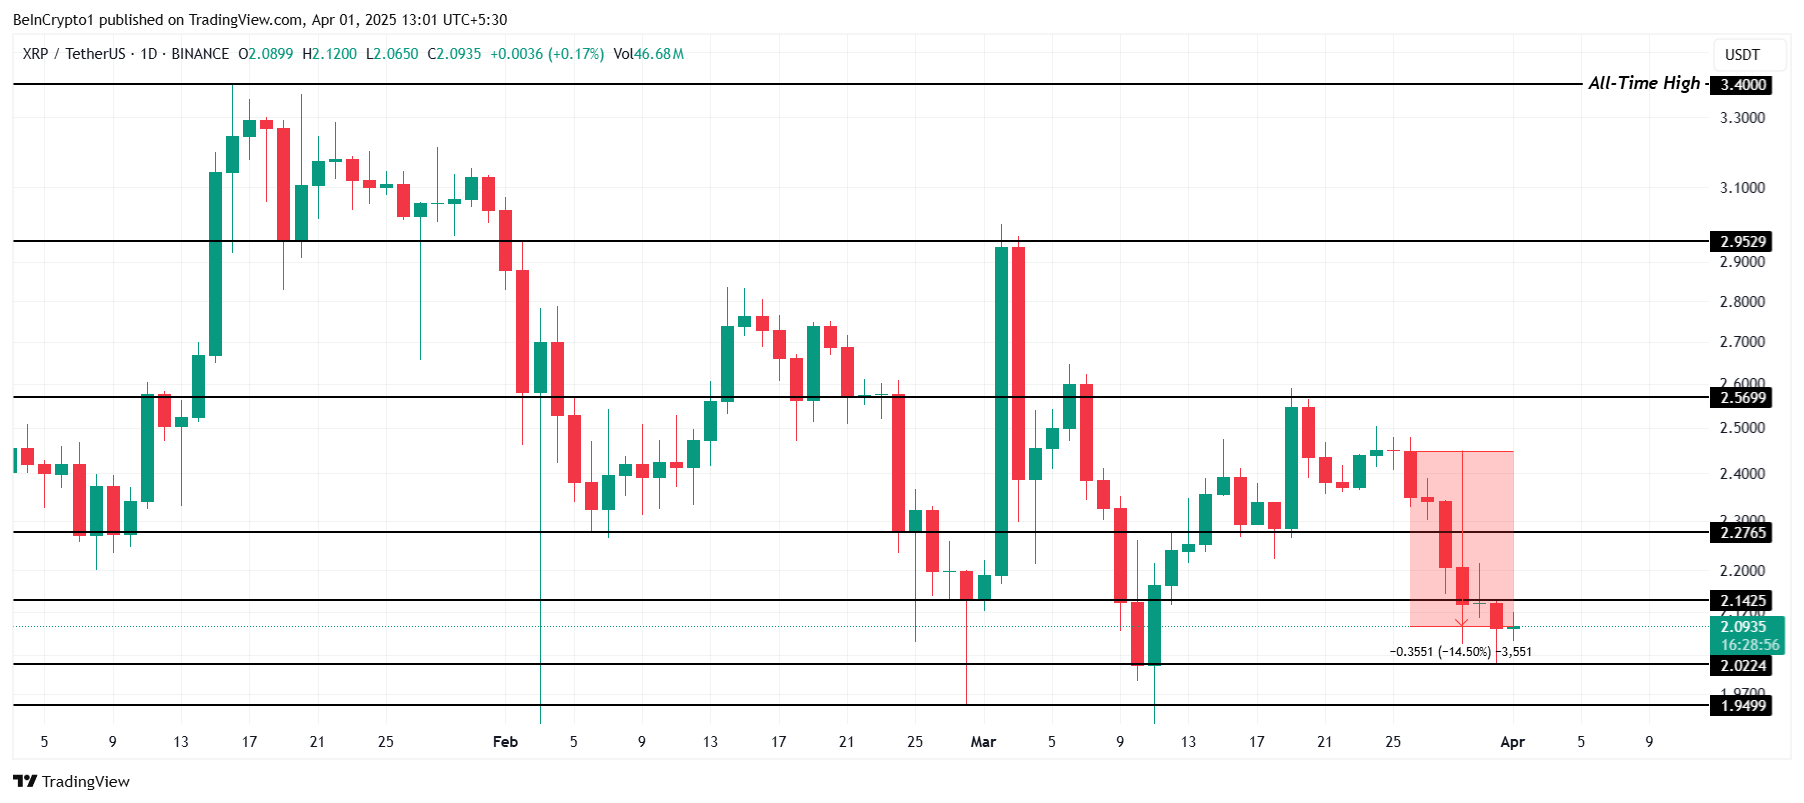
If XRP breaks through the $2.27 barrier or falls below $2.02, it could invalidate the current consolidation outlook. A successful breach of $2.27 could pave the way for a price recovery, with $2.56 being the next significant target.
Disclaimer
In line with the Trust Project guidelines, this price analysis article is for informational purposes only and should not be considered financial or investment advice. BeInCrypto is committed to accurate, unbiased reporting, but market conditions are subject to change without notice. Always conduct your own research and consult with a professional before making any financial decisions. Please note that our Terms and Conditions, Privacy Policy, and Disclaimers have been updated.

Reason to trust
![]()
Strict editorial policy that focuses on accuracy, relevance, and impartiality
Created by industry experts and meticulously reviewed
The highest standards in reporting and publishing
Strict editorial policy that focuses on accuracy, relevance, and impartiality
Morbi pretium leo et nisl aliquam mollis. Quisque arcu lorem, ultricies quis pellentesque nec, ullamcorper eu odio.
Bitcoin price started another decline below the $83,500 zone. BTC is now consolidating and might struggle to recover above the $83,850 zone.
- Bitcoin started a fresh decline below the $83,200 support zone.
- The price is trading below $83,000 and the 100 hourly Simple moving average.
- There is a connecting bullish trend line forming with support at $82,550 on the hourly chart of the BTC/USD pair (data feed from Kraken).
- The pair could start another decline if it stays below the $83,850 resistance zone.
Bitcoin Price Faces Resistance
Bitcoin price failed to start a recovery wave and remained below the $85,500 level. BTC started another decline and traded below the support area at $83,500. The bears gained strength for a move below the $82,500 support zone.
The price even declined below the $82,000 level. A low was formed at $81,320 before there was a recovery wave. There was a move above the $82,500 level, but the bears were active near $83,850. The price is now consolidating and there was a drop below the 50% Fib retracement level of the upward move from the $81,320 swing low to the $83,870 high.
Bitcoin price is now trading below $83,250 and the 100 hourly Simple moving average. There is also a connecting bullish trend line forming with support at $82,550 on the hourly chart of the BTC/USD pair. On the upside, immediate resistance is near the $83,250 level. The first key resistance is near the $83,850 level.

The next key resistance could be $84,200. A close above the $84,200 resistance might send the price further higher. In the stated case, the price could rise and test the $84,800 resistance level. Any more gains might send the price toward the $85,000 level or even $85,500.
Another Decline In BTC?
If Bitcoin fails to rise above the $83,850 resistance zone, it could start a fresh decline. Immediate support on the downside is near the $82,550 level. The first major support is near the $82,250 level and the 61.8% Fib retracement level of the upward move from the $81,320 swing low to the $83,870 high.
The next support is now near the $81,250 zone. Any more losses might send the price toward the $80,000 support in the near term. The main support sits at $78,500.
Technical indicators:
Hourly MACD – The MACD is now losing pace in the bearish zone.
Hourly RSI (Relative Strength Index) – The RSI for BTC/USD is now below the 50 level.
Major Support Levels – $82,250, followed by $81,250.
Major Resistance Levels – $83,250 and $83,850.


On April 1, Binance co-founder Changpeng Zhao (CZ) shared an amusing hypothetical on social media platform X (Twitter).
He posed the hypothetical scenario of a user generating a cryptocurrency wallet address commonly used for token burns, which permanently remove tokens from circulation.
Binance’s CZ Shares Cryptic Hypothetical on April Fools Day
Changpeng Zhao’s April Fools’ joke about generating a token burn address sparked discussions. However, the chances of it happening are astronomically low. CZ shared the post during the early hours of the Asian session, kickstarting an interesting discourse.
“Imagine downloading Trust Wallet and finding your newly generated address is: 0x000000000000000000000000000000000000dead. Theoretically speaking, it has the same chance as any other address. Alright, enough imagining. Not gonna happen. Get back to building. Happy Apr 1!” Changpeng Zhao wrote.
It comes in time for April Fools’ Day, celebrated annually on April 1, dedicated to practical jokes, hoaxes, and playful deception. Trust Wallet, integrated as Binance’s non-custodial wallet provider, played along with the joke.
“Happy April Fool’s Day,” wrote Trust Wallet.
While the idea seems far-fetched, CZ was not technically wrong. Theoretically, there is an infinitesimally small probability that someone could randomly generate a wallet address matching “0x000…dead” using software like Trust Wallet.
However, the chances are comparable to winning the lottery multiple times. To put things into perspective, one can generate blockchain addresses using cryptographic hashing functions that produce 160-bit outputs.
This means there are 2¹⁶⁰ possible Ethereum addresses—a number so vast that generating any specific address, such as “0x000…dead,” is practically impossible.
“Haha, imagine the odds! That is a 1 in 2^160 type of vibe. Good one, CZ—back to work now, no distractions from the code,” Synergy Media wrote, putting the rarity into context.
While CZ’s April Fool’s joke entertained the crypto community, the reality remains unchanged. The likelihood of generating a wallet address identical to “0x000…dead” is close to zero. This means the post was a fun thought experiment but nothing more.
“Imagine that you can randomly generate a Bitcoin private key every second, and suddenly one day the private key you generated happens to correspond to Satoshi Nakamoto’s wallet or Binance’s wallet. That’s terrifying,” another user quipped.
However, the joke does highlight the fascinating cryptographic underpinnings of blockchain technology. While every address is technically possible, some are rare and might as well be myths. Crypto users will have to keep burning their tokens the old-fashioned way.
Disclaimer
In adherence to the Trust Project guidelines, BeInCrypto is committed to unbiased, transparent reporting. This news article aims to provide accurate, timely information. However, readers are advised to verify facts independently and consult with a professional before making any decisions based on this content. Please note that our Terms and Conditions, Privacy Policy, and Disclaimers have been updated.

XRP Price Struggles as Whale Selling Rises To $2.3 Billion

Bitcoin Price Battles Key Hurdles—Is a Breakout Still Possible?
Is CZ’s April Fool’s Joke a Crypto Reality or Just Fun?

XRP Bulls Fight Back—Is a Major Move Coming?

A Make or Break Situation As Ripple Crypto Flirts Around $2

CFTC’s Crypto Market Overhaul Under New Chair Brian Quintenz

2.52 Million Altcoins Are Ruining Crypto’s Future

Animoca Brands Valuation Tanks 75% In Two Years, Here’s Why

Crypto exchange BingX hacked for $43 million

Are The Big Players Losing Interest?

Hong Kong’s Securities Association Tips Authorities On Crypto Self-Regulation

Coinbase cbBTC Set to go Live on Solana
2.52 Million Altcoins Are Ruining Crypto’s Future
Animoca Brands Valuation Tanks 75% In Two Years, Here’s Why
Crypto exchange BingX hacked for $43 million
Are The Big Players Losing Interest?
Hong Kong’s Securities Association Tips Authorities On Crypto Self-Regulation
Coinbase cbBTC Set to go Live on Solana
-

 Ethereum16 hours ago
Ethereum’s Price Dips, But Investors Seize The Opportunity To Stack Up More ETH
-

 Market20 hours ago
Bitcoin Mining Faces Tariff Challenges as Hashrate Hits New ATH
-
 Regulation19 hours ago
USDC Issuer Circle Set To File IPO In April, Here’s All
-
 Bitcoin18 hours ago
Strategy Adds 22,048 BTC for Nearly $2 Billion
-
 Market23 hours ago
Strategic Move for Trump Family in Crypto
-

 Market18 hours ago
BNB Breaks Below $605 As Bullish Momentum Fades – What’s Next?
-

 Market22 hours ago
Top Crypto Airdrops to Watch in the First Week of April
-
 Market17 hours ago
Trump Family Gets Most WLFI Revenue, Causing Corruption Fears