
Market
PEPE Whale Holdings Surge to All-Time High

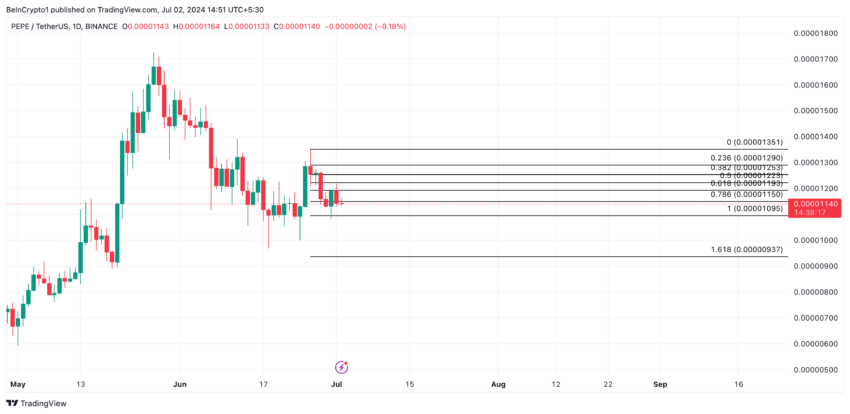
The general decline in meme market activity has impacted Pepe’s (PEPE) price. Exchanging hands at $0.000011 at press time, the leading meme coin has witnessed a 22% value decline in the last month.
However, PEPE whales have seen this price dip as a buying opportunity and have spent the past few weeks “filling their bags.”
Pepe Whales Ape in
An assessment of Pepe (PEPE) whale activity revealed a spike in accumulation by investors that hold between 100,000 and 10,000,000 tokens. As of this writing, this cohort of PEPE investors holds 71,439 PEPE tokens.
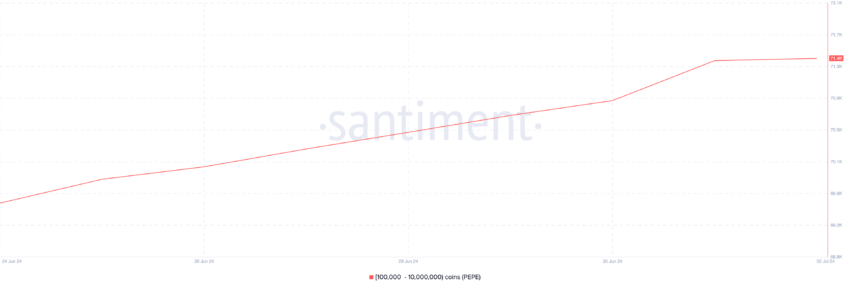
This group of PEPE investors has increased their holdings by 3% in the last week. This comes amid a general uptick in the demand for the meme coin in the last seven days.
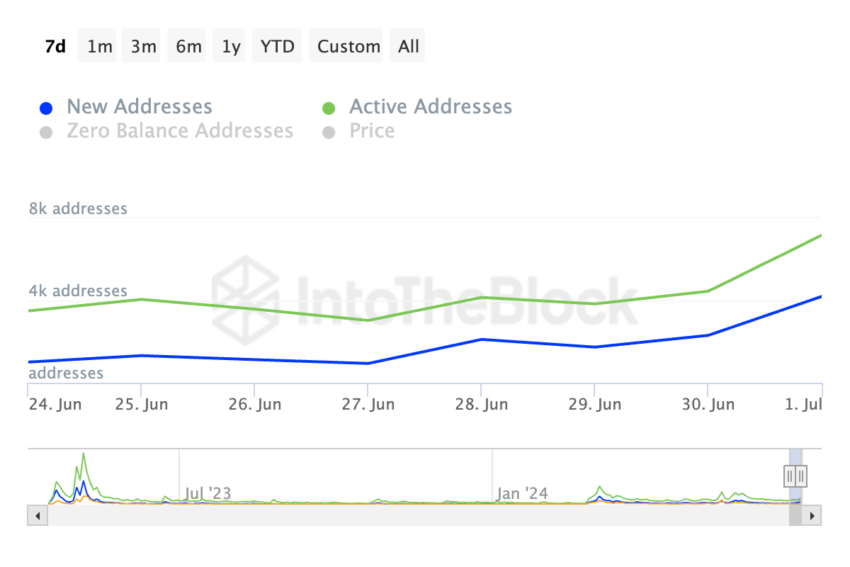
On-chain data show that PEPE’s daily active addresses have increased by 105% during that period. Likewise, the count of new addresses created daily to trade the meme coin has also risen by over 300%.
Read More: Pepe: A Comprehensive Guide to What It Is and How It Works
When an asset experiences a spike in whale accumulation and general network demand during a period of price decline, traders and investors see the lower price as a buying opportunity.
PEPE Price Prediction: Bearish Bias Remains Significant
Despite the increased attention from its whales in the past few weeks, the bearish sentiment that trails PEPE remains significant. According to its Directional Movement Index (DMI), PEPE’s positive directional index (blue) currently lies below its negative index (red).
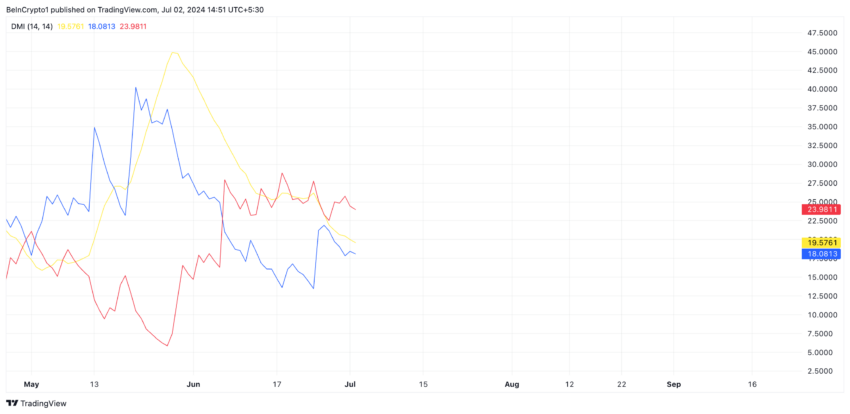
An asset’s DMI determines the direction of its market trend. When set up this way, it signals that the price downtrend is stronger than any upward price movement. It is indicative of a continuation of a bearish trend.
If PEPE’s month-long decline continues, its price might fall to $0.000010.
Read More: Pepe (PEPE) Price Prediction 2024/2025/2030
However, if this trend reverses and an uptrend ensues, the meme coin’s value may climb to $0.000012.
Disclaimer
In line with the Trust Project guidelines, this price analysis article is for informational purposes only and should not be considered financial or investment advice. BeInCrypto is committed to accurate, unbiased reporting, but market conditions are subject to change without notice. Always conduct your own research and consult with a professional before making any financial decisions. Please note that our Terms and Conditions, Privacy Policy, and Disclaimers have been updated.


Reason to trust
![]()
Strict editorial policy that focuses on accuracy, relevance, and impartiality
Created by industry experts and meticulously reviewed
The highest standards in reporting and publishing
Strict editorial policy that focuses on accuracy, relevance, and impartiality
Morbi pretium leo et nisl aliquam mollis. Quisque arcu lorem, ultricies quis pellentesque nec, ullamcorper eu odio.
Ethereum price failed to recover above $1,700 and dropped below $1,550. ETH is now correcting losses and might face resistance near the $1,620 zone.
- Ethereum failed to stay above the $1,620 and $1,550 levels.
- The price is trading below $1,620 and the 100-hourly Simple Moving Average.
- There is a connecting bearish trend line forming with resistance at $1,615 on the hourly chart of ETH/USD (data feed via Kraken).
- The pair remains at risk of more losses if it fails to clear the $1,620 resistance zone.
Ethereum Price Recovery Faces Resistance
Ethereum price failed to stay above the $1,700 support zone and extended losses, like Bitcoin. ETH declined heavily below the $1,650 and $1,620 levels.
The bears even pushed the price below the $1,550 level. A low was formed at $1,410 and the price recently corrected some losses. There was a move above the $1,550 level. The price climbed above the 23.6% Fib retracement level of the downward move from the $1,815 swing high to the $1,410 low.
However, the bears are active near the $1,620 zone. Ethereum price is now trading below $1,620 and the 100-hourly Simple Moving Average. On the upside, the price seems to be facing hurdles near the $1,615 level.
There is also a connecting bearish trend line forming with resistance at $1,615 on the hourly chart of ETH/USD. It is close to the 50% Fib retracement level of the downward move from the $1,815 swing high to the $1,410 low. The next key resistance is near the $1,660 level.

The first major resistance is near the $1,720 level. A clear move above the $1,720 resistance might send the price toward the $1,820 resistance. An upside break above the $1,820 resistance might call for more gains in the coming sessions. In the stated case, Ether could rise toward the $1,880 resistance zone or even $1,920 in the near term.
Another Decline In ETH?
If Ethereum fails to clear the $1,620 resistance, it could start another decline. Initial support on the downside is near the $1,540 level. The first major support sits near the $1,505 zone.
A clear move below the $1,505 support might push the price toward the $1,420 support. Any more losses might send the price toward the $1,380 support level in the near term. The next key support sits at $1,320.
Technical Indicators
Hourly MACD – The MACD for ETH/USD is losing momentum in the bullish zone.
Hourly RSI – The RSI for ETH/USD is now above the 50 zone.
Major Support Level – $1,540
Major Resistance Level – $1,620

Hedera (HBAR) price rebounded over 10% in the last 24 hours, as some technical indicators are beginning to flash early signs of a potential recovery. The BBTrend has flipped positive after a full week in the red, hinting at a possible momentum shift. However, the Ichimoku Cloud still shows a firmly bearish setup, and EMA lines continue to favor downside risk. Whether HBAR can reclaim lost ground or continue sliding toward multi-month lows will depend on how these conflicting signals resolve in the coming days.
Hedera BBTrend Is Positive After Seven Days
Hedera’s BBTrend indicator has turned positive, currently sitting at 3.96 after spending the past seven days in negative territory and hitting a low of -17.12 on April 1.
The BBTrend (Bollinger Band Trend) is a momentum-based indicator used to assess the strength and direction of a trend relative to its position within the Bollinger Bands.
Readings above 0 suggest bullish momentum and potential upside movement, while readings below 0 indicate bearish pressure and downward momentum.
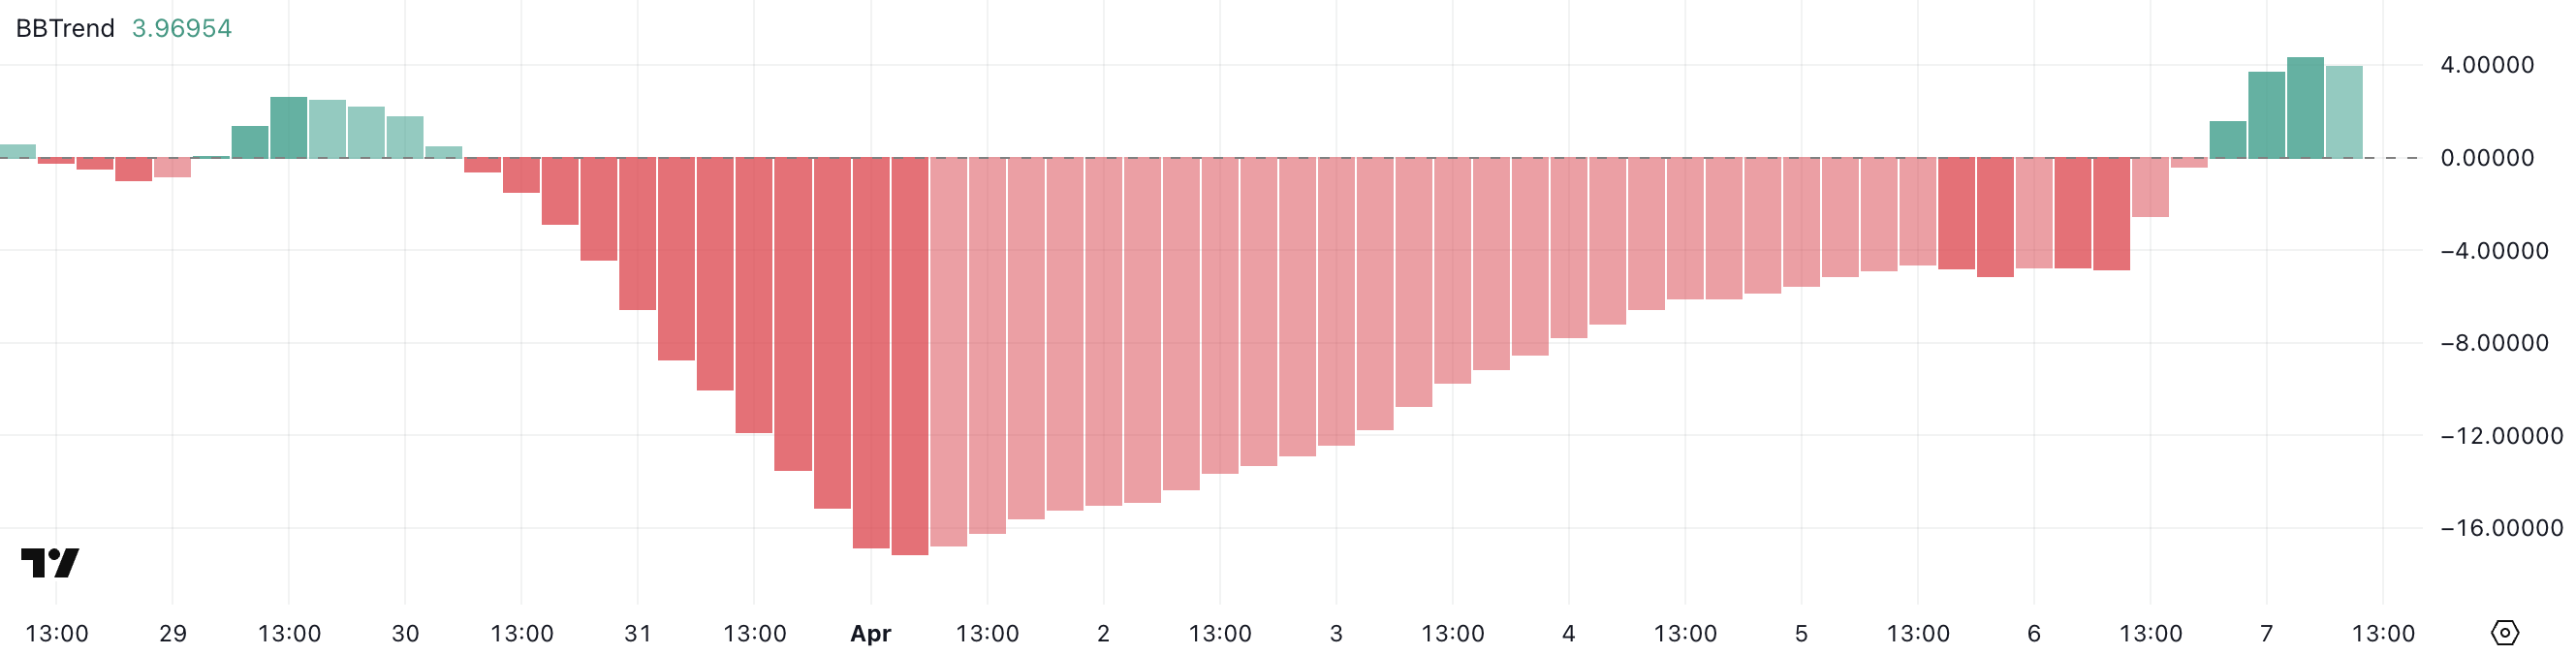
The current BBTrend value of 3.96 suggests that Hedera is showing early signs of a potential bullish reversal following a prolonged downtrend. The shift into positive territory could mean that buying pressure is returning and, if sustained, may support a price recovery.
However, given the recent volatility and overall weakness in the broader market, HBAR will need consistent follow-through above its mid-range levels to confirm this upward shift.
A failure to maintain a positive BBTrend could result in the continuation of sideways or downward movement.
HBAR Ichimoku Cloud Paints A Bearish Picture
The Ichimoku Cloud chart for Hedera currently displays a bearish structure. The price is positioned well below the Kumo (cloud), indicating that downward momentum remains dominant.
The Tenkan-sen (blue line) and Kijun-sen (red line) are both sloping downward and acting as immediate resistance levels, suggesting that sellers still have control over the trend.
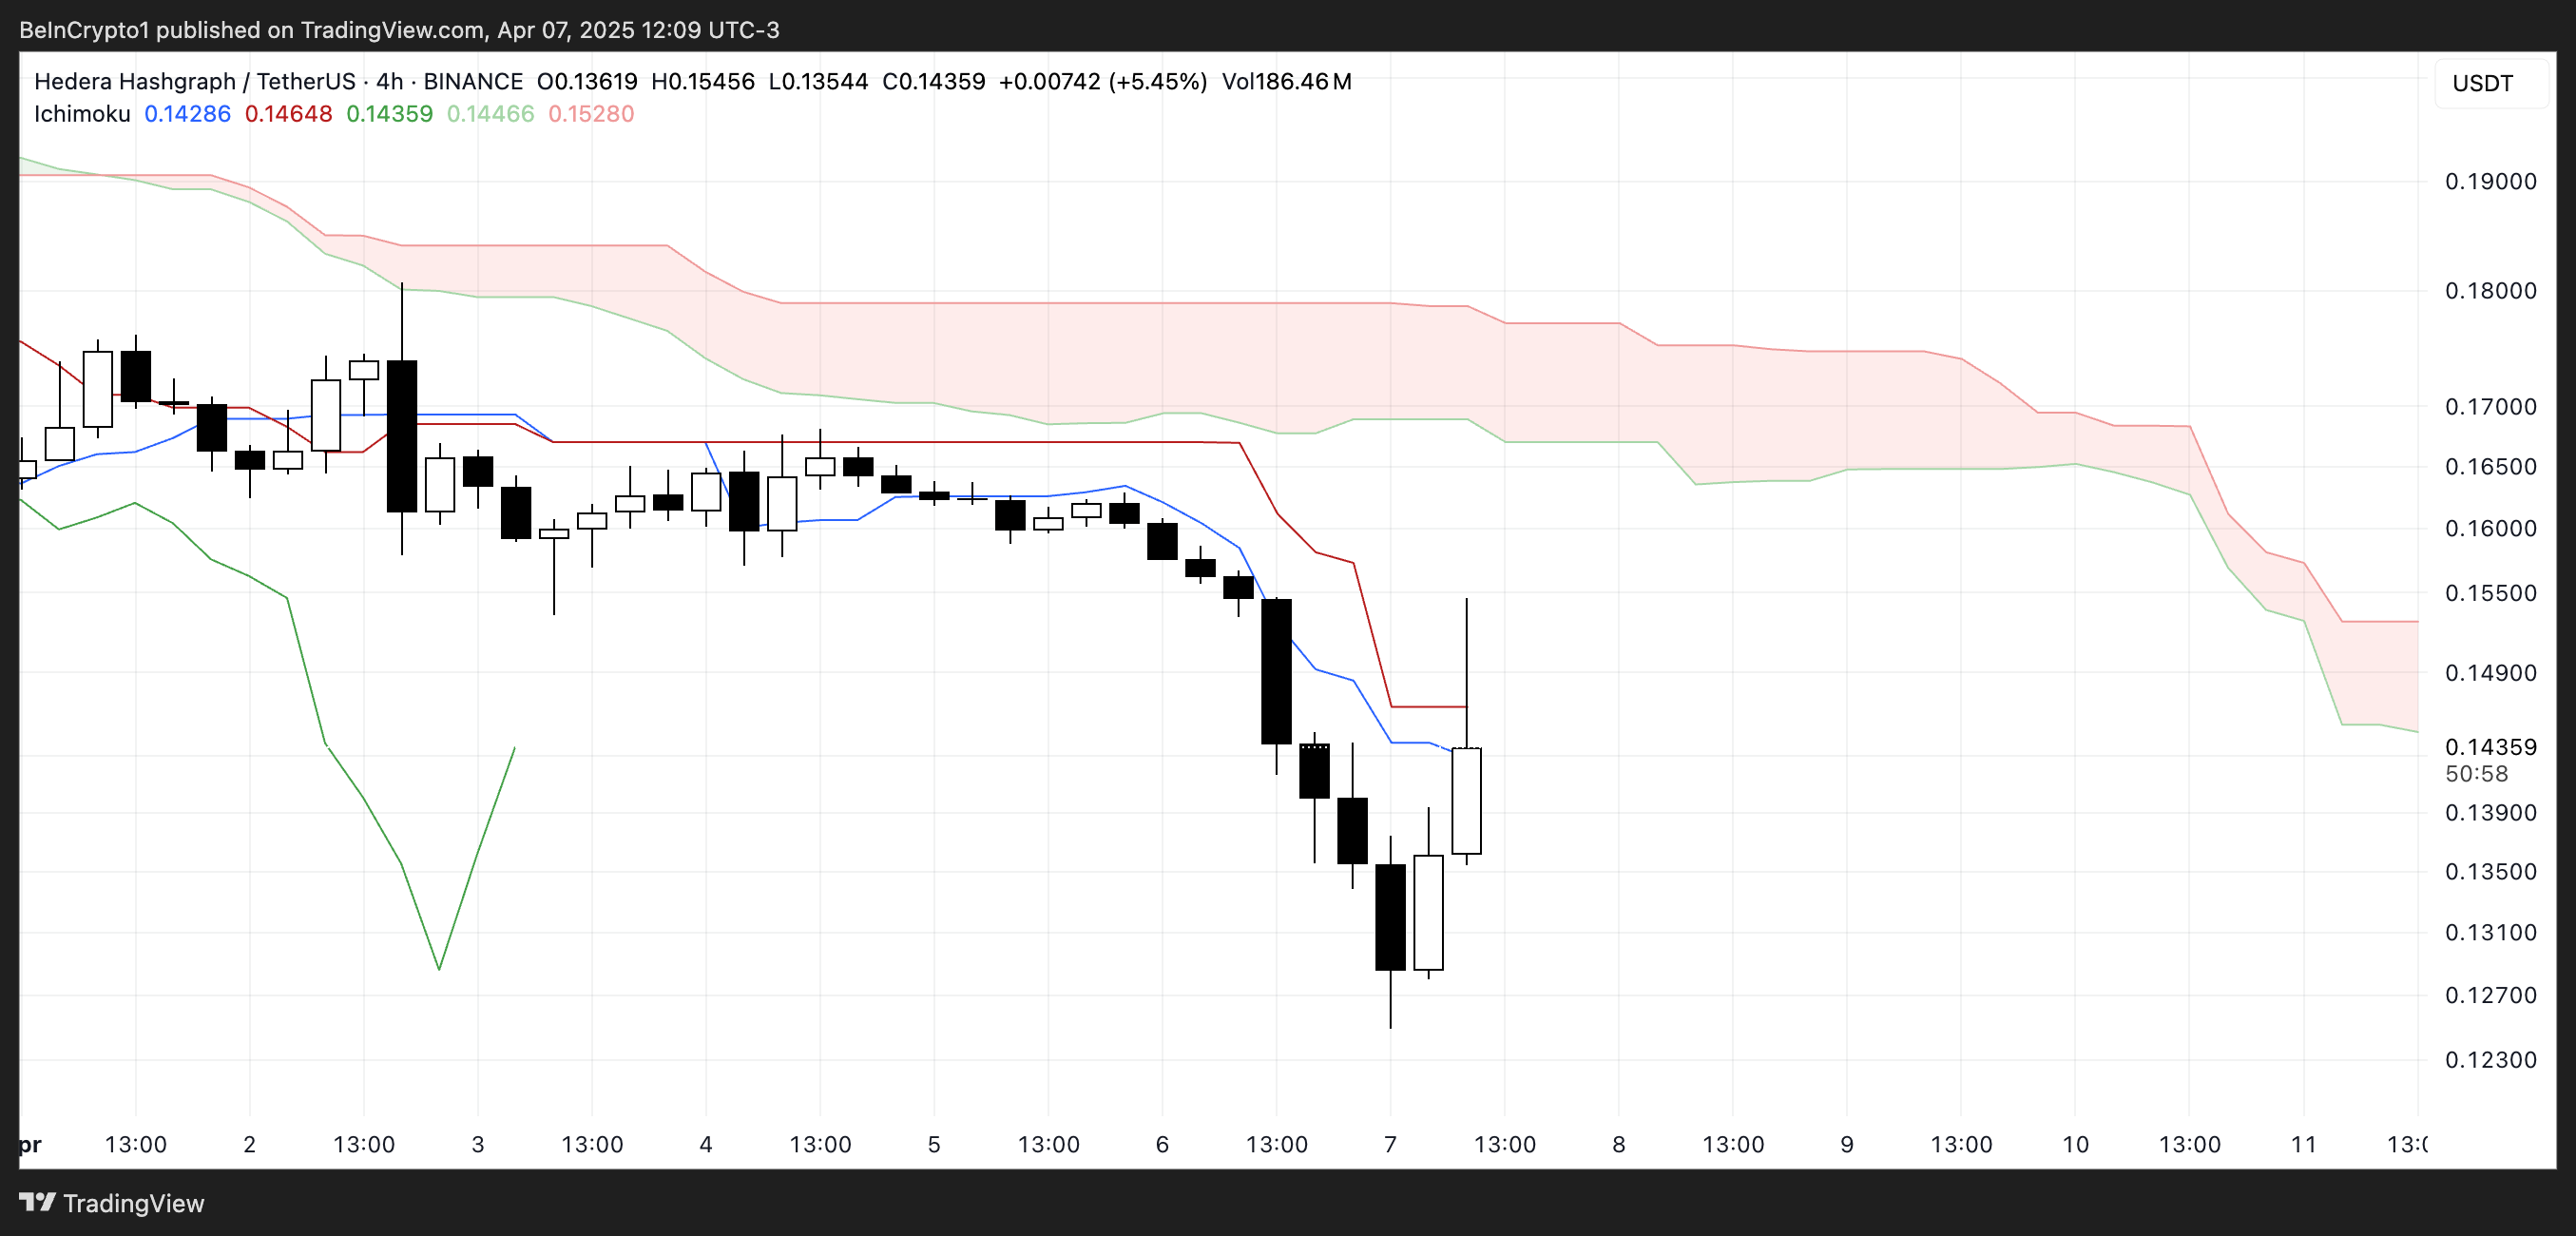
The cloud ahead is thick and red, reinforcing a bearish outlook and signaling that strong resistance lies above the current price action. However, a recent bullish candle pushing toward the Tenkan-sen suggests early signs of a possible relief rally.
For any meaningful trend reversal to occur, HBAR would need to break above both the Tenkan-sen and Kijun-sen, and eventually move into the cloud itself—a challenging task given the current setup.
Overall, the Ichimoku configuration confirms that while some short-term upside is possible, the broader trend remains firmly bearish for now.
Will Hedera Fall To 5-Month Lows?
Hedera’s EMA (Exponential Moving Average) lines continue to signal a bearish trend, with short-term averages positioned below the long-term ones—a classic indication of downward momentum.
As long as this alignment holds, HBAR remains vulnerable to further declines.
If selling pressure resumes, the token could fall to test support at $0.124. A breakdown below that level would mark the first move under $0.12 since November 2024.
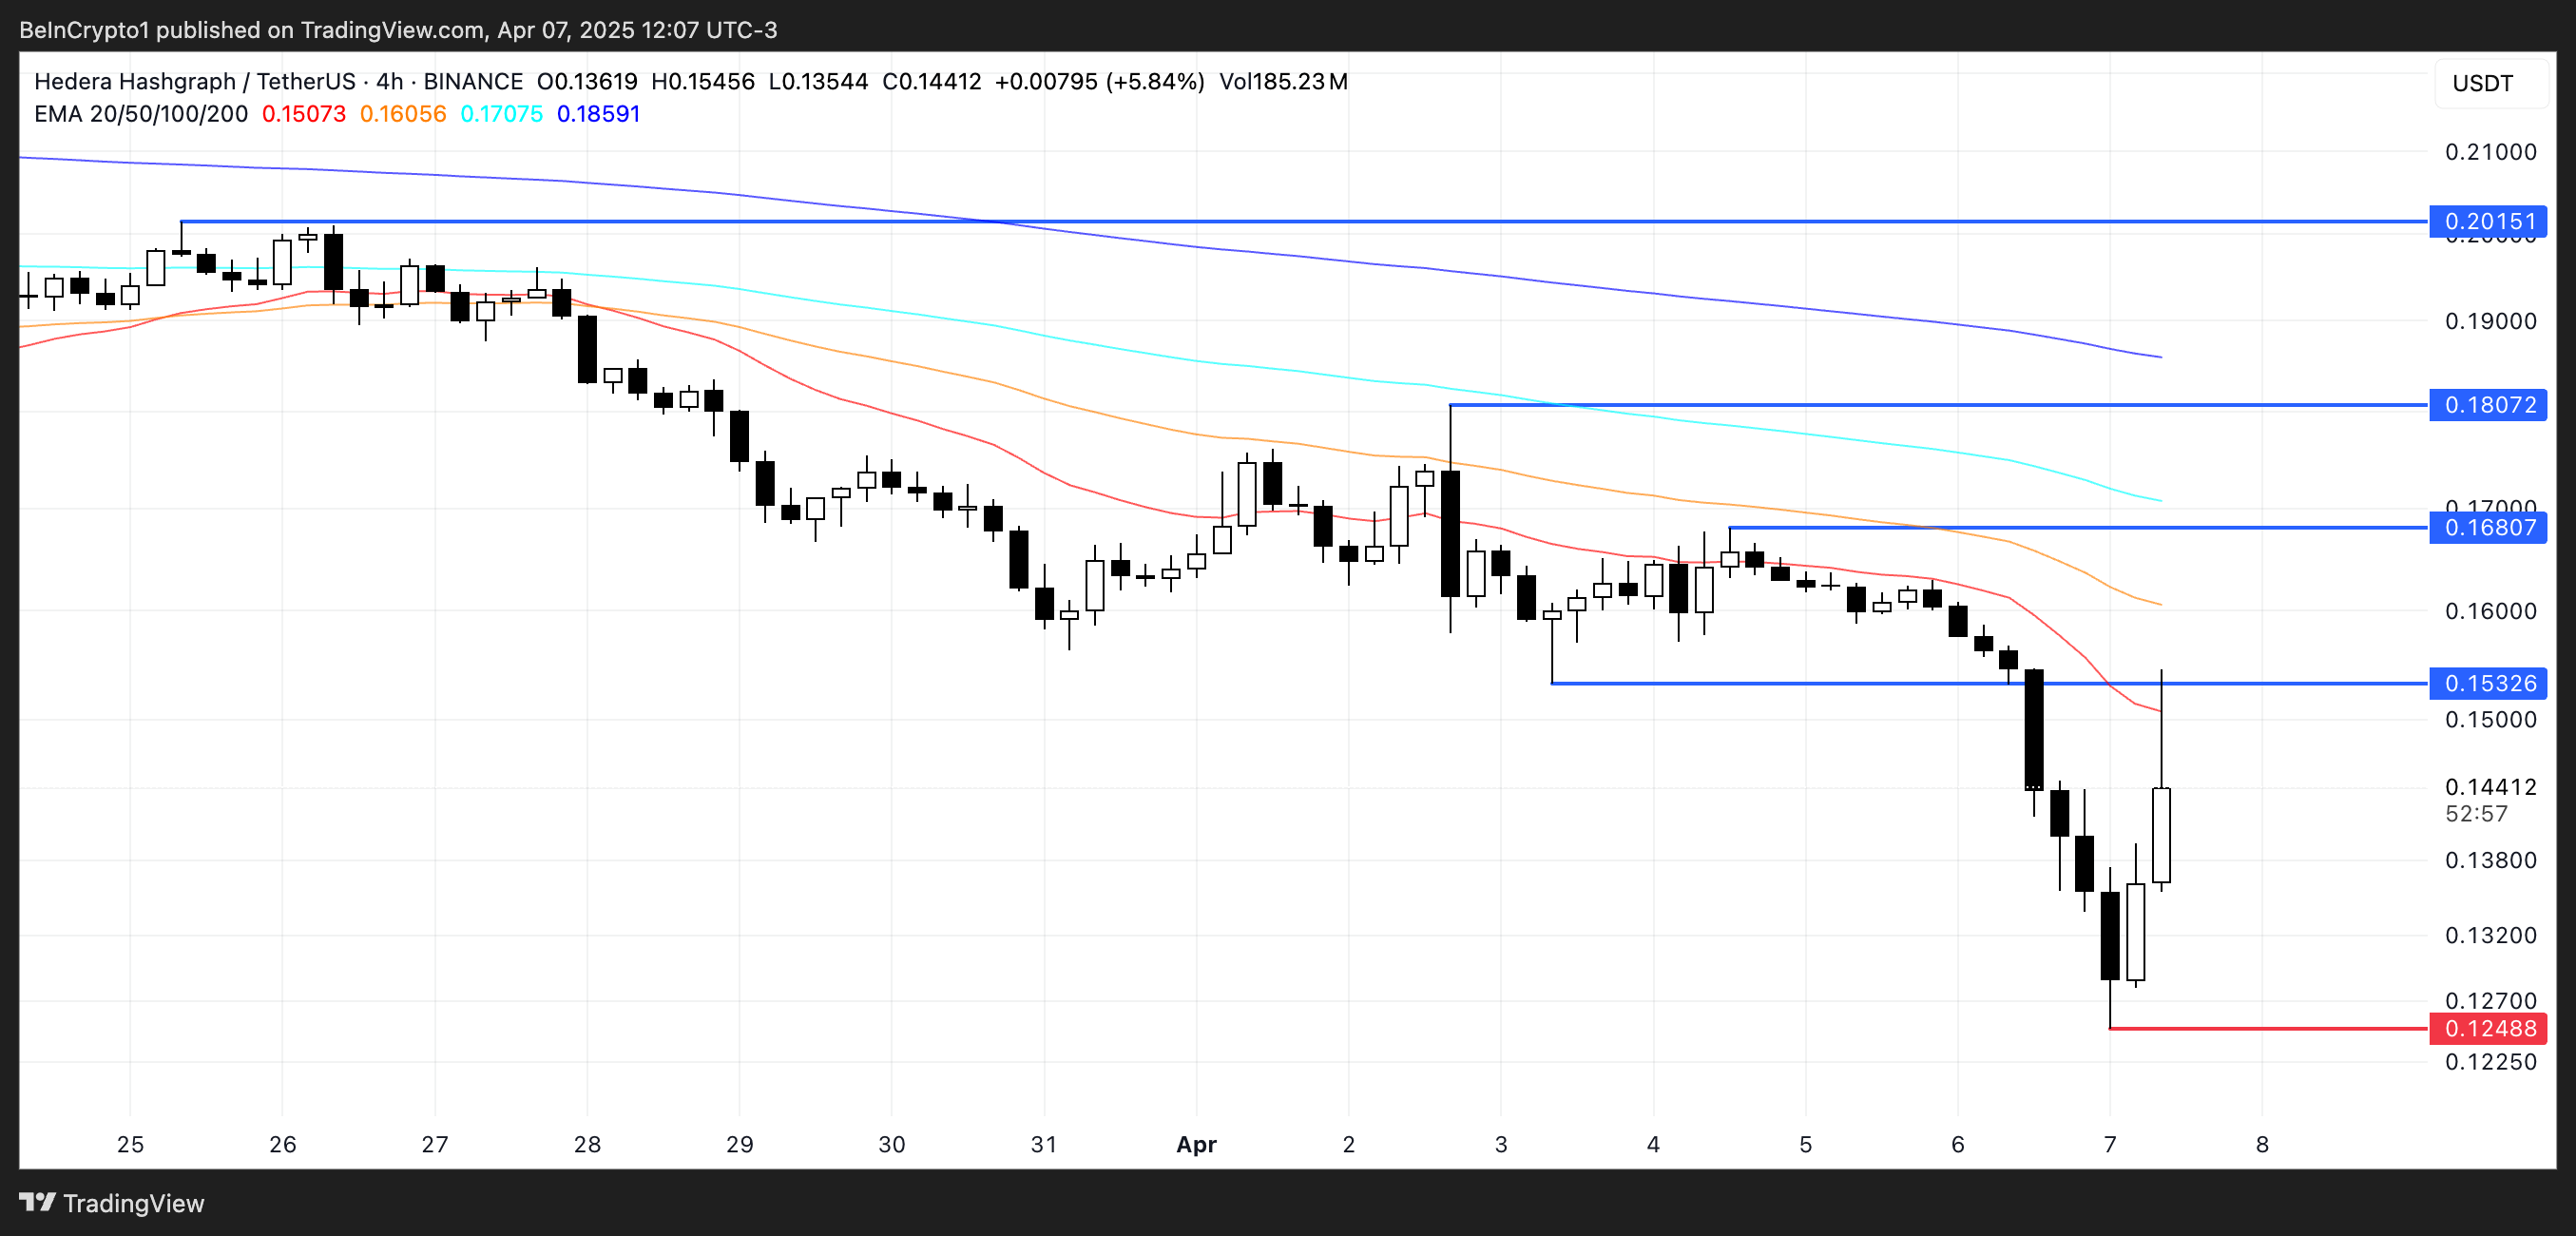
However, if Hedera price manages to reverse its current correction, a recovery could gain traction and push the price toward resistance at $0.155.
A breakout there could pave the way for further gains to $0.168, and if bullish momentum accelerates, HBAR could even attempt a move toward the $0.18 and $0.20 zones.
A crossover of the short-term EMAs above the long-term lines would be a key signal confirming a potential trend reversal.
Disclaimer
In line with the Trust Project guidelines, this price analysis article is for informational purposes only and should not be considered financial or investment advice. BeInCrypto is committed to accurate, unbiased reporting, but market conditions are subject to change without notice. Always conduct your own research and consult with a professional before making any financial decisions. Please note that our Terms and Conditions, Privacy Policy, and Disclaimers have been updated.

At this week’s series of Web3 events in Hong Kong, industry leaders are highlighting real world asset (RWA) tokenization as a pivotal evolution in blockchain’s journey toward mainstream adoption.
“This is the perfect time for our whole industry,” said Shukyee Ma, Chief Strategy Officer of Plume, during an exclusive interview. “After last year’s disappointment with DeFi yields, users are looking for something new, and we have the tokenized assets ready.”
Read more: The Impact of Real World Asset (RWA) Tokenization
Purpose-Built Blockchains Leading the Way
A key trend emerging from the discussions is the development of purpose-built blockchains specifically designed for RWAs, rather than using existing general-purpose chains.
“All those public chains are not built for RWA protocols,” explained Ma. “That’s why we build this RWA chain and put DeFi composability on top of it to make it easier for crypto users to adopt.”
“Over the next 10 years we’re going to see a lot of existing fungible assets coming on chain—US treasuries, sovereign bonds, equities,” predicted Jayant Ramanand, Co-founder of MANTRA. “As these assets come on chain, you’ll have fungible, movable value that can be transferred across the world instantly.”
Regulatory Challenges and Opportunities
Industry professionals identified regulatory certainty as vital for widespread adoption.
“In order to further unlock the potential of this technology and encourage traditional finance to adopt it, we issued circulars to provide guidance,” said Elizabeth Wong, Director of Fintech at Hong Kong’s Securities and Futures Commission. “We maintained it to be agnostic to the technology used, as each blockchain has their benefits and limitations.”
Vivian Mei, a lawyer specializing in RWA compliance, observed that global regulatory frameworks are becoming increasingly aligned: “The overall regulatory landscape is moving toward high convergence in terms of virtual asset definitions, KYC requirements, and compliance standards.”

George Chou, Chief Fintech Officer at Hong Kong Monetary Authority, highlighted their Project Ensemble initiative: “We want to explore an innovative market infrastructure with the industry to facilitate settlement using tokenized money, and identify impactful domestic and cross-border use cases with leading experts and industry pioneers.”
Bridging Traditional Finance with Crypto
“It’s not just simply bringing offline assets on-chain. It’s providing a structural change in how the real world and virtual world connect,” said JJ from The PAC, whose platform recently tokenized a quantitative fund with approximately $100 million in assets.
While financial assets will lead early adoption, Rachel Keum, CEO of VaultX, offers a different approach with her platform tokenizing art assets using NFC technology: “Our mission is to revolutionize RWA ownership by empowering digital-illiterate creators and collectors to unlock new value in the digital economy.” She explained that VaultX had already launched partnerships with galleries across Asia and Europe, creating a decentralized marketplace for artists to receive ongoing royalties from secondary sales.
Consumer-focused applications are also emerging. “The real distribution is never for institutional investors—it’s for the people,” said EudemoniaCC from Morph, whose Black Card quickly gained popularity. “We’re trying to put payment and consumption at the center, letting people spend their crypto assets in the real world while bringing new audiences into the ecosystem.”
Disclaimer
In adherence to the Trust Project guidelines, BeInCrypto is committed to unbiased, transparent reporting. This news article aims to provide accurate, timely information. However, readers are advised to verify facts independently and consult with a professional before making any decisions based on this content. Please note that our Terms and Conditions, Privacy Policy, and Disclaimers have been updated.

Ethereum Price Rebound Stalls—Can It Reclaim the Lost Support?

Hedera (HBAR) Drops 8% as Market Signals Remain Mixed

RWA Tokenization Takes Center Stage in Hong Kong

Solana’s Fartcoin Jumps 20% Despite Market Selloff

RWA Tokens Outperform Bitcoin During Tariffs
Programmer Reveals Reason To Be Bullish On Pi Network Despite Pi Coin Price Crash


-

 Market20 hours ago
Ethereum Price Tanks Hard—Can It Survive the $1,500 Test?
-

 Market18 hours ago
Bitcoin Price Crashes Hard—Is The Selloff Just Getting Started?
-

 Market13 hours ago
Is $0.415 the Key to Further Gains?
-
 Bitcoin21 hours ago
$1 Billion in Liquidations Over the Weekend
-
 Market21 hours ago
Solana (SOL) Price Falls Below $100, Crashes To 14-Month Low
-
 Bitcoin19 hours ago
Will 2025’s Crypto Market Mirror 2020’s Rebound? Analysts Predict
-

 Bitcoin17 hours ago
5 US Economic Events With Crypto Market Implications This Week
-

 Market19 hours ago
Will ADA Drop to $0.44?
 Arabic
 Chinese (Simplified)
 Dutch
Dutch English
 French
 German
 Italian
 Portuguese
 Russian
 Spanish
 Vietnamese