Market
Pepe (PEPE) Whales Have No Skin in the Game

The meme coin market has witnessed a decline in value over the past month. This has impacted the performance of the frog-themed asset Pepe (PEPE), whose price has maintained a downtrend since it climbed to a monthly peak of $0.0000096 on August 24.
Due to this, daily transactions involving the meme coin have mostly ended in losses, spurring PEPE whales to reduce their trading activity.
Pepe Holders Run Away From Losses
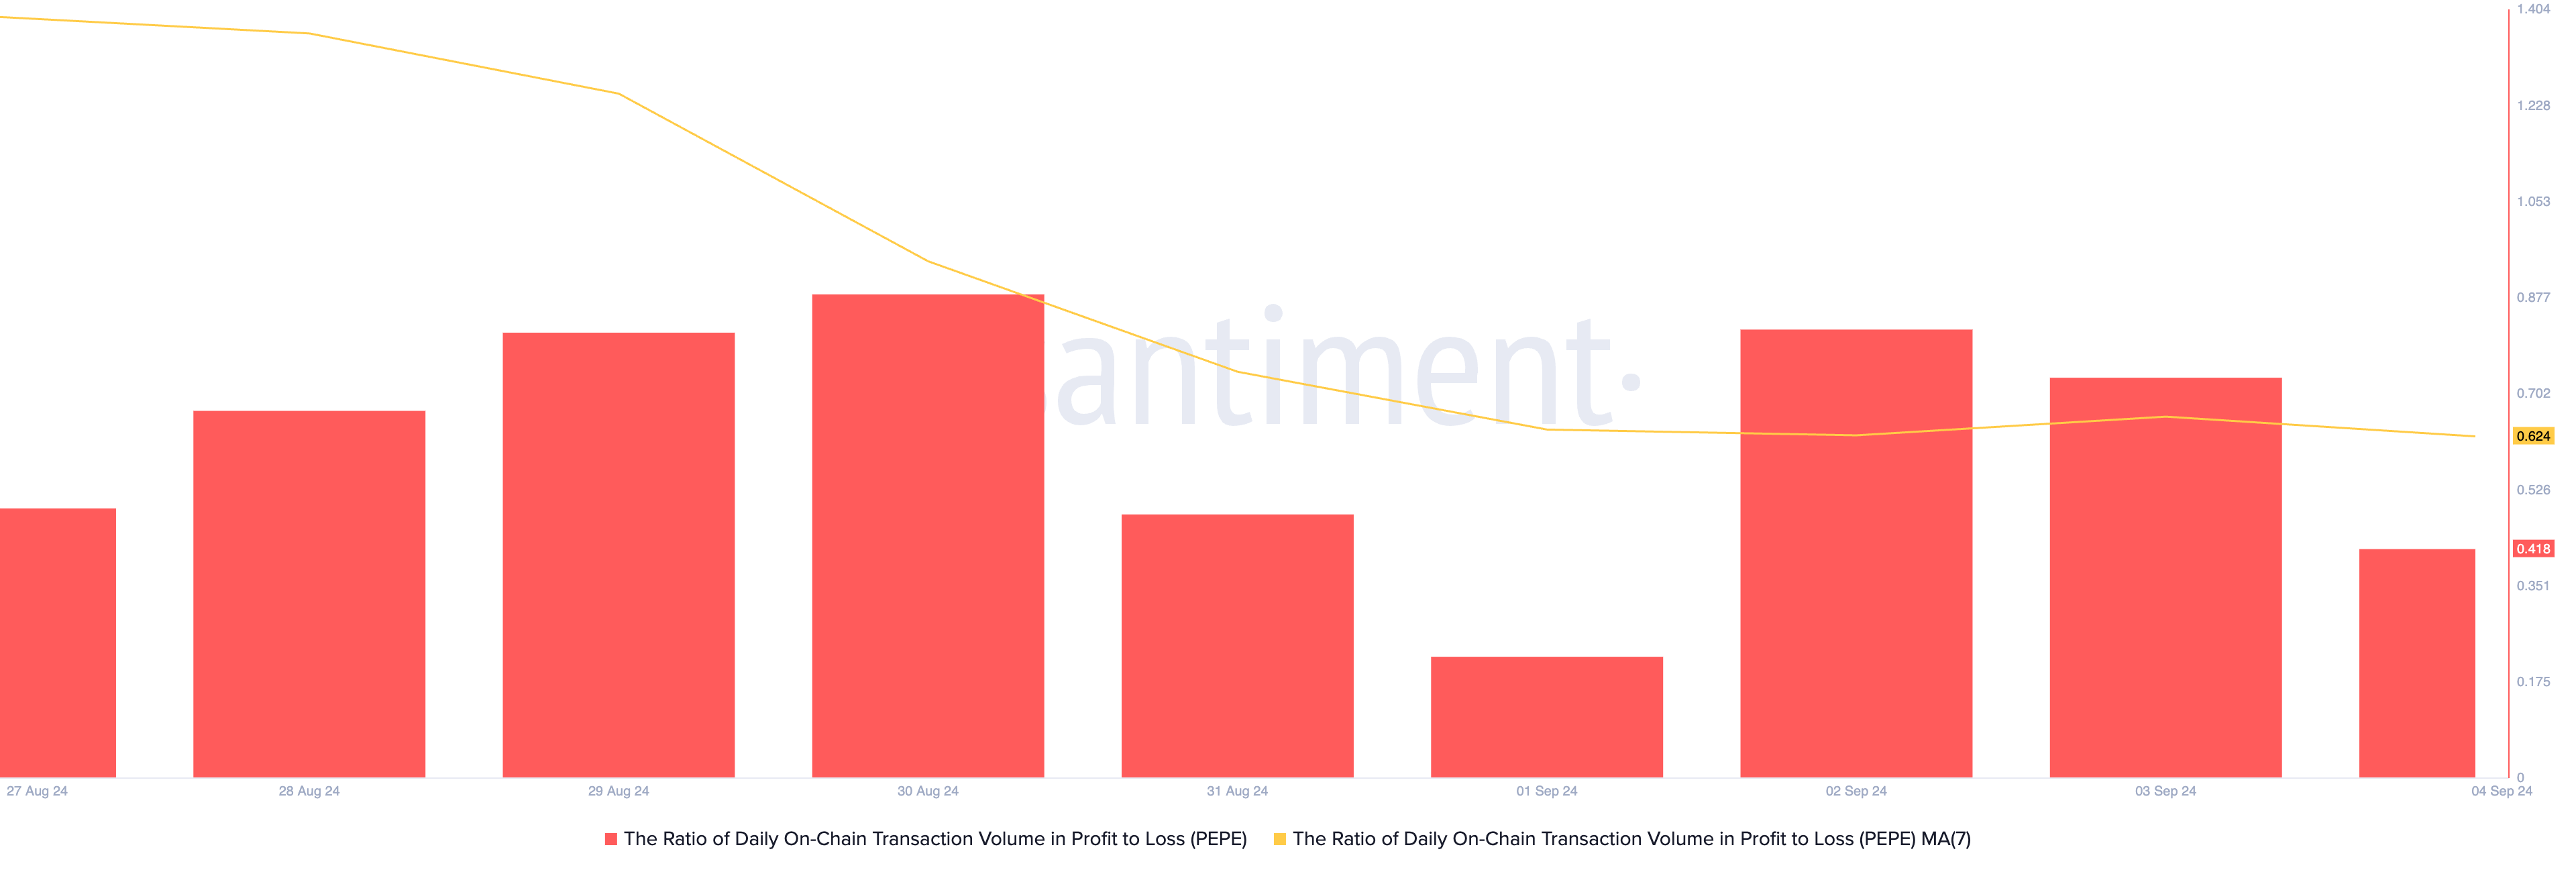
As of this writing, PEPE is trading at $0.0000071, reflecting a 26% price drop over the past two weeks. This decline has led to many daily transactions resulting in losses.
BeInCrypto has found that PEPE’s daily transaction volume ratio of profit to loss, based on a 7-day moving average, has remained below one since August 29. Currently, the ratio stands at 0.62, meaning that for every transaction ending in a loss, only 0.62 transactions are profitable.

The decline in PEPE’s price and the low profitability of its daily transactions have led its large holders to reduce their exposure gradually. This can be gleaned from the drop in the daily count of large transactions involving the altcoin.
IntoTheBlock’s data shows that the daily count of PEPE transactions worth between $100,000 and $1 million has dropped by 86% over the past 30 days. During the same period, the number of larger transactions worth between $1 million and $10 million completed daily has decreased by 90%.
Additionally, PEPE’s large holders’ netflow has dropped by 90% over the past month, indicating substantial offloading by whales. Large holders, defined as addresses controlling more than 0.1% of the asset’s circulating supply, have been reducing their positions. Netflow tracks the difference between the amount of coins acquired and those moved out during a specific period, highlighting this downward trend.
Read more: Pepe: A Comprehensive Guide to What It Is and How It Works

When their netflow drops, it means they are selling their holdings. It is a bearish sign that can trigger a wave of market-wide coin distribution, putting downward pressure on an asset’s price.
PEPE Price Prediction: Meme Coin Seeks To Extend Losses
PEPE’s one-day chart suggests further short-term decline, as its MACD line (blue) recently crossed below its signal line (orange). The MACD is a key indicator that tracks trend direction, potential reversals, and momentum changes.
When the MACD line drops below the signal line, it signals weakening momentum and a likely continuation of the downward trend. If this pattern holds, PEPE’s price could fall to the lower boundary of its falling wedge at $0.0000062.
Read more: Pepe (PEPE) Price Prediction 2024/2025/2030

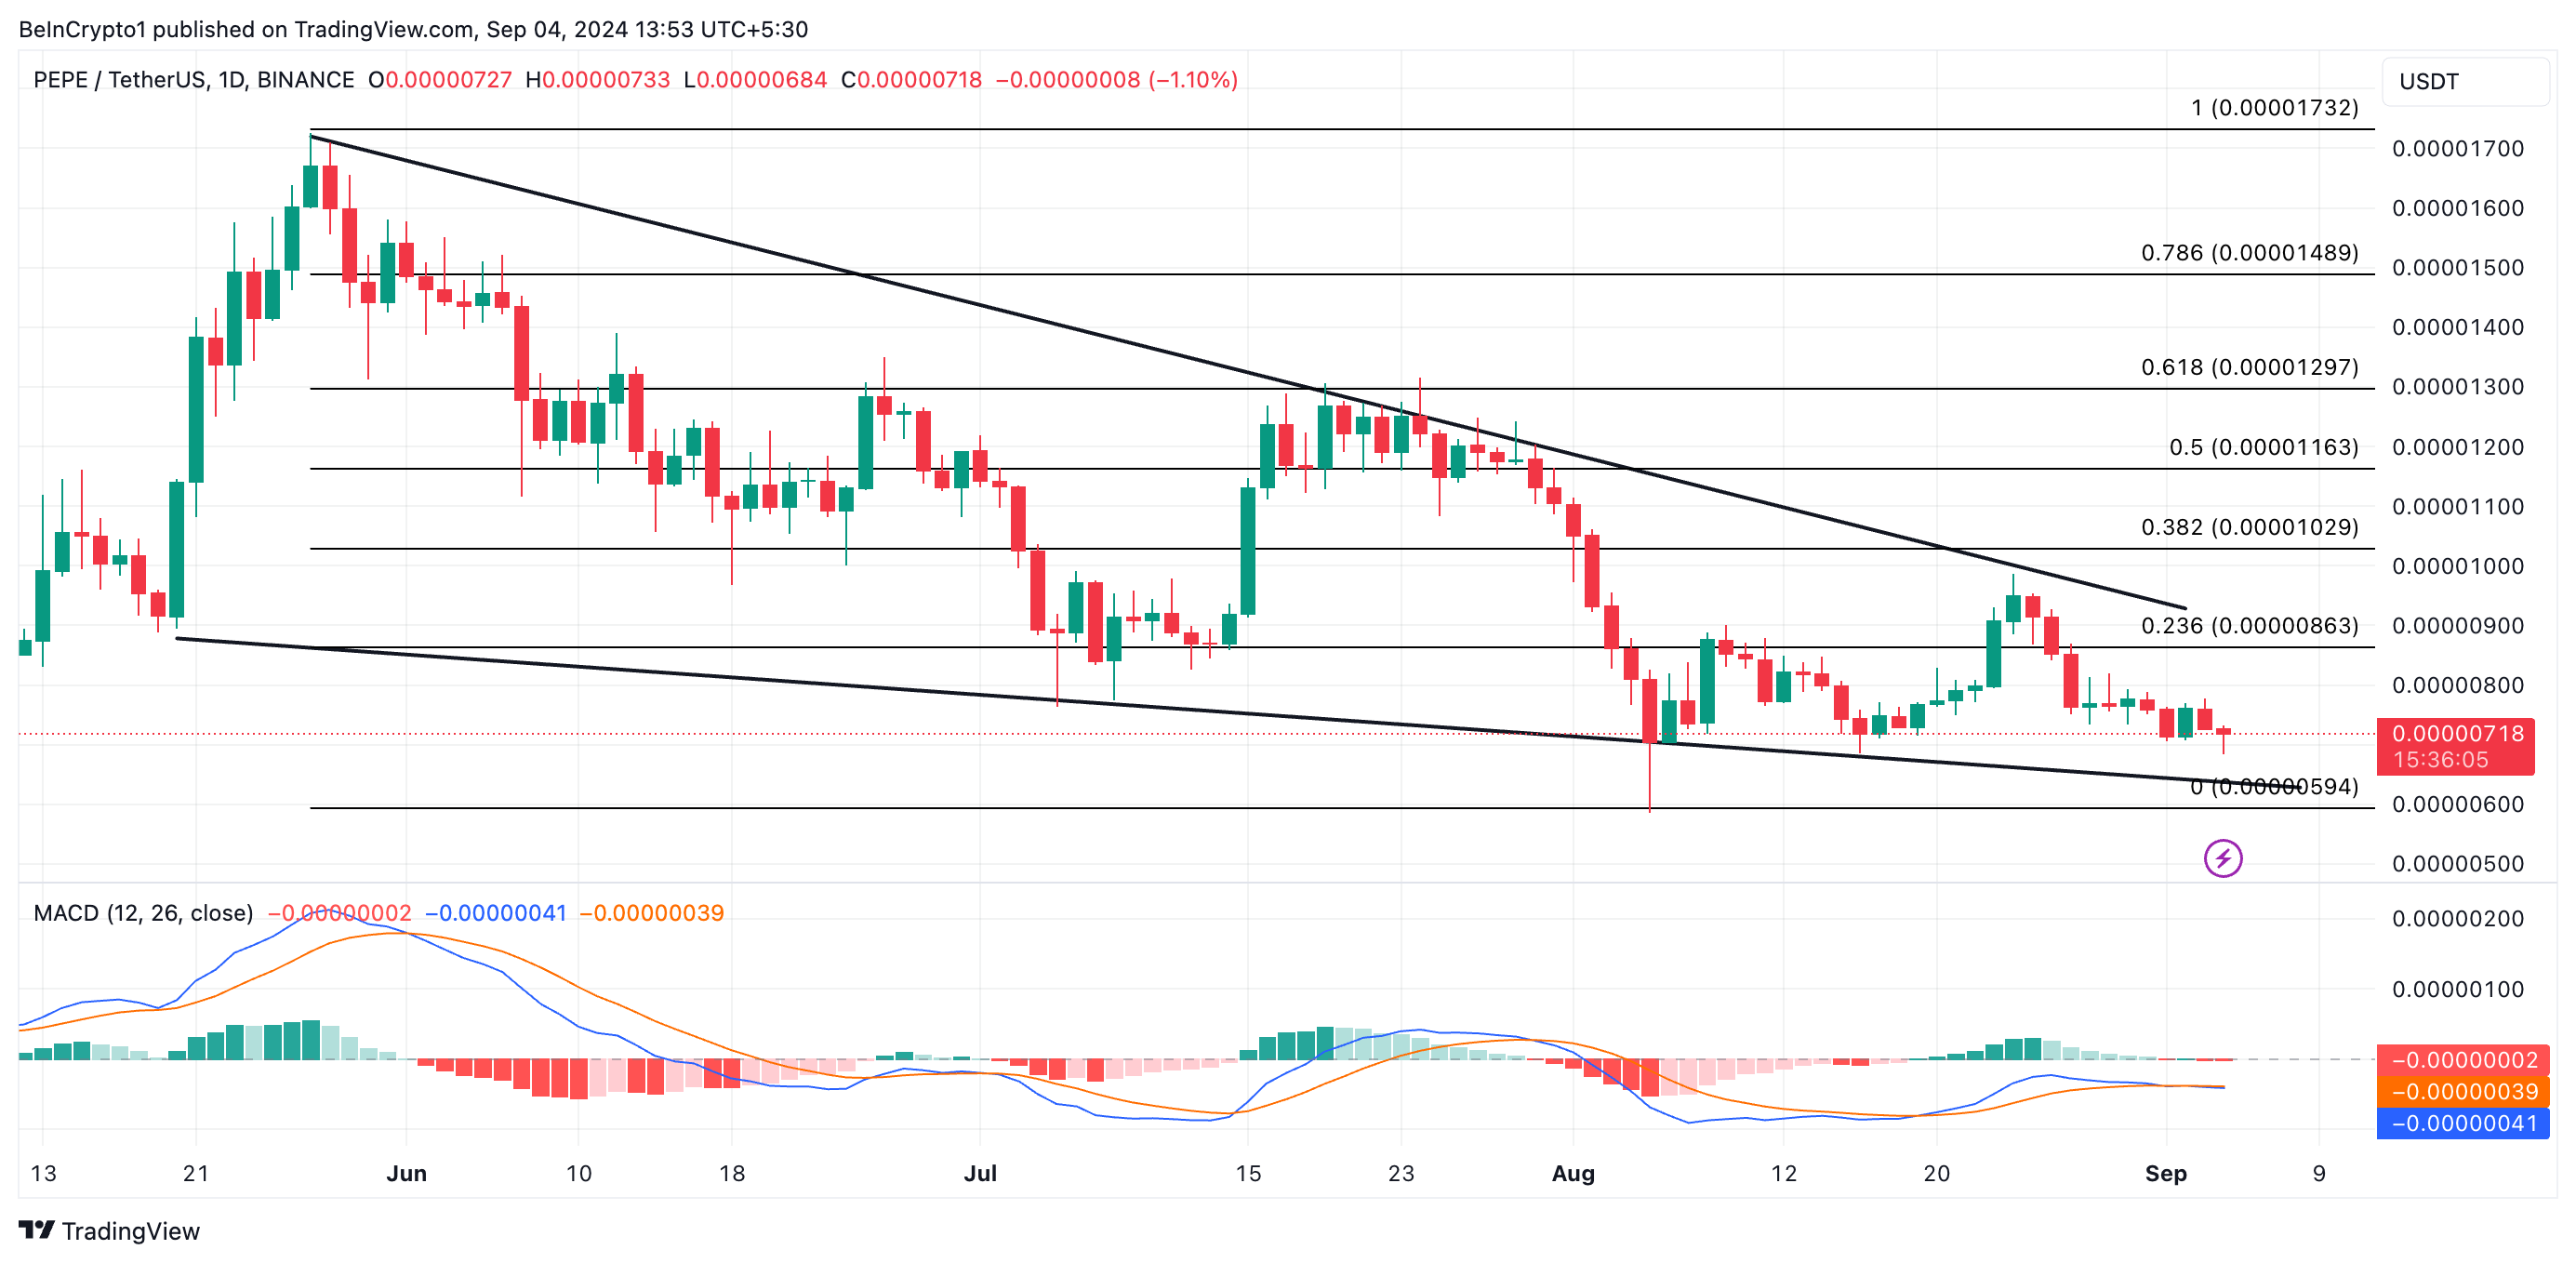
If bulls fail to defend this support level, the price might dip further to $0.0000059. However, a surge in demand could push PEPE’s value up to $0.0000086.
Disclaimer
In line with the Trust Project guidelines, this price analysis article is for informational purposes only and should not be considered financial or investment advice. BeInCrypto is committed to accurate, unbiased reporting, but market conditions are subject to change without notice. Always conduct your own research and consult with a professional before making any financial decisions. Please note that our Terms and Conditions, Privacy Policy, and Disclaimers have been updated.