Market
Market Panic? Not for Chainlink (LINK) Holders: Here’s How

Chainlink’s price was affected by the broader market downturn that occurred earlier in the week. The decline follows a stalemate that has seen LINK hover around $10.
The turmoil has caused widespread panic, with many speculating that the market could be heading into a bear phase. However, the situation appears different for LINK holders.
Chainlink Faithfuls Holding Firm Through the Dip
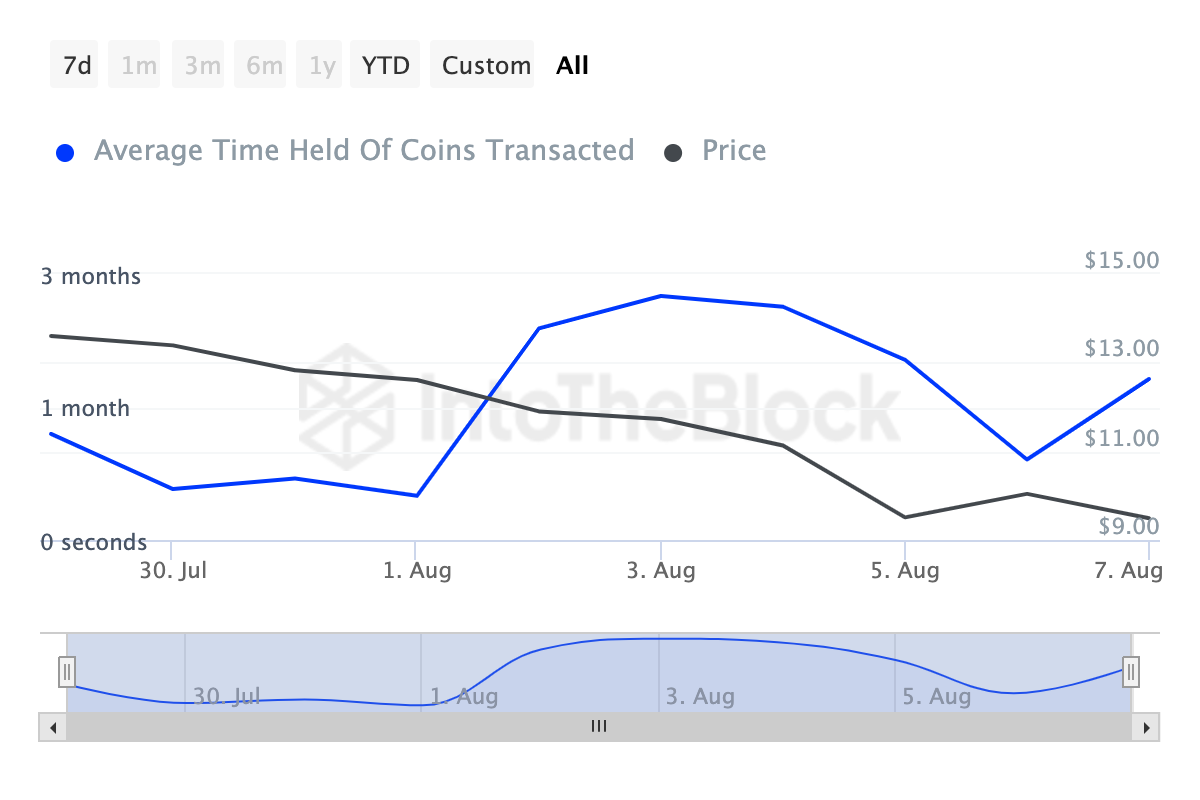
An assessment of Chainlink’s Coin Holding Time reveals a 293% increase in the last seven days. This metric indicates how long investors retain a cryptocurrency without moving it.
In simple terms, a decrease in Coin Holding Time means that holders are either using their tokens for transactions or selling them.
However, for LINK, the recent increase in Coin Holding Time means that Chainlink investors remain unaffected by the market volatility and price drawdown. This suggests a commitment and belief that the cryptocurrency’s price will eventually produce gains.
Read more: What Is Chainlink (LINK)?

If these investors continue holding the token instead of liquidating, LINK’s price may stabilize. Additionally, the Bulls and Bears Indicator suggests that the token may start to recover, as the number of bulls has outpaced the number of bears.
In this context, bulls are market participants buying 1% of the last 24-hour trading volume, while bears are those selling 1% of the volume within the same period.
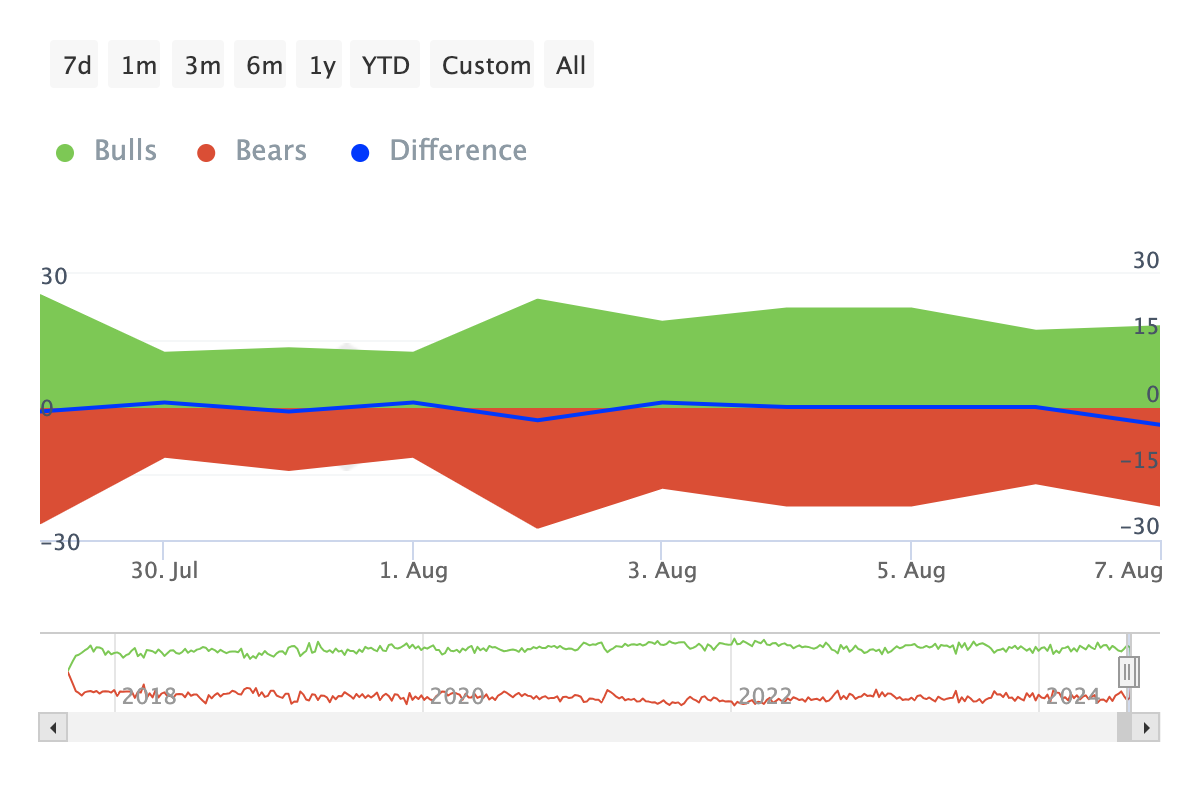
Usually, if bears outweigh bulls, the price of the token involved risks falling. But since it is the other way around for LINK, a rebound could be close.
LINK Price Prediction: Time for Bears to Leave
Chainlink’s technical setup seems to agree with the bullish prediction. One reason for this assertion is the falling wedge formation on the daily chart. Generally, a falling wedge indicates the end of a downtrend as it signals that sellers are losing momentum and buyers are slowly taking advantage of the fatigue.
Furthermore, the Money Flow Index (MFI) which shows the level of liquidity flow into a cryptocurrency, aligns with the thesis. Apart from tracking capital inflow, the MFI also spots overbought and oversold points at readings of 80.00 and 20.00, respectively. According to the chart below, LINK was oversold between August 5 and 6.
At press time, the MFI reading is increasing, suggesting that traders are buying the dip. However, the bullish bias has not yet been validated. Increased buying pressure could push LINK toward $10.69. If this momentum is sustained, the price could retest $12.31.
Read more: Chainlink (LINK) Price Prediction 2024/2025/2030

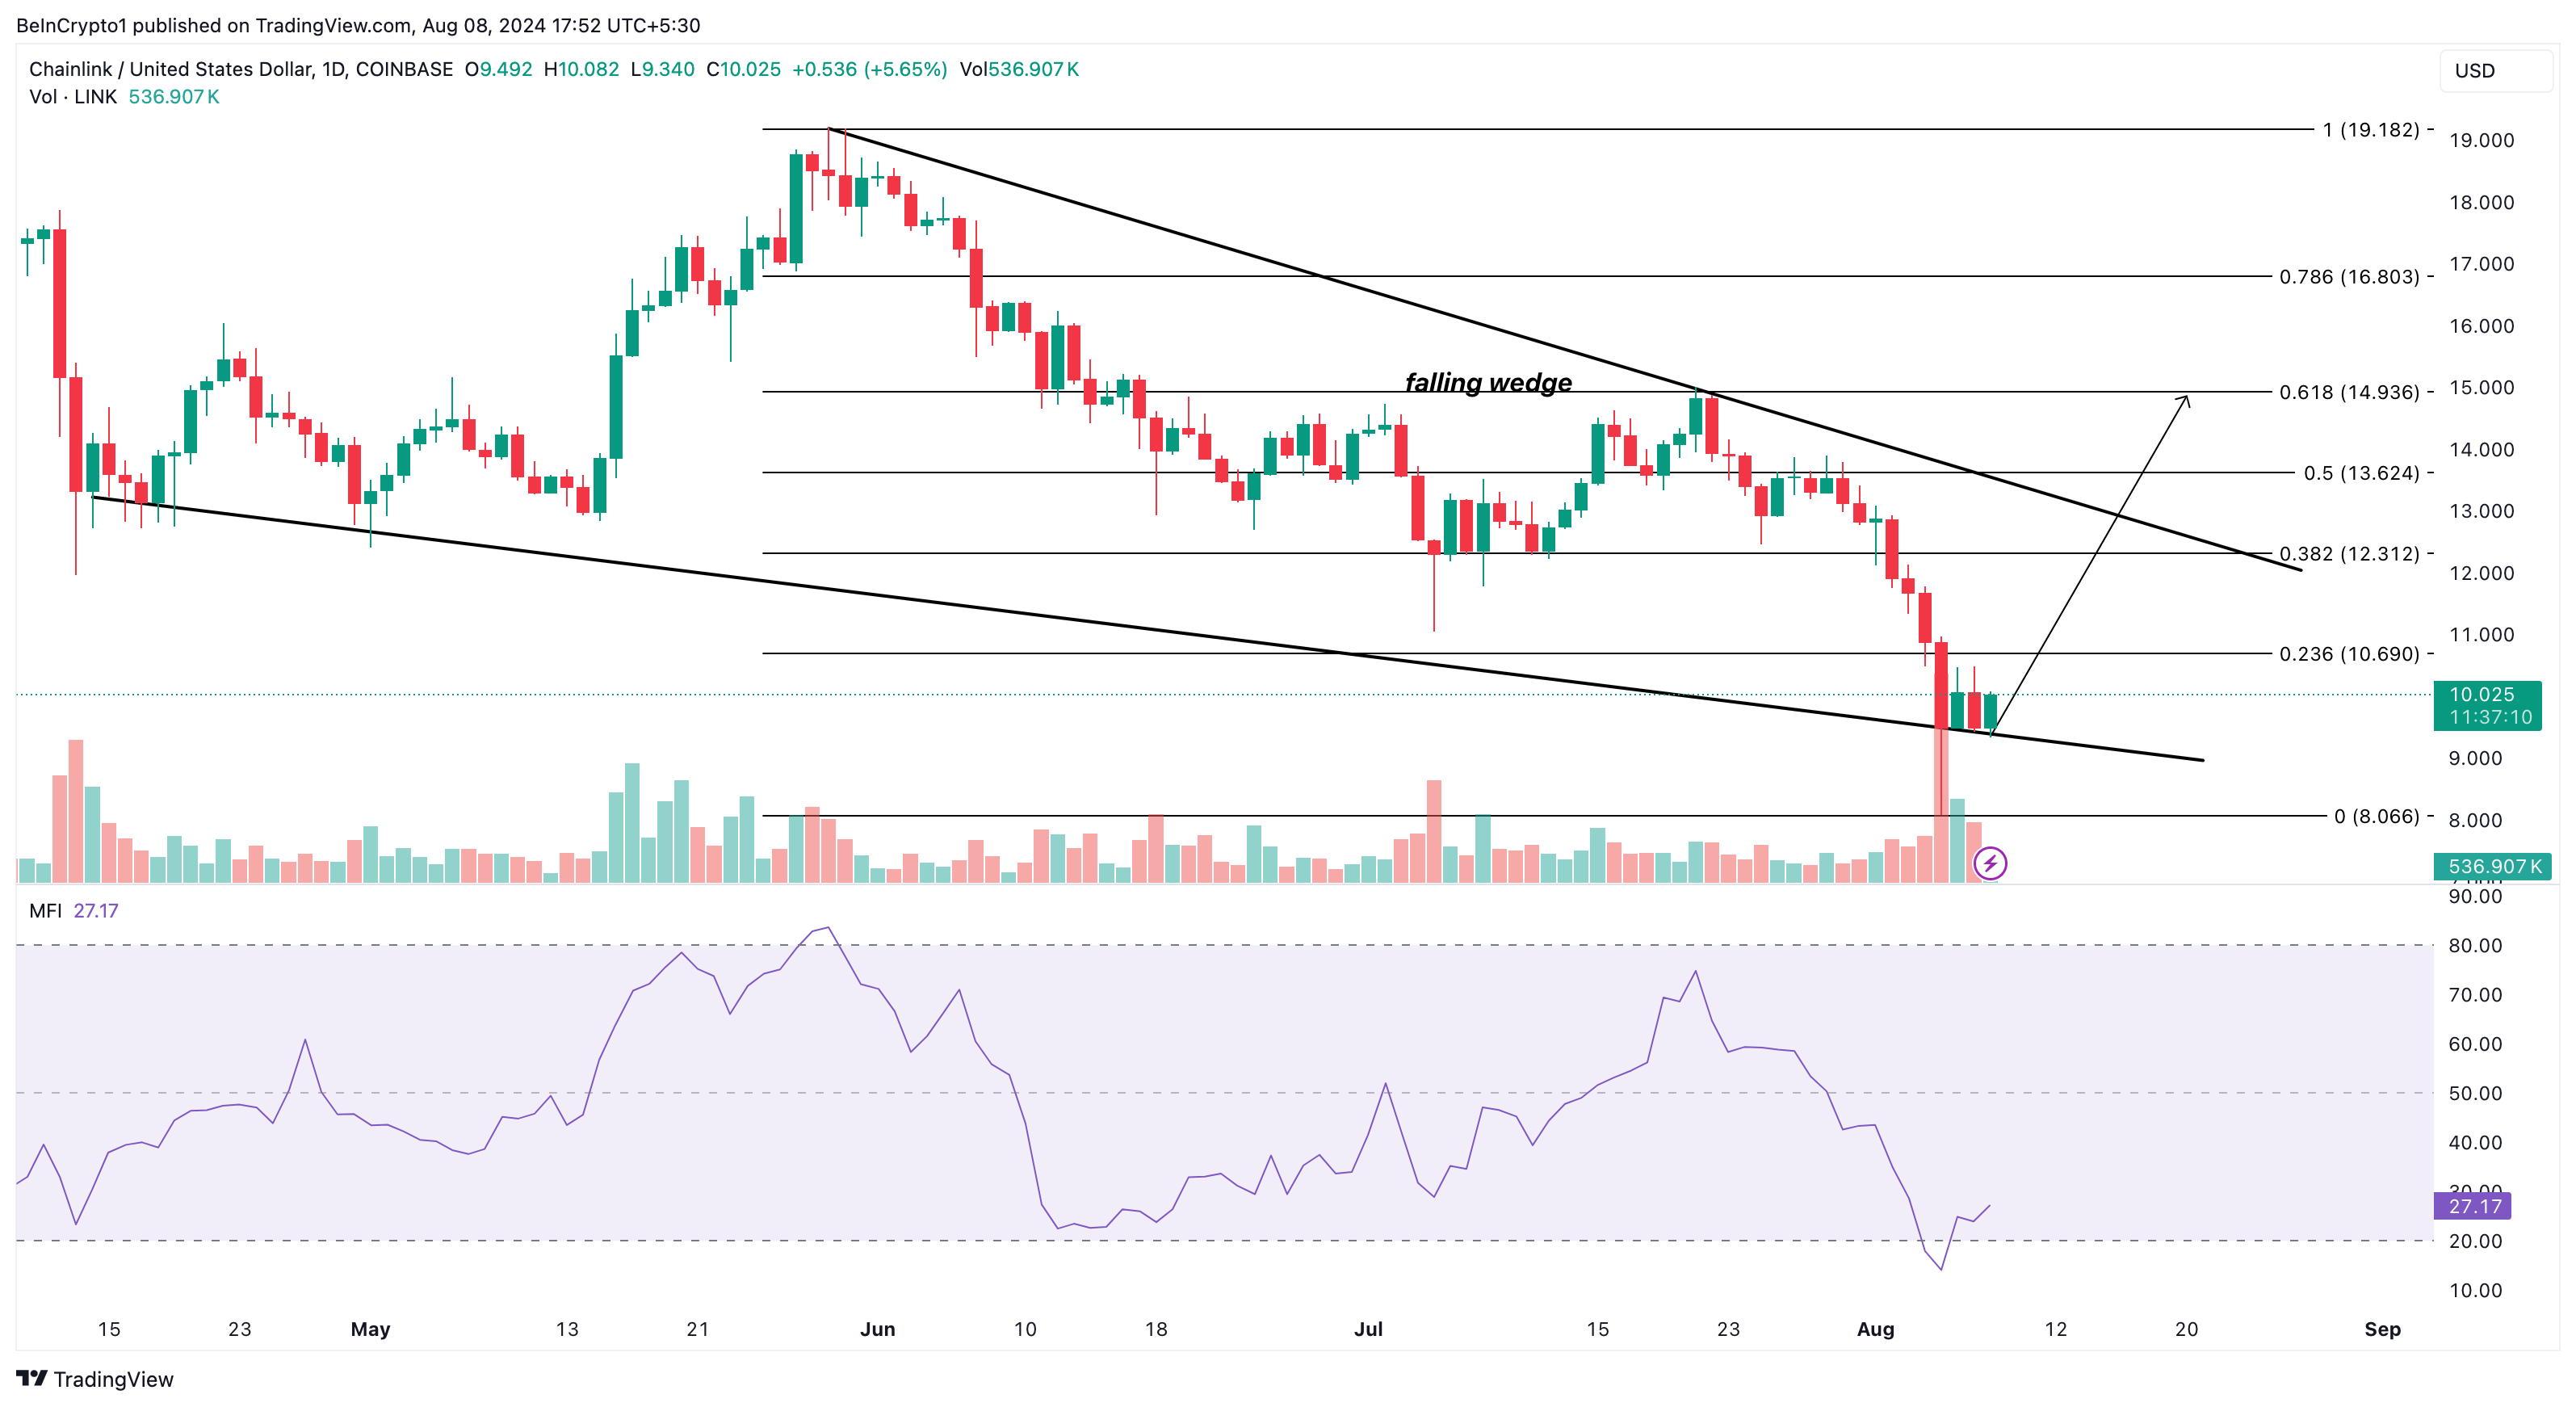
Meanwhile, if LINK holders decide to distribute some of their holdings, this prediction may be invalidated, causing the price to slide toward $8.06.
Disclaimer
In line with the Trust Project guidelines, this price analysis article is for informational purposes only and should not be considered financial or investment advice. BeInCrypto is committed to accurate, unbiased reporting, but market conditions are subject to change without notice. Always conduct your own research and consult with a professional before making any financial decisions. Please note that our Terms and Conditions, Privacy Policy, and Disclaimers have been updated.