
Market
Machine Learning Algorithm Predicts XRP Price Direction For This Week, What To Expect

The XRP price is currently trading at $0.554, having increased by 3% in the past 24 hours. However, XRP largely remains in the red in a 30-day timeframe, having broken below the $0.6 threshold earlier in the month. At the time of writing, XRP is down by 5.3% in the past 30 days.
According to CoinCodex, a machine learning algorithm, XRP should continue on a bullish trajectory this week. According to its latest forecast, XRP is on track for upward momentum this week and will maintain its strength throughout the week, with the price expected to surpass the $0.60 mark.
CoinCodex Forecast: XRP Price Set For A Rally This Week
CoinCodex’s machine learning algorithm paints a bullish picture for the XRP price journey this week. Its Fear & Greed Index, a popular tool that measures investor sentiment, currently reads 72 for XRP, indicating a state of “greed.” Furthermore, the sentiment has now flipped to neutral after spending earlier days in the bearish zone.
Related Reading
According to CoinCodex’s algorithm, XRP’s technical indicators further back up the bullish case. Out of 29 key indicators used in the analysis, 20 are flashing bullish signals, while only nine are giving bearish signals. This overwhelming tilt towards positive momentum points to growing market confidence in XRP’s short-term prospects. Given these indicators, the algorithm predicts that XRP is primed to break above the $0.60 threshold again this week.
More notably, CoinCodex anticipates that XRP could achieve double-digit gains by the end of the week. The algorithm sets a target for XRP to close the week at $0.635269, which represents a significant 16% increase from its current price levels. Such an outcome would mark a major milestone for XRP, as it would be the first time in quite some time that the cryptocurrency posts double-digit gains on a weekly timeframe.
What To Expect For XRP This Week
If the XRP price movement plays out as predicted, it could signal the beginning of an extended bullish trend for the cryptocurrency as momentum builds up and investors pile in. The combination of positive technical indicators and strong market sentiment makes this week a crucial period for XRP, as it suggests that the asset is positioned for further gains.
Related Reading
According to CoinCodex’s analysis, XRP has support levels at $0.540343, $0.534077, and a stronger foundation at $0.530528. On the resistance side, key levels to watch include $0.550157, $0.553706, and $0.559972, which could present challenges on its upward path.
The key XRP price target to watch will be the $0.60 level. If breached, the momentum could pave the way for XRP to test the projected $0.643268 mark by the end of the week.
Featured image created with Dall.E, chart from Tradingview.com


Ethereum (ETH) is down almost 6% in the last 24 hours, intensifying a week of sharp declines. With the price below $1,500, market watchers are increasingly questioning whether ETH could fall to $1,000 in April.
Mounting concerns around liquidations, declining network activity, and bearish technicals are fueling the debate. As investor sentiment wavers, the next few days could prove critical for Ethereum’s short-term trajectory.
If ETH Falls Below $1200, Nearly $342 Million Will Be Liquidated
Ethereum is currently hovering just above the $1,500 mark, down more than 15% over the past week as bearish pressure intensifies across the crypto market.
The recent downturn has sparked concern among traders, especially with ETH struggling to hold key support levels. Standard Chartered recently stated that XRP could overtake Ethereum by 2028.
The decline reflects broader risk-off sentiment and uncertainty surrounding altcoins, with Ethereum now teetering dangerously close to levels that could trigger a major wave of liquidations.
According to on-chain data, if ETH falls below $1,200, it could trigger liquidations totaling approximately $342 million across leveraged positions.
Liquidation occurs when traders who borrowed capital to go long on Ethereum are forced to sell their holdings due to falling prices. This effectively amplifies the downside and adds more selling pressure.
Weighing in on the situation, investor Peter Schiff took to X, warning that he doesn’t think it will take long before Ethereum crashes below $1,000 — a level not seen since January 2021.
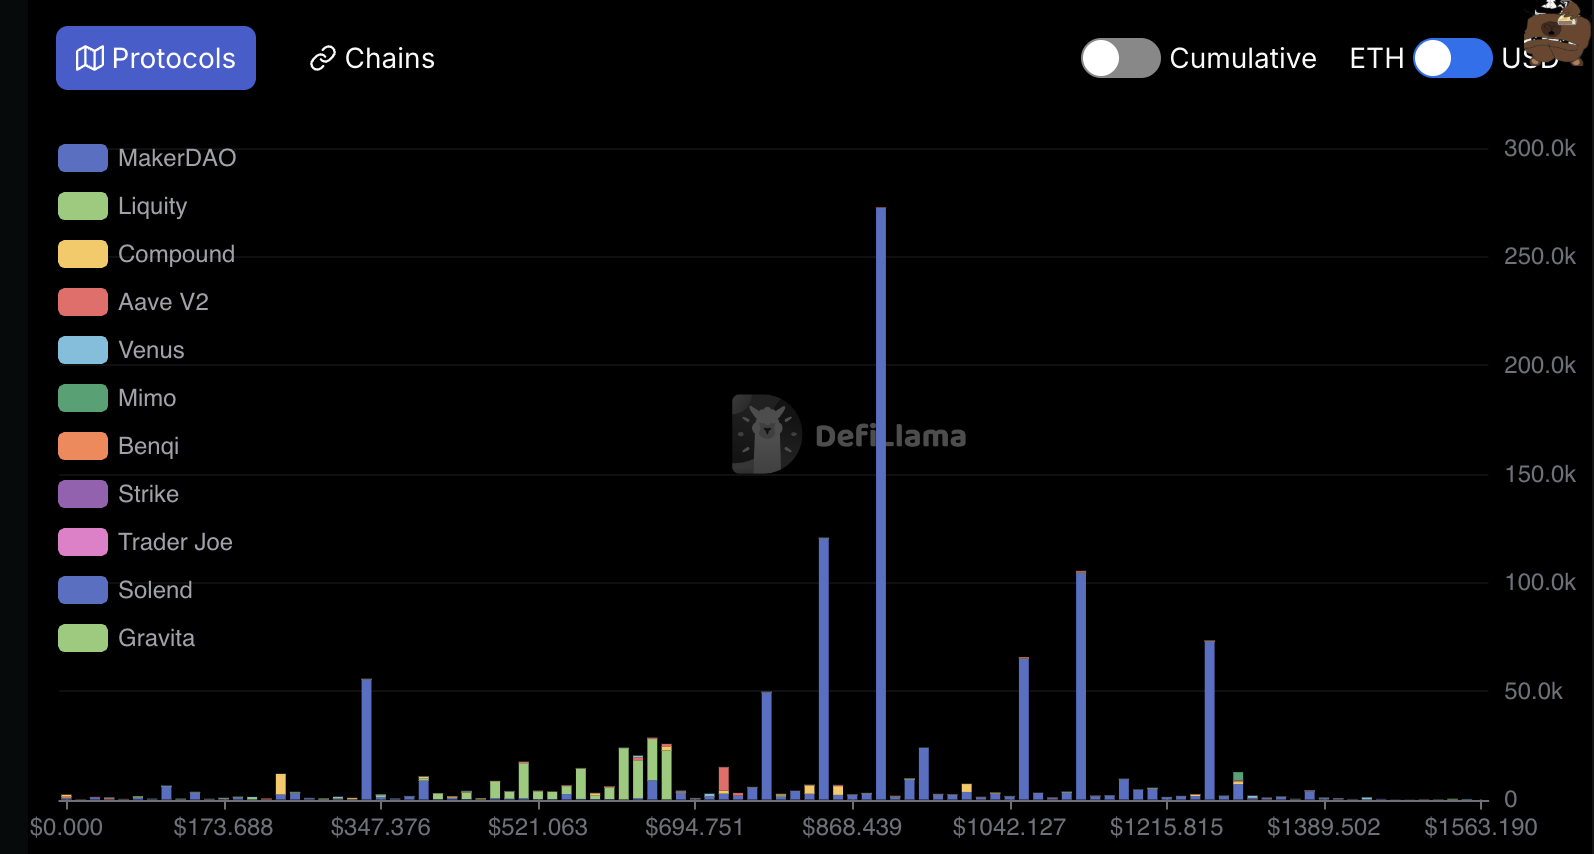
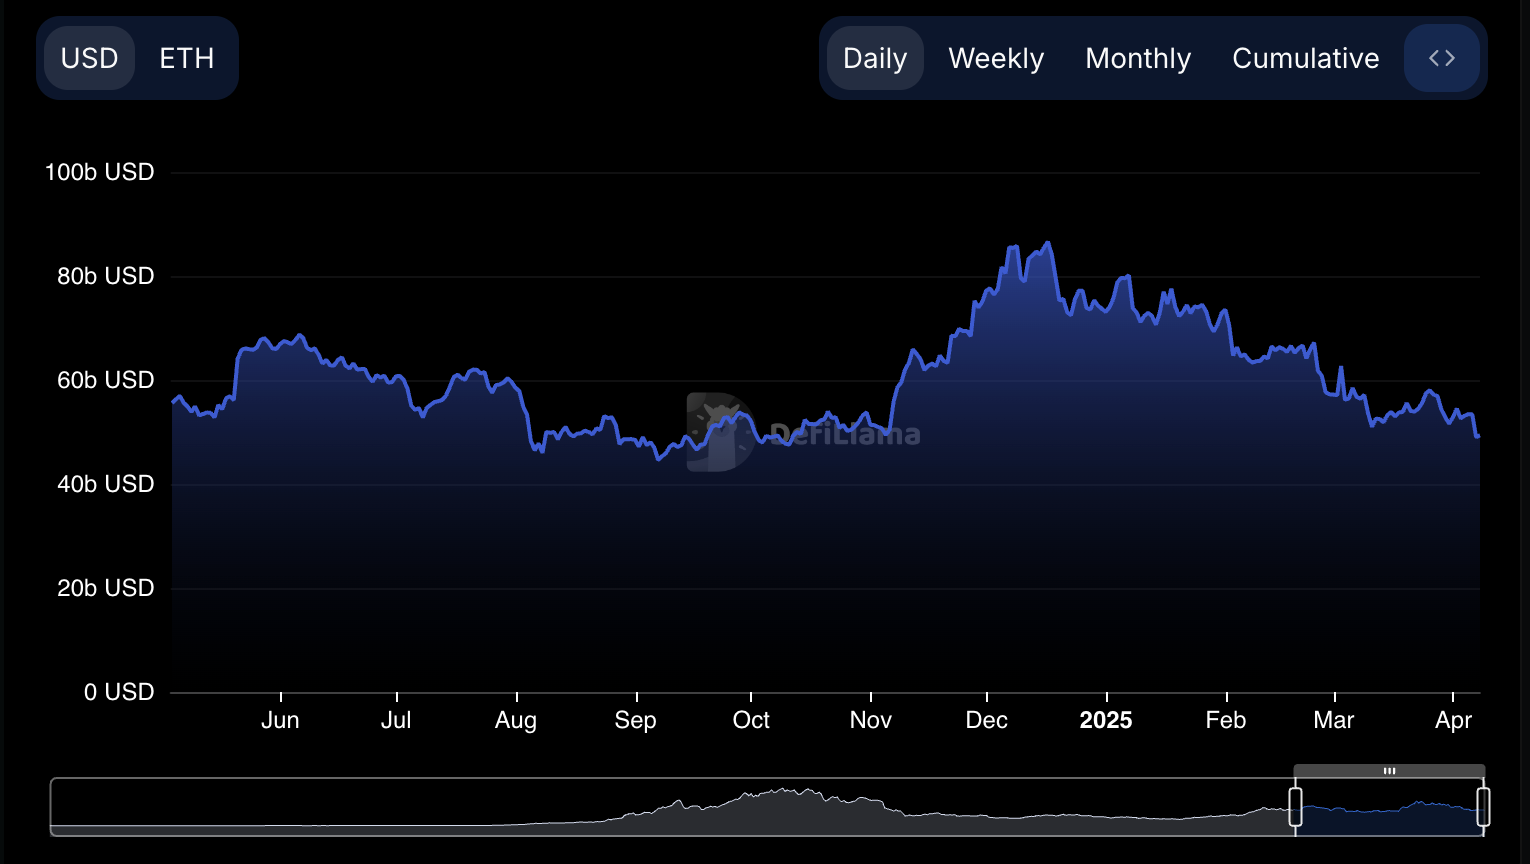
Ethereum TVL Is Down 43% Since December
Ethereum’s total value locked (TVL) has been in sharp decline since peaking at $86.6 billion in December — its highest level since mid-2022.
As of now, Ethereum’s TVL has dropped to $49.34 billion, marking a steep 43% decrease in just a few months.
This decline highlights waning user activity and capital outflows from Ethereum-based protocols, raising fresh concerns about the network’s short-term momentum.
TVL measures the total capital deposited into decentralized finance (DeFi) protocols on a blockchain and serves as a key indicator of ecosystem health and investor confidence.
A rising TVL generally signals growing trust and usage of DeFi applications, while a falling TVL suggests declining demand and reduced engagement.
Ethereum’s TVL is now hovering at multi-month lows, which could be a bearish signal for ETH’s price. This reflects reduced utility and less capital circulating through the network, both of which could put further downward pressure on the asset if the trend continues.
Ethereum Is Currently 70% Down From Its All-Time High
Ethereum’s price has been trading below $2,000 since March 26, and its technical indicators don’t look promising.
The current setup of its Exponential Moving Averages (EMAs) shows a bearish formation, with short-term EMAs positioned below the longer-term ones — a classic signal of ongoing downside momentum.
This suggests that sellers are still in control, and the market could be bracing for further correction.
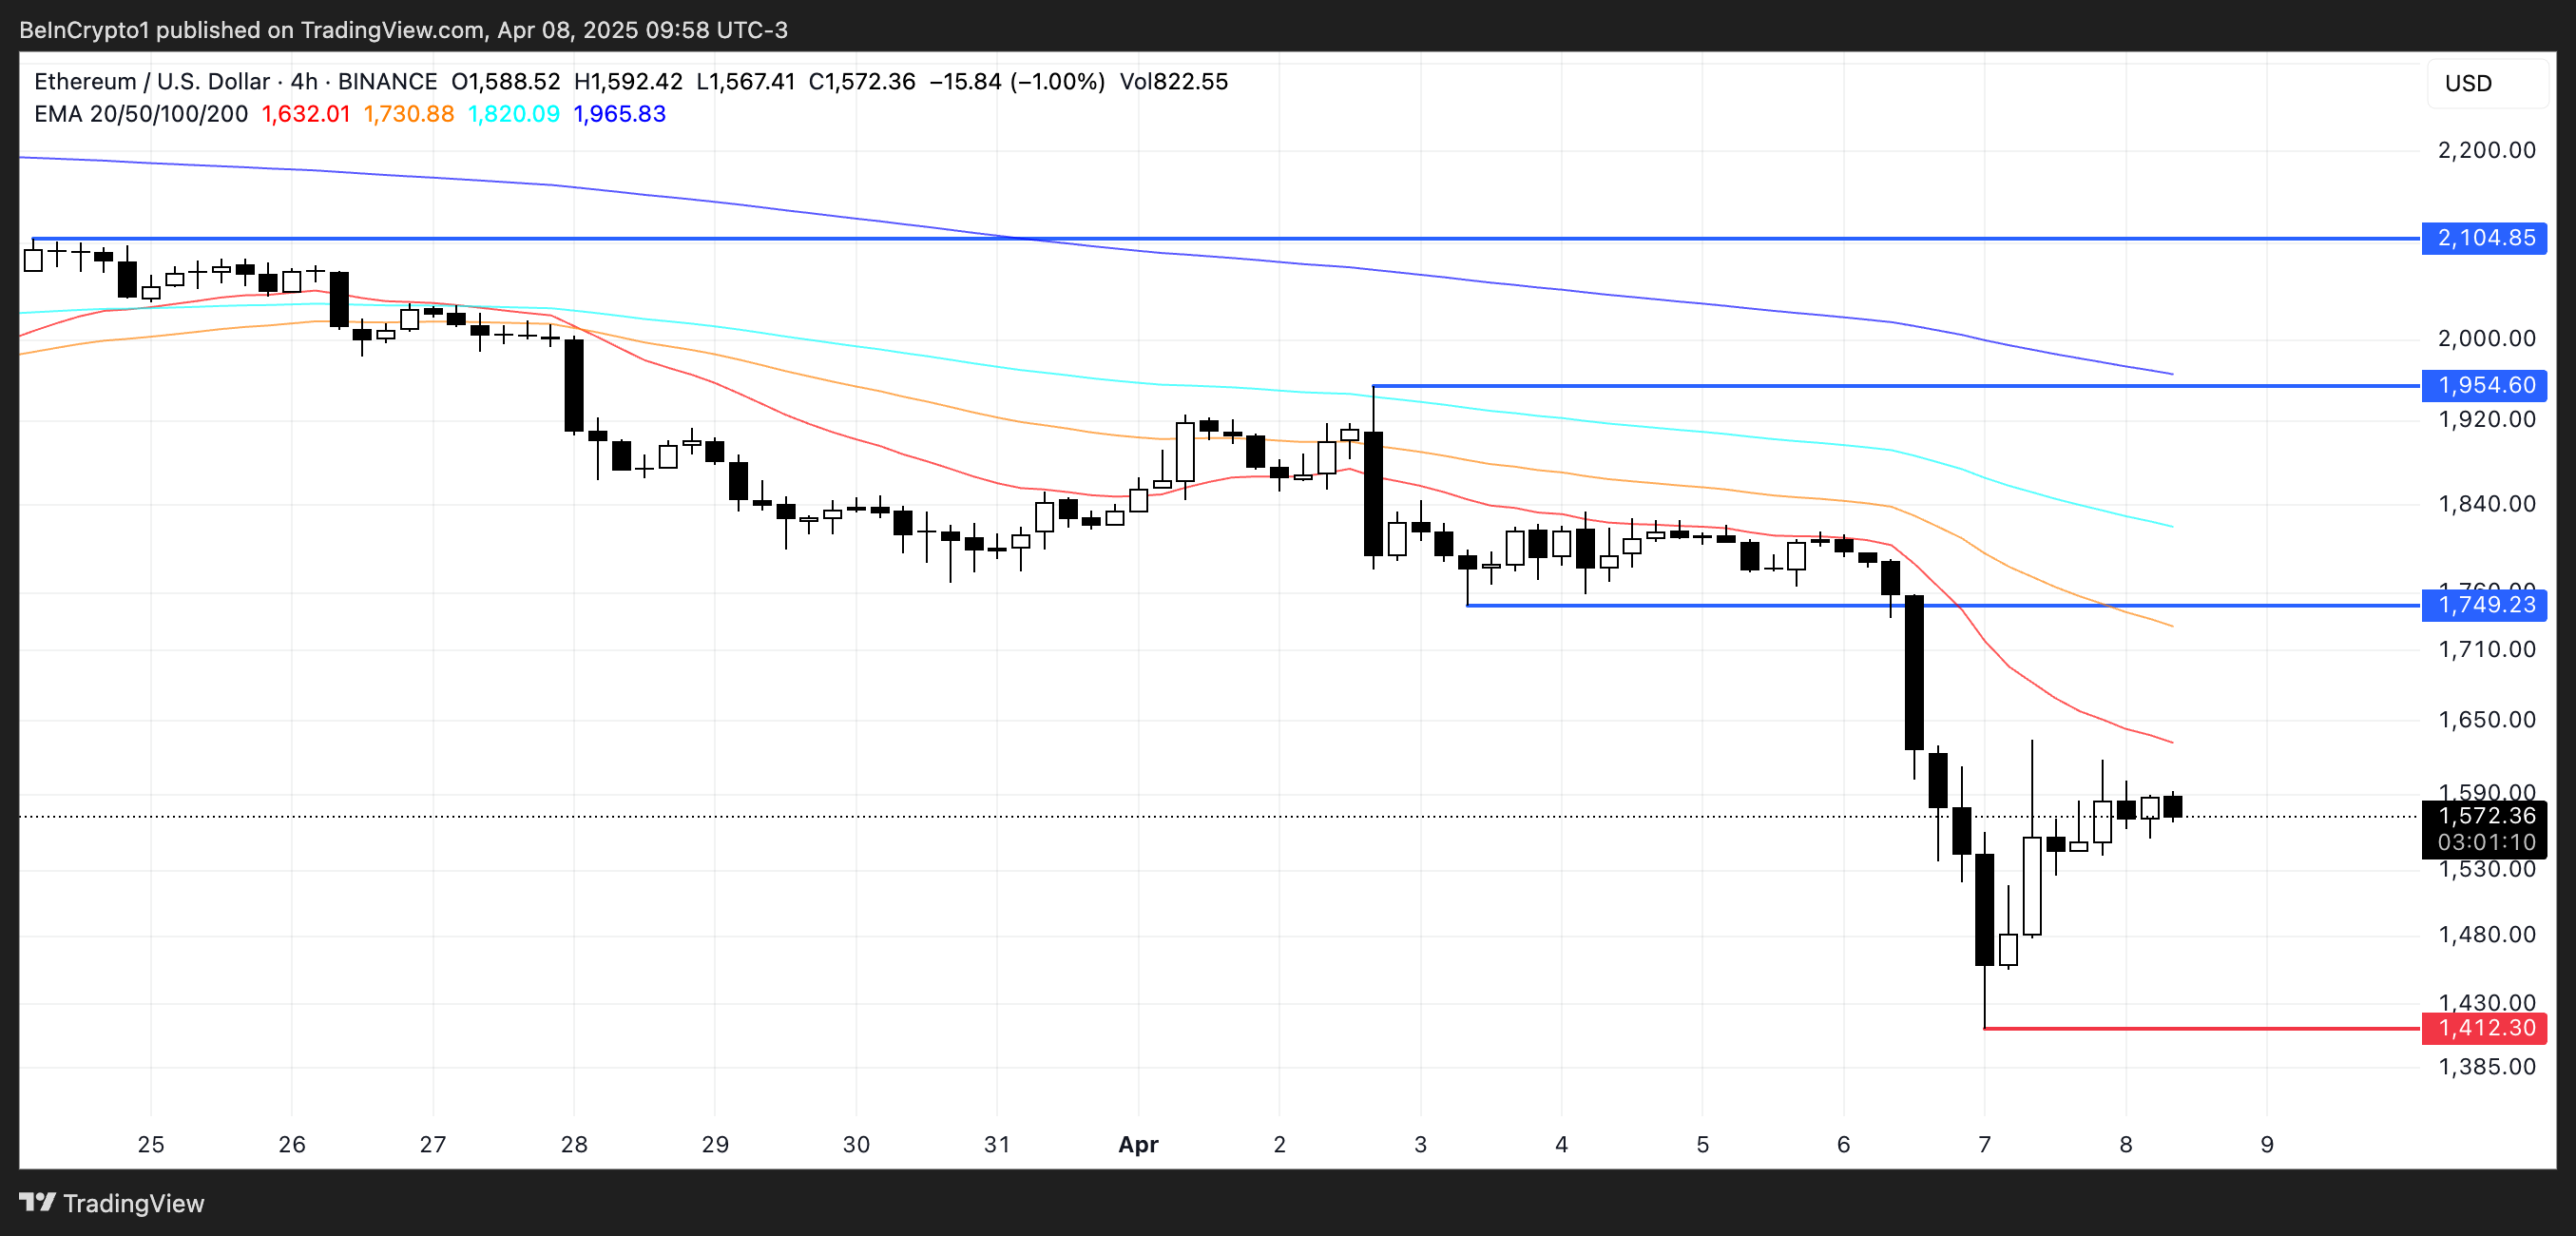
If bearish momentum continues, Ethereum may retest support near $1,400. A breakdown below that level could trigger a deeper sell-off, with Ethereum price potentially sliding toward $1,000 in April — a key psychological and historical level.
However, if bulls regain control and reverse the trend, ETH could first challenge resistance at $1,749.
A breakout above that would open the door for a test of $1,954, and if momentum stays strong, Ethereum could push past the $2,000 barrier and aim for $2,104.
Disclaimer
In line with the Trust Project guidelines, this price analysis article is for informational purposes only and should not be considered financial or investment advice. BeInCrypto is committed to accurate, unbiased reporting, but market conditions are subject to change without notice. Always conduct your own research and consult with a professional before making any financial decisions. Please note that our Terms and Conditions, Privacy Policy, and Disclaimers have been updated.

Solana has posted a 7% increase in the past 24 hours, aligning with the broader market’s recovery. While this surge may appear promising, technical and on-chain data suggest that the coin could face significant resistance.
Despite the recent rally, SOL risks shedding these gains and could fall below the $100 mark if bearish pressures dominate.
Solana’s Price Surge Lacks Momentum
While impressive, SOL’s current rally largely reflects the broader market trend rather than demand for the altcoin. The bearish divergence formed by its Chaikin Money Flow (CMF) shows this.
At press time, SOL’s CMF is below the zero line at -0.09, indicating a lack of buying momentum among SOL market participants.
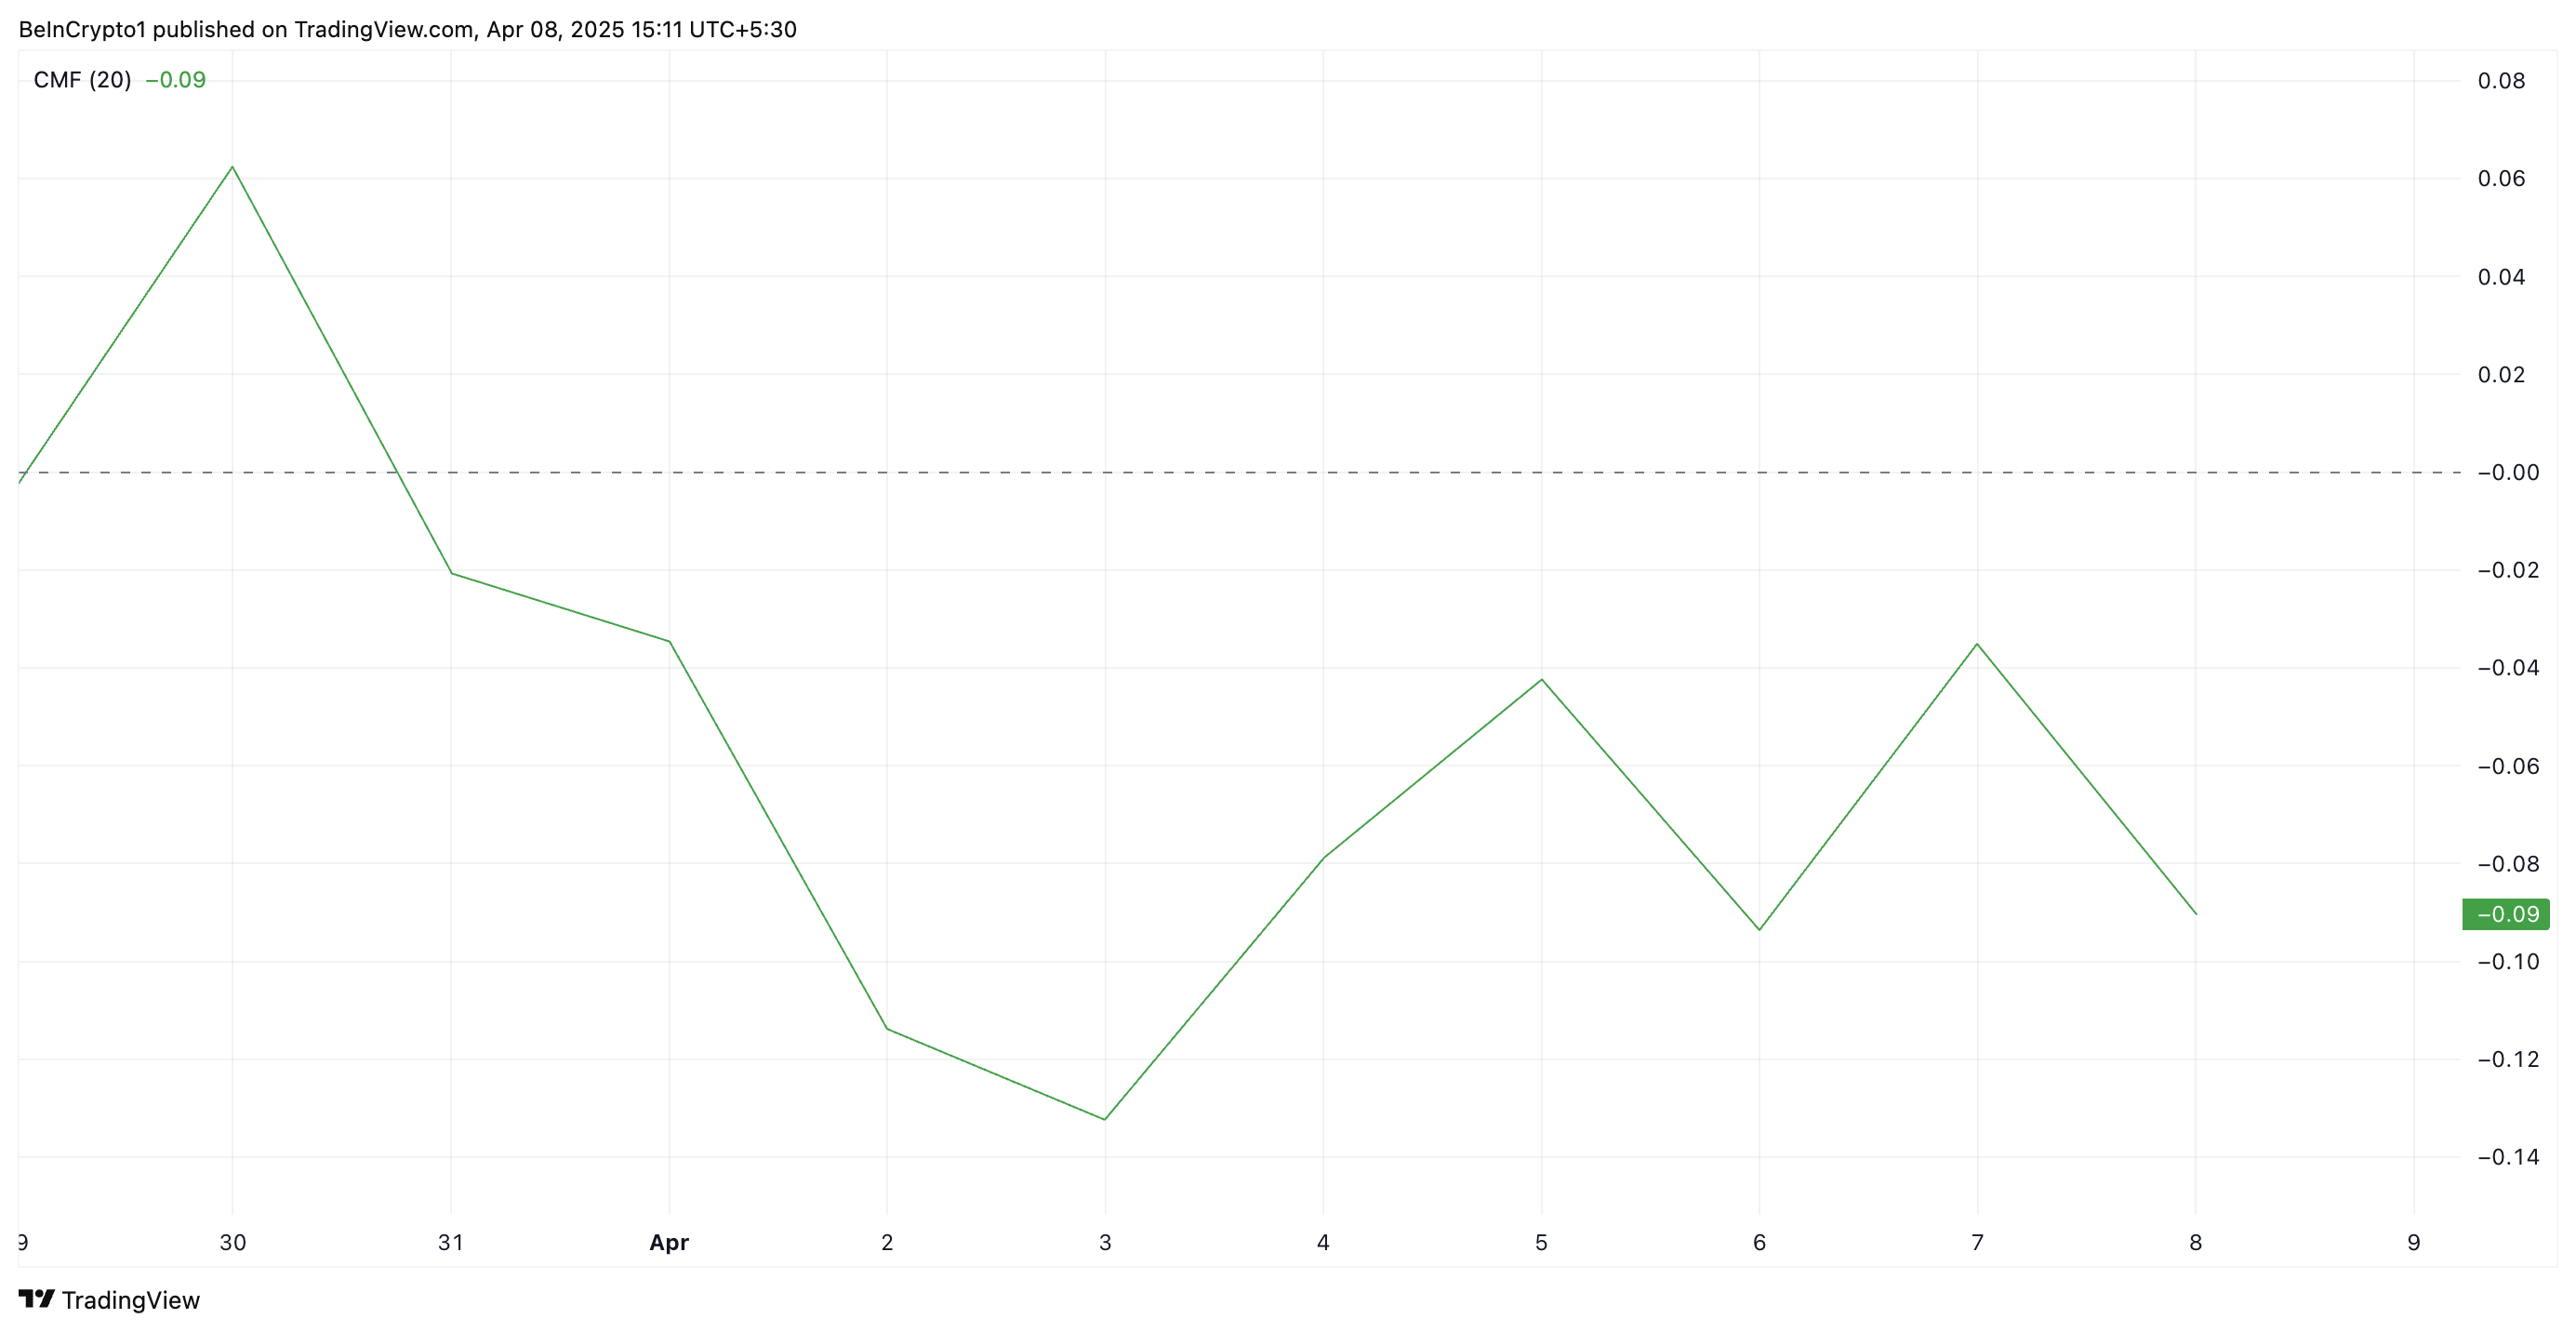
The CMF indicator measures money flow into and out of an asset. A bearish divergence emerges when the CMF is negative while the price is climbing. The divergence signals that despite the upward movement, there is more selling pressure than buying interest, suggesting weak bullish momentum.
This indicates that SOL’s current price rally may lack sustainability and could be at risk of reversing or stalling as new demand remains scarce.
Further, the coin’s long/short ratio highlights that its market participants lean more heavily toward the short side. At press time, this stands at 0.97.
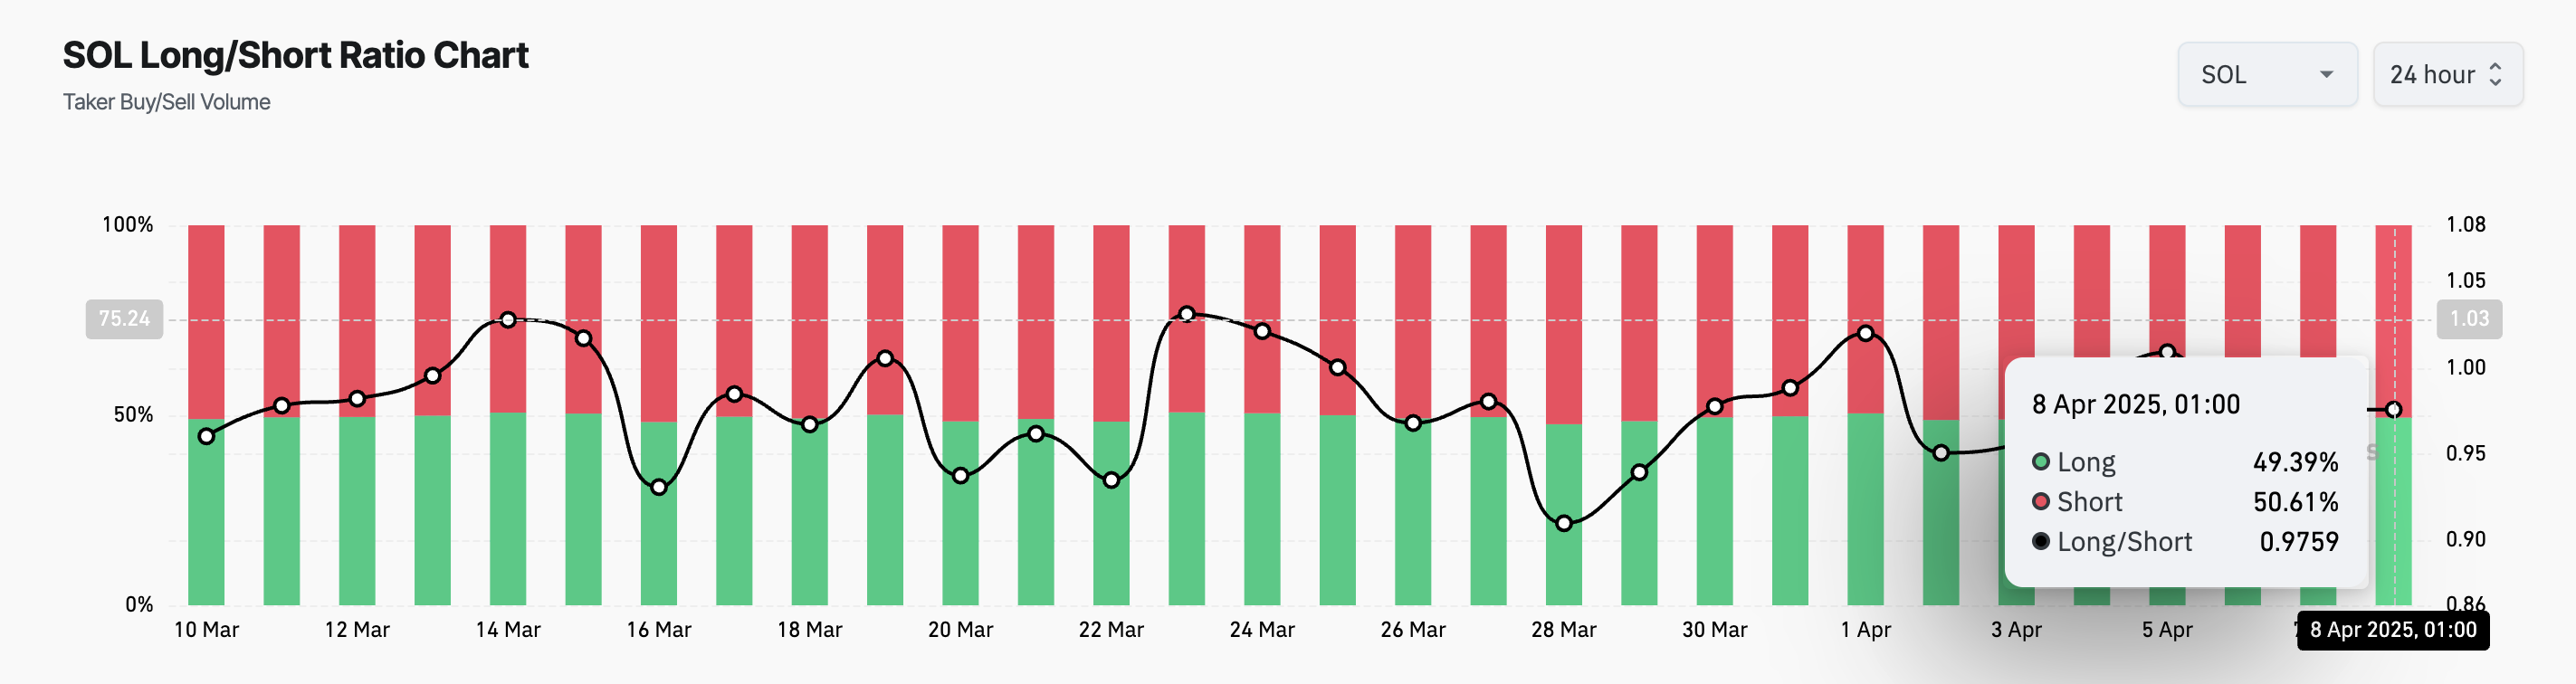
The long/short ratio measures the balance between long positions (betting on price increases) and short positions (betting on price decreases) in the market. When the ratio is below zero like this, it indicates that there are more short positions than long positions.
This suggests that bearish sentiment remains dominant in the SOL market, and its futures traders are anticipating a decline in the asset’s price.
Solana in Crucial Zone: Will $95 Hold or Lead to a Steeper Decline?
During Monday’s intraday trading session, SOL plummeted to a 12-month low of $95.26. Although it has since rebounded to trade at $108.77 at press time, the lingering bearish bias leaves the coin at risk of shedding these gains.
If SOL witnesses a pullback, it could break below the support at $107.88. If it falls back below $100, the coin’s price could fall toward $79.
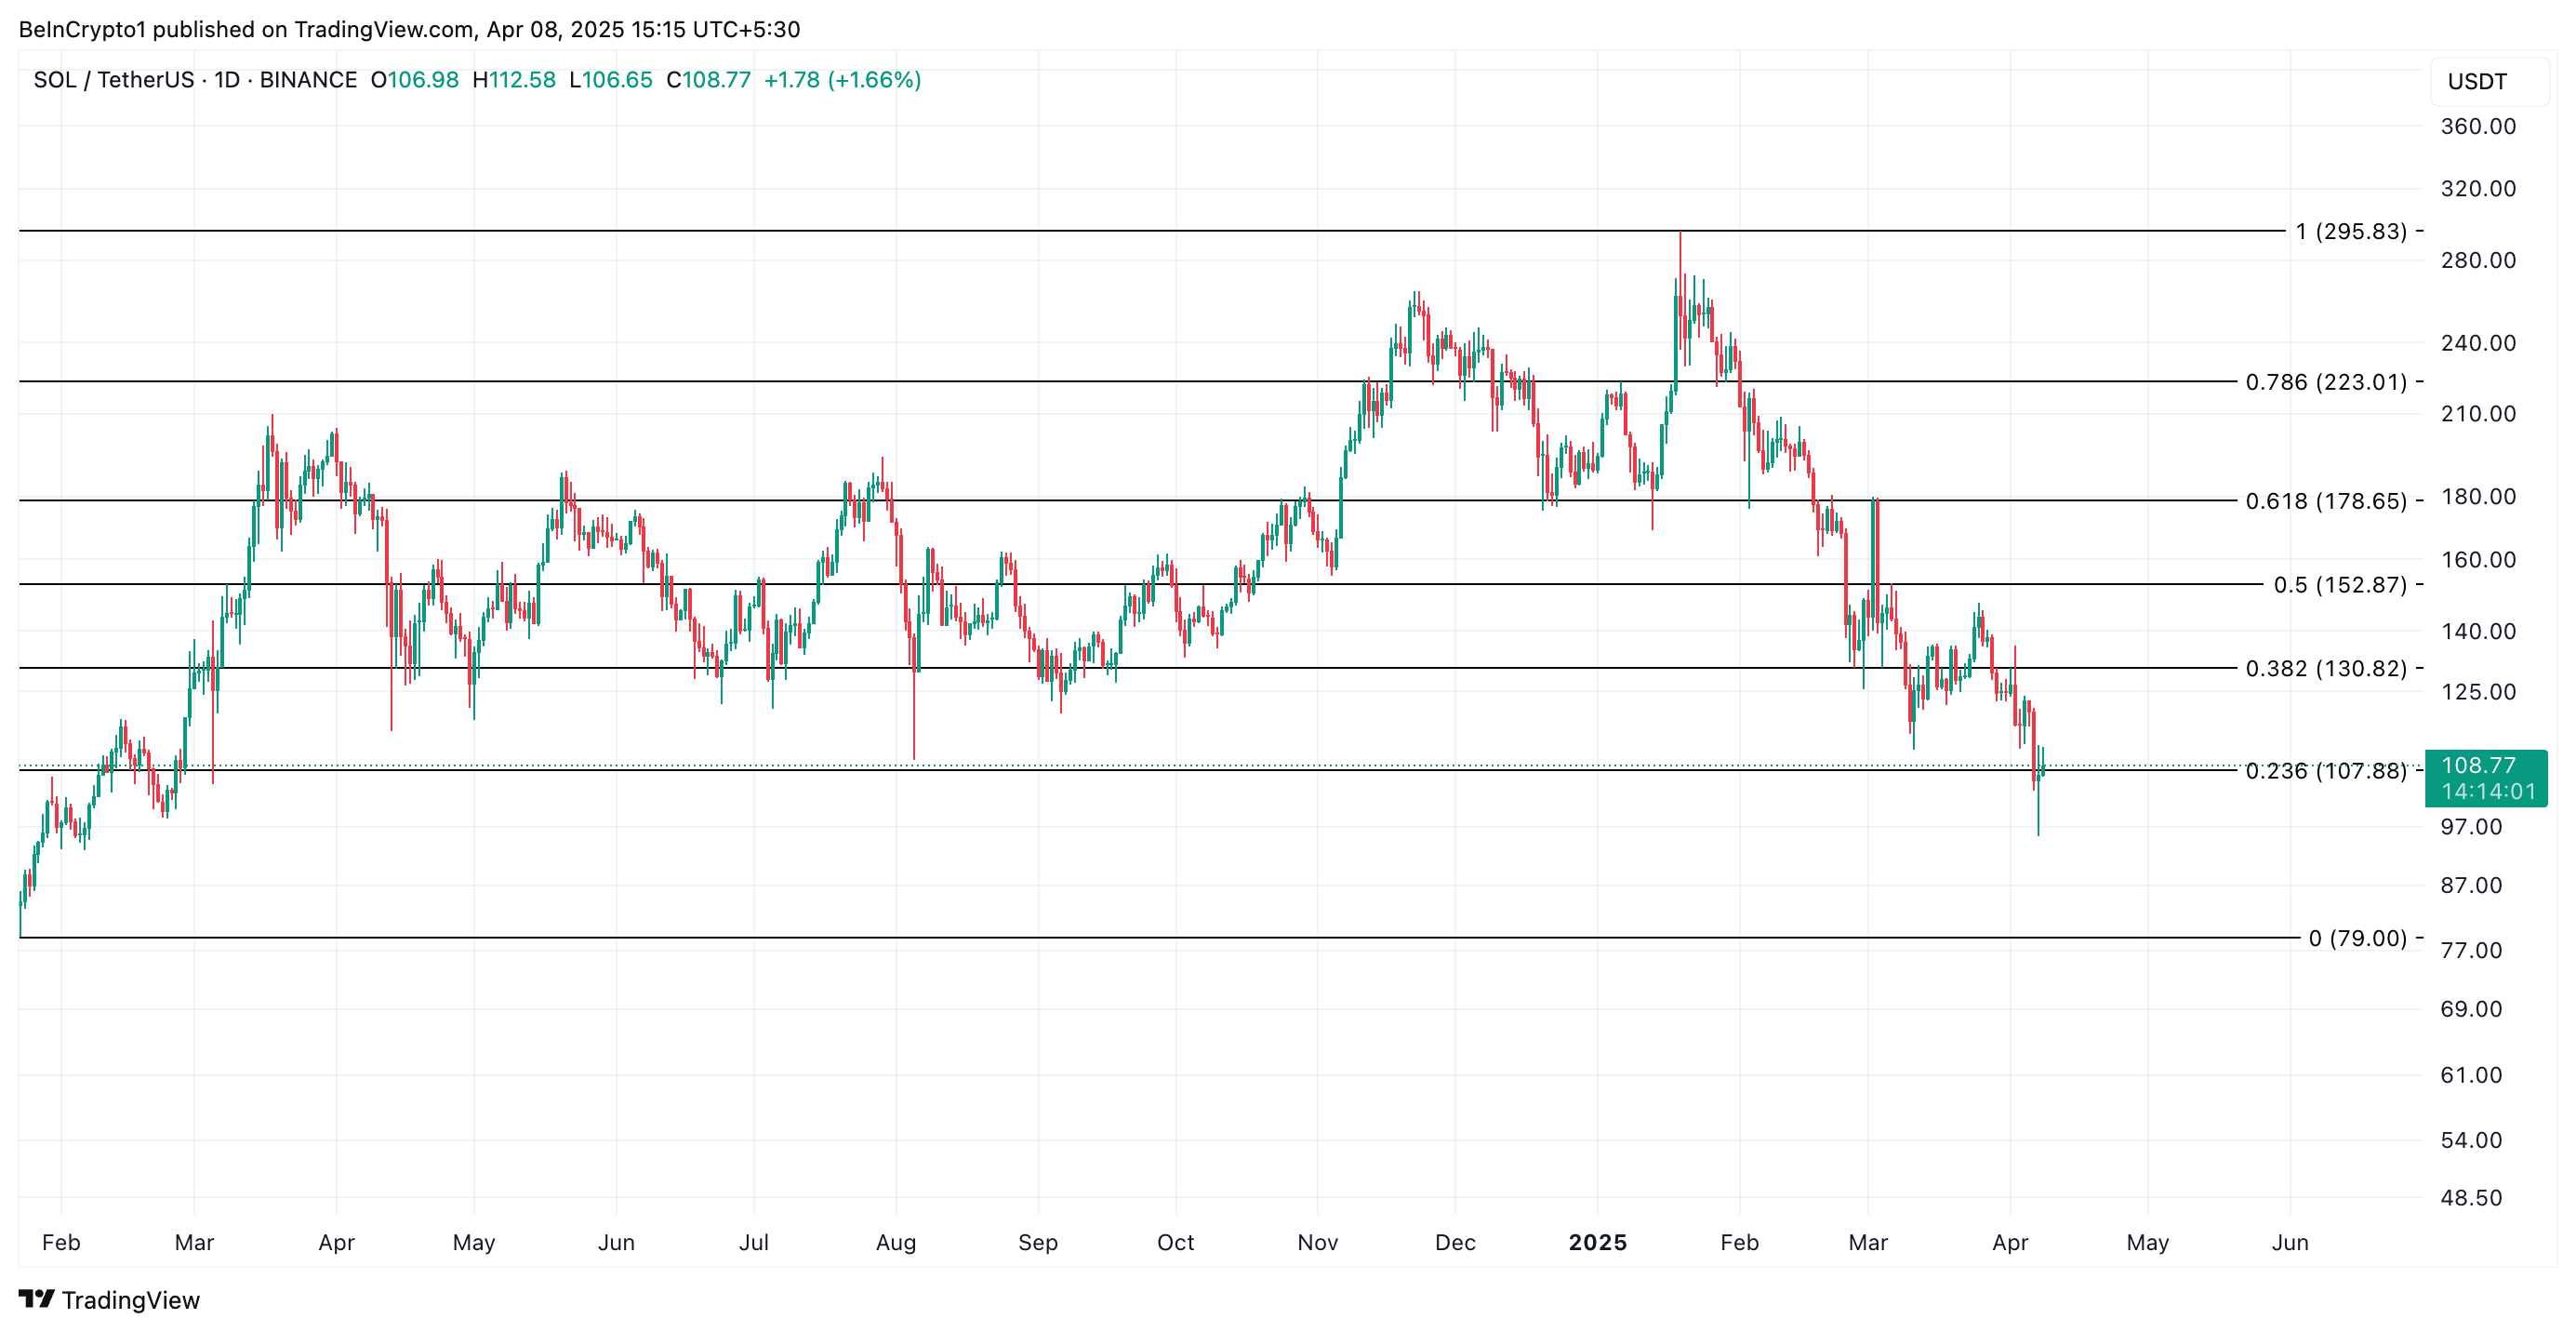
On the other hand, if the uptrend continues, backed by a surge in new demand, SOL’s price could breach the resistance at $111.06 and climb toward $130.82.
Disclaimer
In line with the Trust Project guidelines, this price analysis article is for informational purposes only and should not be considered financial or investment advice. BeInCrypto is committed to accurate, unbiased reporting, but market conditions are subject to change without notice. Always conduct your own research and consult with a professional before making any financial decisions. Please note that our Terms and Conditions, Privacy Policy, and Disclaimers have been updated.
Crypto and TradFi markets had a strong opening today, as Bitcoin briefly jumped 5% due to optimism about a tariff deal. China and institutional investors in the US wish to avoid a trade war if possible.
Despite these encouraging signs, no deal has actually been reached, and Bitcoin also suffered subsequent losses. The whole market is in a state of flux until the situation becomes more clear.
How Will Bitcoin Perform Under Tariffs?
The crypto markets are full of fear right now, and it’s difficult to determine a safe bet moving forward. Since the market suffered huge liquidations yesterday, it opened with cautious optimism today.
This trend was particularly influenced by Bitcoin, which briefly jumped around 5% due to hopes about a potential deal on Trump’s tariffs.
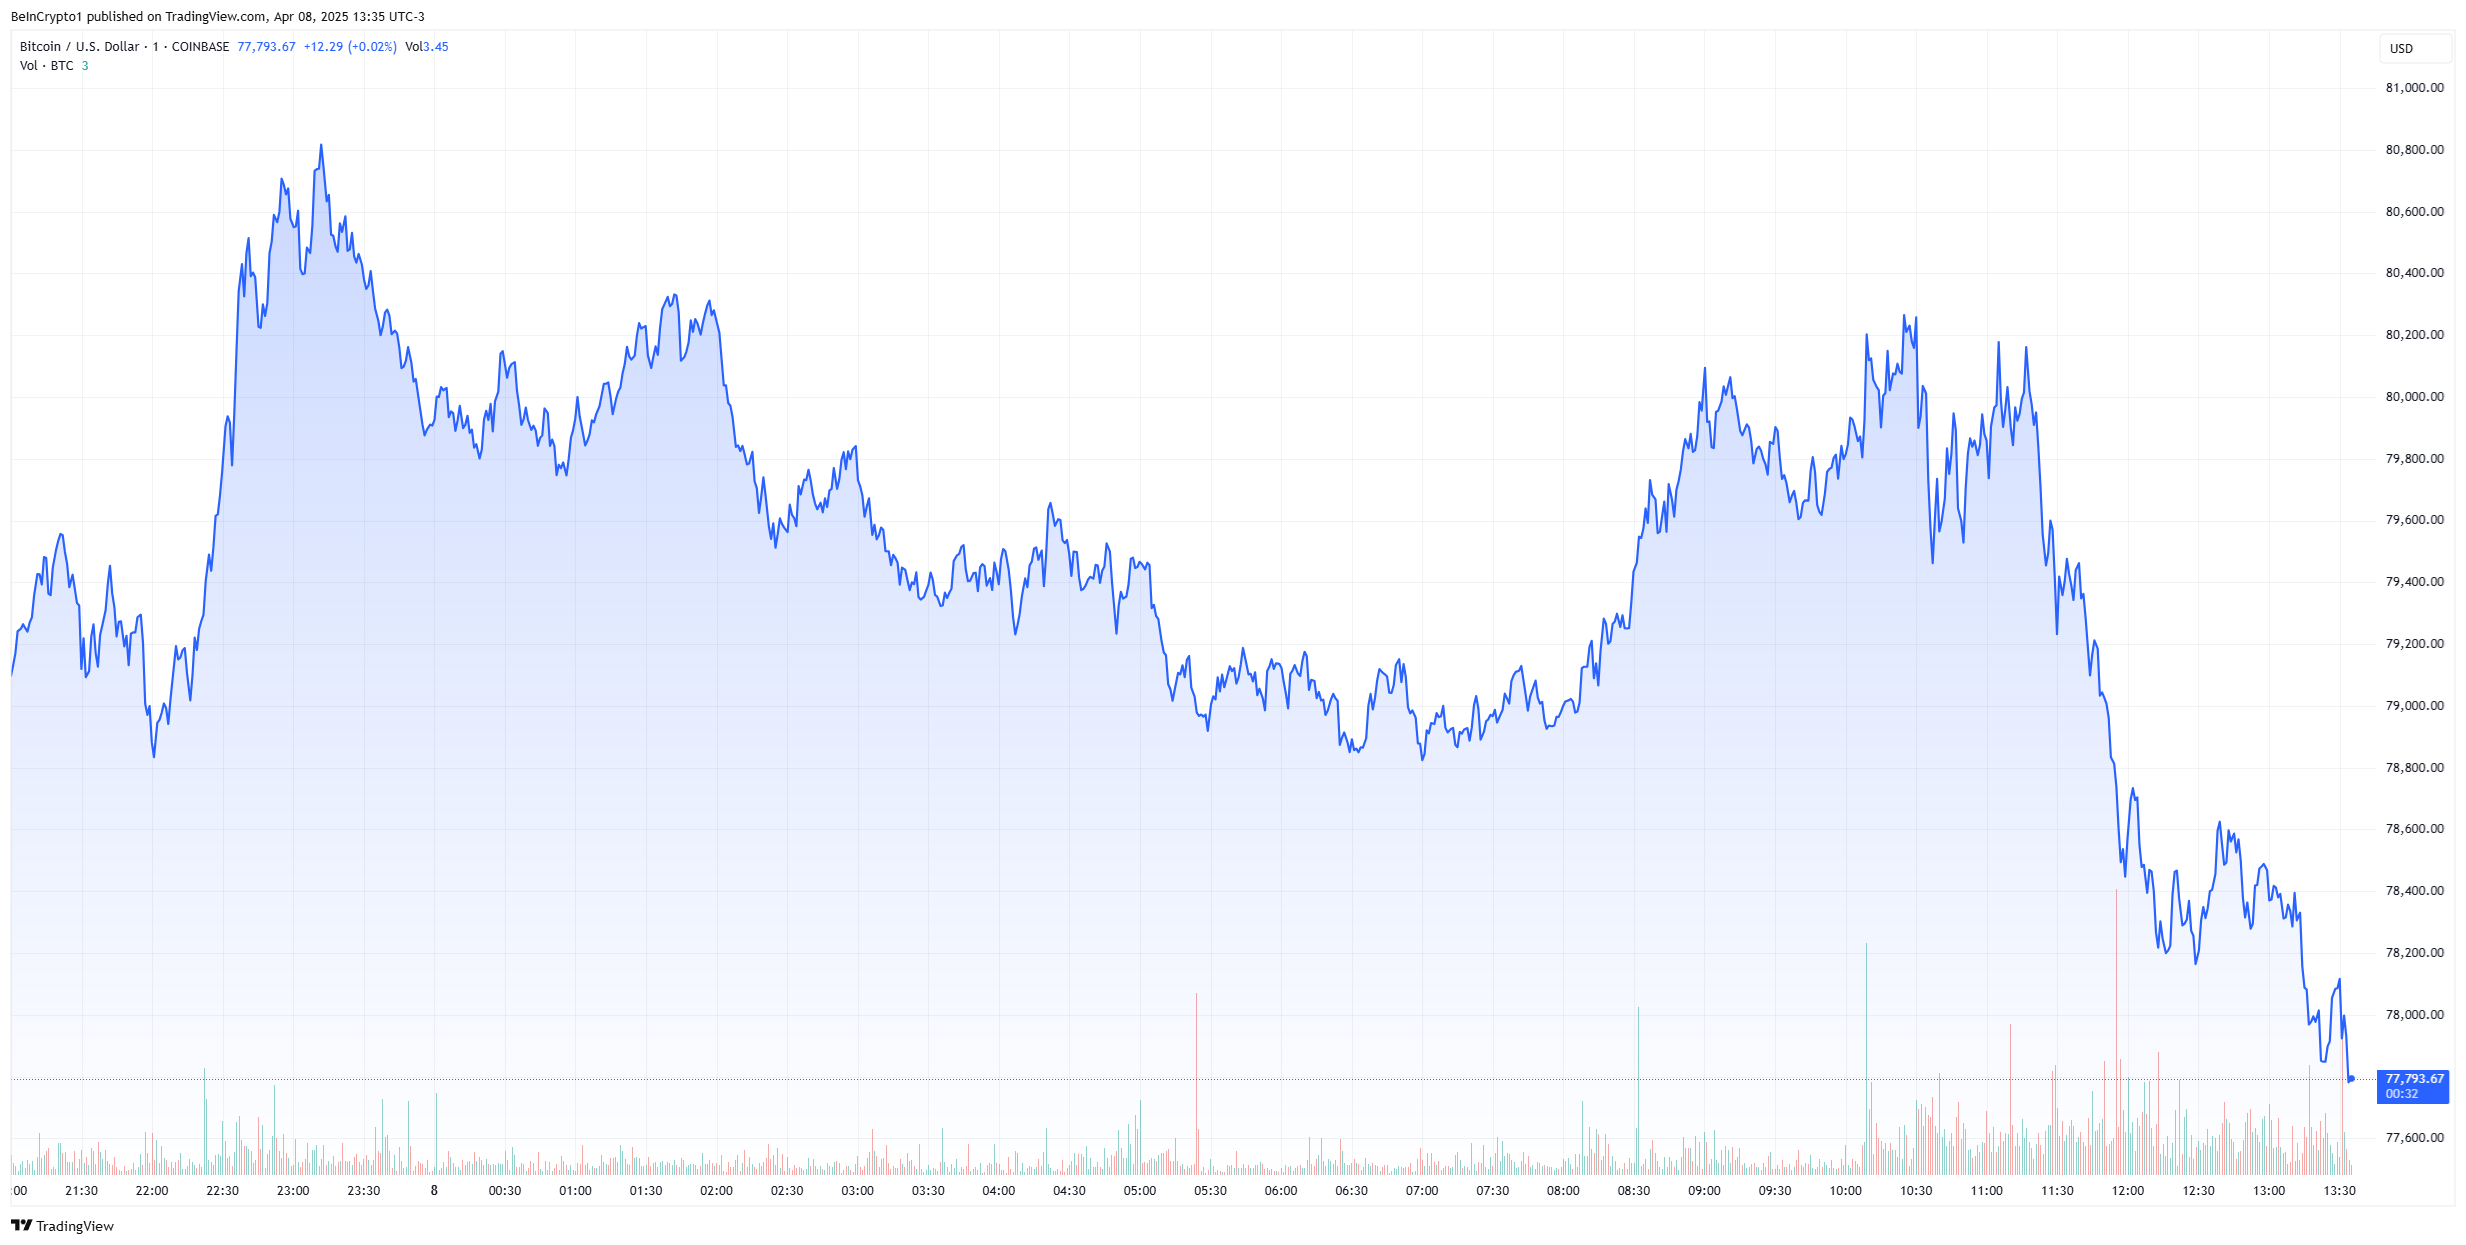
The price of Bitcoin has fluctuated wildly due to the tariffs as speculation about a sell-off increases. However, the whole market is in a chaotic state right now.
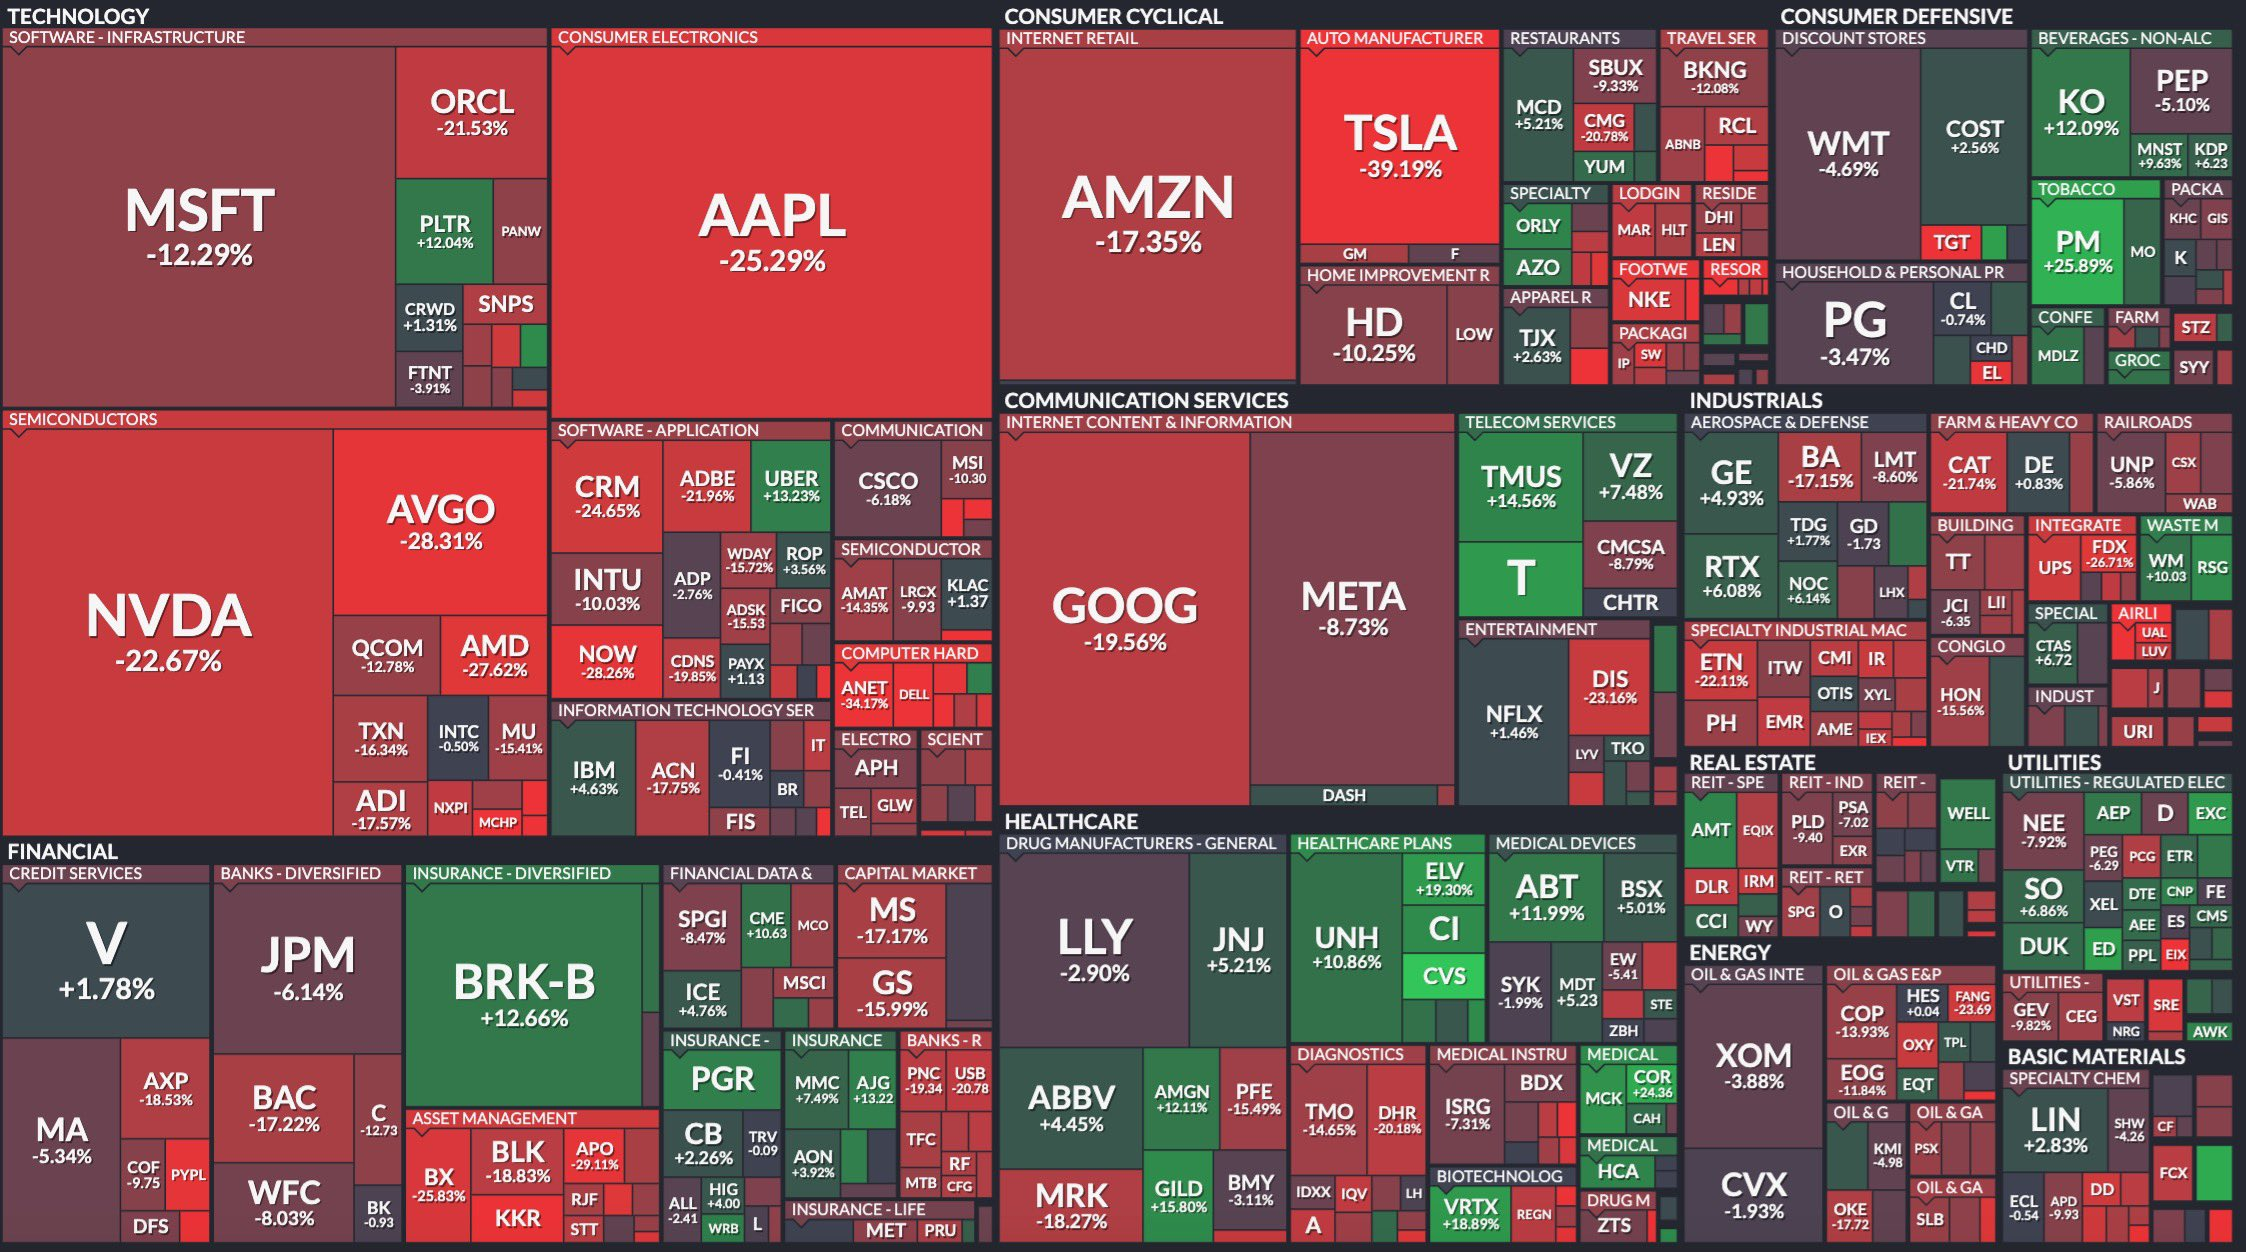
Today, the Dow Jones Industrial Average surged 1,285 points, or 3.4%, while the S&P 500 and Nasdaq Composite both jumped 3.4% and 3.3%, respectively. Nonetheless, hundreds of stocks have fallen 20% or more.
Meanwhile, Bitcoin has a few advantages that can protect it from tariff volatility. For example, a recent report from Binance Research claims that the least risky cryptoassets are the most insulated from drops.
This includes RWAs and centralized exchanges, but Bitcoin is a close third.
Furthermore, the markets are very optimistic about a deal to avoid the tariffs. Yesterday, rumors of a pause triggered a trillion-dollar rally, highlighting traders’ desperation for good news.
Despite the retaliatory tariffs, China is similarly eager to avoid a full-blown trade war with the US. Trump claimed that he is making progress with China and South Korea, fueling optimism.
Nonetheless, it’s important not to overstate Bitcoin’s chances of success under tariffs. Despite the hopes on both sides of the Pacific, China confirmed that it’s prepared to fight a trade war if Trump forces its hand.
This might explain Bitcoin’s price drops despite its strong performance since yesterday. Ultimately, all we can do is wait and hope.
Disclaimer
In adherence to the Trust Project guidelines, BeInCrypto is committed to unbiased, transparent reporting. This news article aims to provide accurate, timely information. However, readers are advised to verify facts independently and consult with a professional before making any decisions based on this content. Please note that our Terms and Conditions, Privacy Policy, and Disclaimers have been updated.

Is Ethereum Falling to $1,000 This April?

Solana Price Rally Faces Risk as Bearish Momentum Builds

Bitcoin Briefly Recovers 5% Due To US-China Tariff Deal Optimism

Developer Advocates For Pi Network Community To Launch Liquidity Pool To Stablilize Pi Coin Price

Ripple Announces $1.25B Acquisition Of Hidden Road To Set Major Milestone

XCN Price’s Month-Long Bearishness Meets Whale Conviction


-

 Market22 hours ago
XRP Targets Rebound After Hitting Oversold Territory
-

 Market23 hours ago
Can the Fed Rescue Crypto Markets With Interest Rate Cuts?
-

 Market21 hours ago
3 Altcoins to Watch in the Second Week of April 2025
-
 Altcoin19 hours ago
Programmer Reveals Reason To Be Bullish On Pi Network Despite Pi Coin Price Crash
-
 Market20 hours ago
WEEX Lists AB (AB) under the RWA and Blockchain Infrastructure Category
-

 Market19 hours ago
Crypto Pundit Reveals What Will Happen If XRP Price Does Not Break $2.3
-

 Altcoin18 hours ago
Solana’s Fartcoin Jumps 20% Despite Market Selloff
-

 Market15 hours ago
Ethereum Price Rebound Stalls—Can It Reclaim the Lost Support?
 Arabic
 Chinese (Simplified)
 Dutch
Dutch English
 French
 German
 Italian
 Portuguese
 Russian
 Spanish
 Vietnamese