Market
Is The XRP Price Mirroring Bitcoin’s Macro Action? Analyst Maps Out How It Could Get To $71

Reason to trust
![]()

Strict editorial policy that focuses on accuracy, relevance, and impartiality
Created by industry experts and meticulously reviewed
The highest standards in reporting and publishing
Strict editorial policy that focuses on accuracy, relevance, and impartiality
Morbi pretium leo et nisl aliquam mollis. Quisque arcu lorem, ultricies quis pellentesque nec, ullamcorper eu odio.
A crypto analyst has presented a compelling case, suggesting that the XRP price may be closely mirroring Bitcoin’s historical macro action. By comparing its multi-year chart patterns and market behaviour, the analyst argues that XRP may be gearing up for a significant price rally to $71 and beyond.
XRP Price Traces Bitcoin Path To Reach $71
TradingView crypto analyst RizeSenpai has forecasted that XRP could surge explosively to $71. At its current market price, this would represent a staggering 3,281% increase.
Related Reading
The TradingView expert conducted a detailed comparative analysis, drawing striking similarities between Bitcoin’s breakout from its multi-year accumulation range in 2015-2017 and XRP’s current price structure. He points out that XRP’s movements since it was listed on Poloniex in 2014 have closely mirrored Bitcoin’s macro price action but at a slower rate, estimated at 65%.
For emphasis, the price chart shows that Bitcoin experienced a sharp surge of 5,424% after consolidating between 2013 and 2016 and finally breaking out in 2017. Similarly, XRP had a big rise in 2017 but has since been stuck trading within a large multi-year range for nearly six years as of the end of 2022.

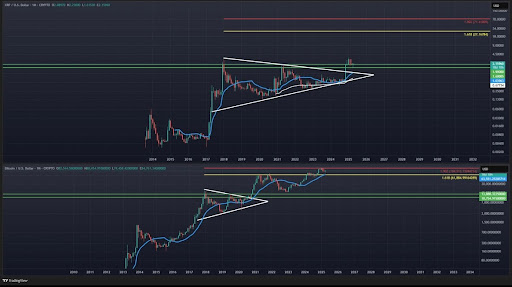
Recently, XRP broke out of its long-term price range and has been consolidating above its old all-time high resistance for several months. Considering its current price action, the analyst assumes that the asset may be attempting to move toward new breakout levels.
The TradingView analyst has highlighted the potential for XRP to surge toward a more realistic target of $27 – $30, near the 1.618 Fibonacci Extension level. For reference, he shared a chart comparing Bitcoin’s past bull market breakout and performance with XRP’s current breakout and future price action.
The chart reveals that when BTC broke out, it surged toward the 1.618 Fibonacci level at $61,800 before initiating a secondary run that topped at the 1.902 HOP level. As a result, RizeSenpai predicts that if XRP can completely mirror Bitcoin’s performance, it could skyrocket to $27, potentially reaching as high as $71, where the 1.902 HOP level lies.
The Token To Surge Above $71 To $120
As mentioned earlier, XRP is still trading within a multi-year range breakout similar to Bitcoin’s in its past cycle. As of writing, XRP’s price sits at $2.13, having declined by more than 11% over the last month.
Related Reading
Notably, if the altcoin replicates the breakout momentum previously seen in Bitcoin, RizeSenpai predicts an explosive 5,400% increase, pushing its price to a very ambitious target of $120.94. This suggests that the TradingView analyst believes that XRP could exceed its previously projected target of $71 and climb past $120.
Adding to the weight of this bullish forecast is the presence of a monthly Moving Average Convergence Divergence (MACD) Hidden Bullish Divergence. This technical indicator is often associated with an uptrend continuation and potential upside momentum.

Featured image from Adobe Stock, chart from Tradingview.com