Market
Is Support Level at Risk?

Cardano (ADA) may extend its 30-day decline as it appears poised to breach a key support level.
This may happen in the short term as bearish pressure on the tenth-largest cryptocurrency by market capitalization continues to increase.
Cardano Holders Are Booking Losses
ADA trades at $0.43 at press time, logging a 6.5% price decline in the last month. Although this price decline mirrors the downtrend in the general market during that period, it has also been due to the steady fall in ADA demand among market participants.
Observed using a 30-day moving average (MA), ADA’s daily active addresses have declined by 25% in the last month.

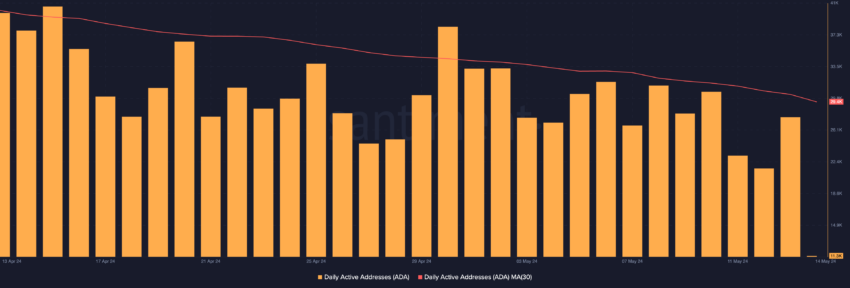
When an asset witnesses a decrease in its daily active address count, it often suggests that fewer unique addresses interact with it daily. This may result from declining interest due to general market sentiment or the asset’s poor performance.
The decline in the coin’s demand in the last month is connected to the low profits yielded by ADA investments during that period.
An assessment of the daily ratio of ADA’s transaction volume in profit to loss (using a 30-day MA) showed its value at press time at 0.87.
Read More: How To Buy Cardano (ADA) and Everything You Need To Know
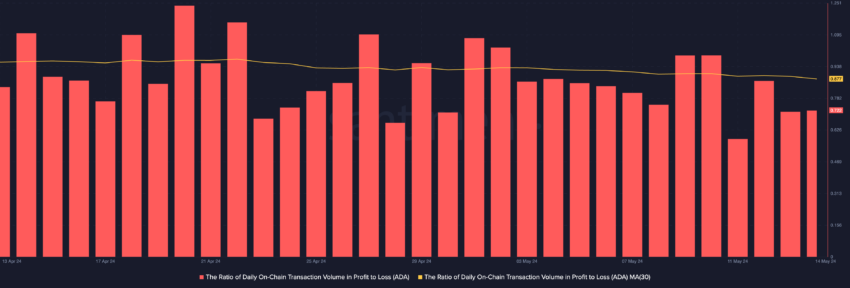
This shows that for every ADA transaction that has ended in a loss in the last month, only 0.87 transactions returned a profit. This means ADA holders have incurred more losses than they have profited in the last 30 days.
ADA Price Prediction: Further Downside on the Horizon
ADA’s price assessed on a 1-day chart revealed the formation of a descending triangle. At press time, ADA trades at $0.43, sitting on the lower trendline, which forms a critical support level.
When an asset’s price is in a downtrend, the formation of a descending triangle signals the continuation of the downward price movement.
ADA’s key momentum indicators also hinted at the possibility of a continued downtrend if sentiment remains bearish. For example, the coin’s Relative Strength Index (RSI) sat below the neutral line of 50.0 when writing, signaling that traders favored token distribution over accumulation.
This indicator measures the speed and change of price movements. It t ranges from 0 to 100, with levels above 70 indicating overbought conditions and below 30 signaling oversold conditions.
If ADA breaks out of the triangle, in a downtrend, and breaches support, its next price point is $0.42. If the bulls cannot curb the decline, it may fall under $0.40 to trade at $0.36.
Read More: Cardano (ADA) Price Prediction 2024/2025/2030

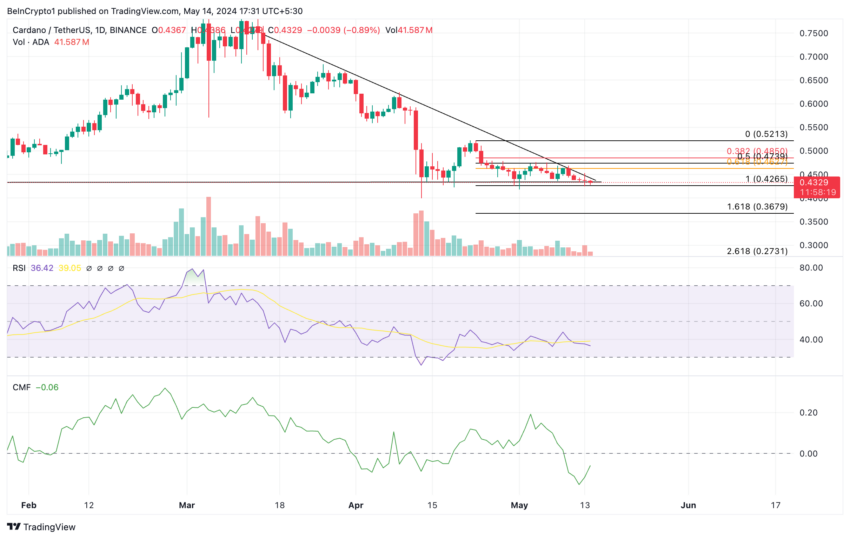
However, if the coin breaks out of the triangle in an uptrend, these projections are invalidated, and ADA’s next price point will be above $0.46.
Disclaimer
In line with the Trust Project guidelines, this price analysis article is for informational purposes only and should not be considered financial or investment advice. BeInCrypto is committed to accurate, unbiased reporting, but market conditions are subject to change without notice. Always conduct your own research and consult with a professional before making any financial decisions. Please note that our Terms and Conditions, Privacy Policy, and Disclaimers have been updated.