
Market
Hyperliquid (HYPE) Hits 3-Month Lows Despite High Revenue

Hyperliquid is one of the most profitable platforms in crypto right now, yet its price has been struggling, dropping over 8% in the last 24 hours and more than 24% in the past seven days. Despite its strong fundamentals, bearish momentum has kept HYPE at its lowest levels since December 2024.
However, the network’s rising revenue has outpaced Solana, Ethereum, and Raydium. This suggests underlying strength that could fuel a rebound if market conditions shift. If HYPE breaks resistance at $14.65, it could trigger a rally toward $20 or even $25.87, but failure to reclaim momentum could send it below $12.
Hyperliquid RSI Has Been Neutral Since March 4
Hyperliquid’s RSI (Relative Strength Index) is currently at 32.59, remaining in neutral territory since March 4. Suspicious high-leverage trades are raising money laundering concerns, leading to the ongoing correction.
The RSI is a momentum oscillator that measures the speed and change of price movements on a scale from 0 to 100, with values above 70 indicating overbought conditions and below 30 signaling oversold conditions.
An RSI between 30 and 50 suggests weak momentum, often aligning with a downtrend or consolidation phase.
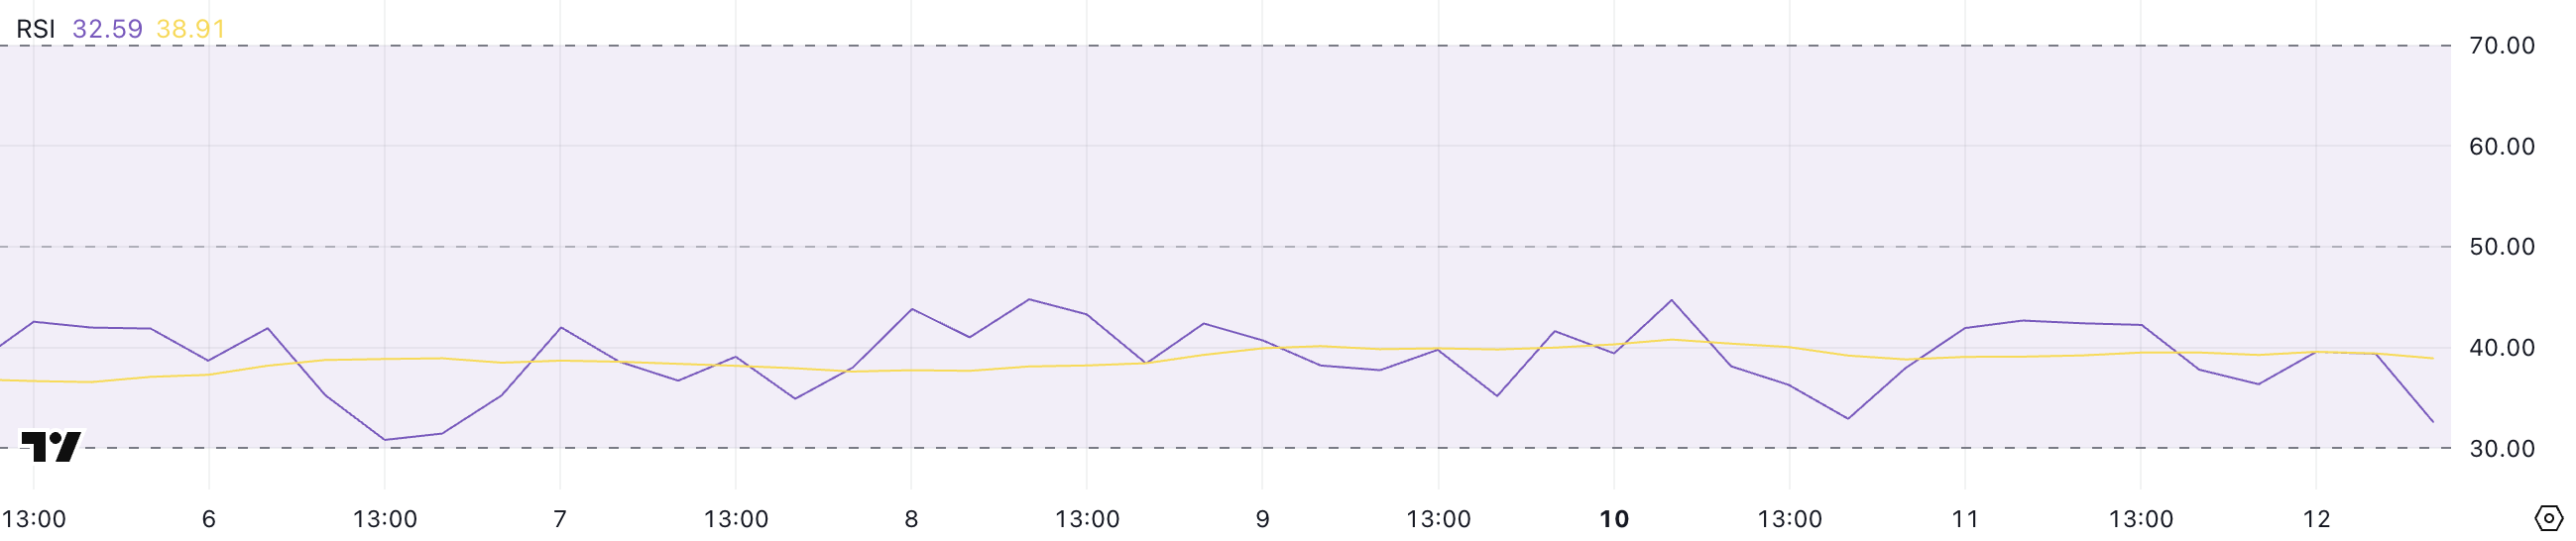
HYPE’s RSI has now stayed below 50 for nine consecutive days, reinforcing the lack of bullish momentum. With the current reading at 32.59, the asset is approaching oversold territory but hasn’t yet reached extreme levels.
This suggests that selling pressure remains dominant, but if RSI turns upward and crosses 50, it could signal the start of a stronger recovery.
Until then, Hyperliquid remains in a weak position, with price action struggling to gain upward traction.
HYPE BBTrend Has Been Negative For One Week
Hyperliquid’s BBTrend is currently at -16.69, remaining negative since March 5 and staying below -10 for the past six days.
BBTrend (Bollinger Band Trend) is an indicator that measures price momentum relative to Bollinger Bands, helping identify bullish or bearish trends.
Values above 10 indicate strong upward momentum, while values below -10 suggest strong downward pressure.
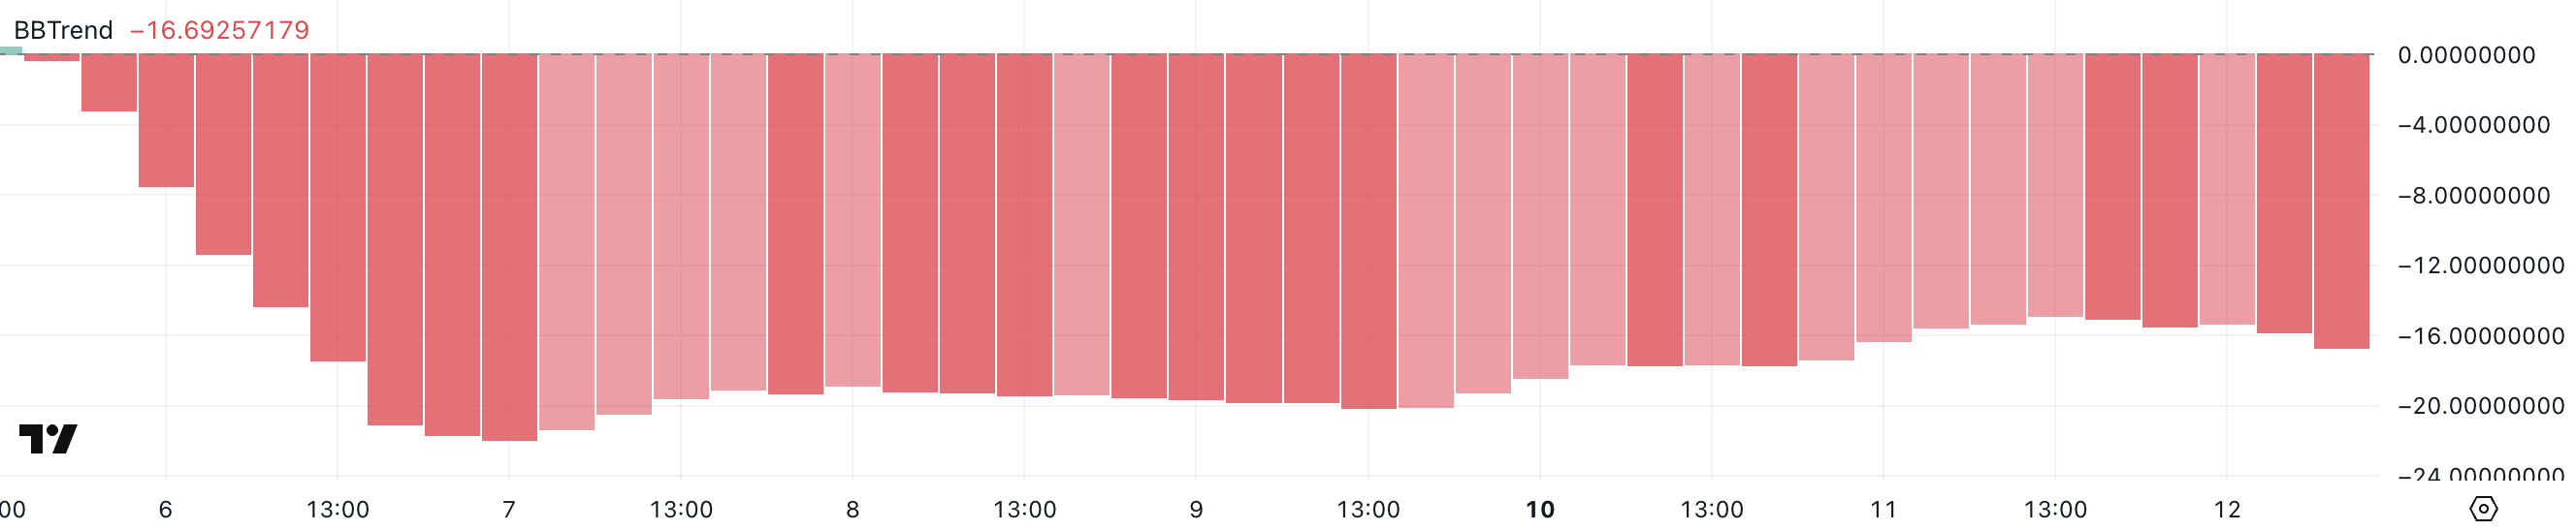
With HYPE BBTrend at -16.69, the bearish trend remains dominant, reinforcing the recent selling pressure.
Staying below -10 for several days suggests that downside momentum has been persistent, limiting any significant recovery attempts.
If the BBTrend starts moving toward 0, it could indicate a weakening downtrend, but for now, Hyperliquid remains in a clearly bearish phase.
Can HYPE Reclaim $20 In March?
Hyperliquid is currently trading at its lowest levels since December 2024, with its EMA lines signaling a strong bearish sentiment.
Short-term EMAs remain well below long-term ones, with large gaps between them indicating strong downside momentum. If the correction continues, HYPE could drop below $12, marking its lowest price in over three months.
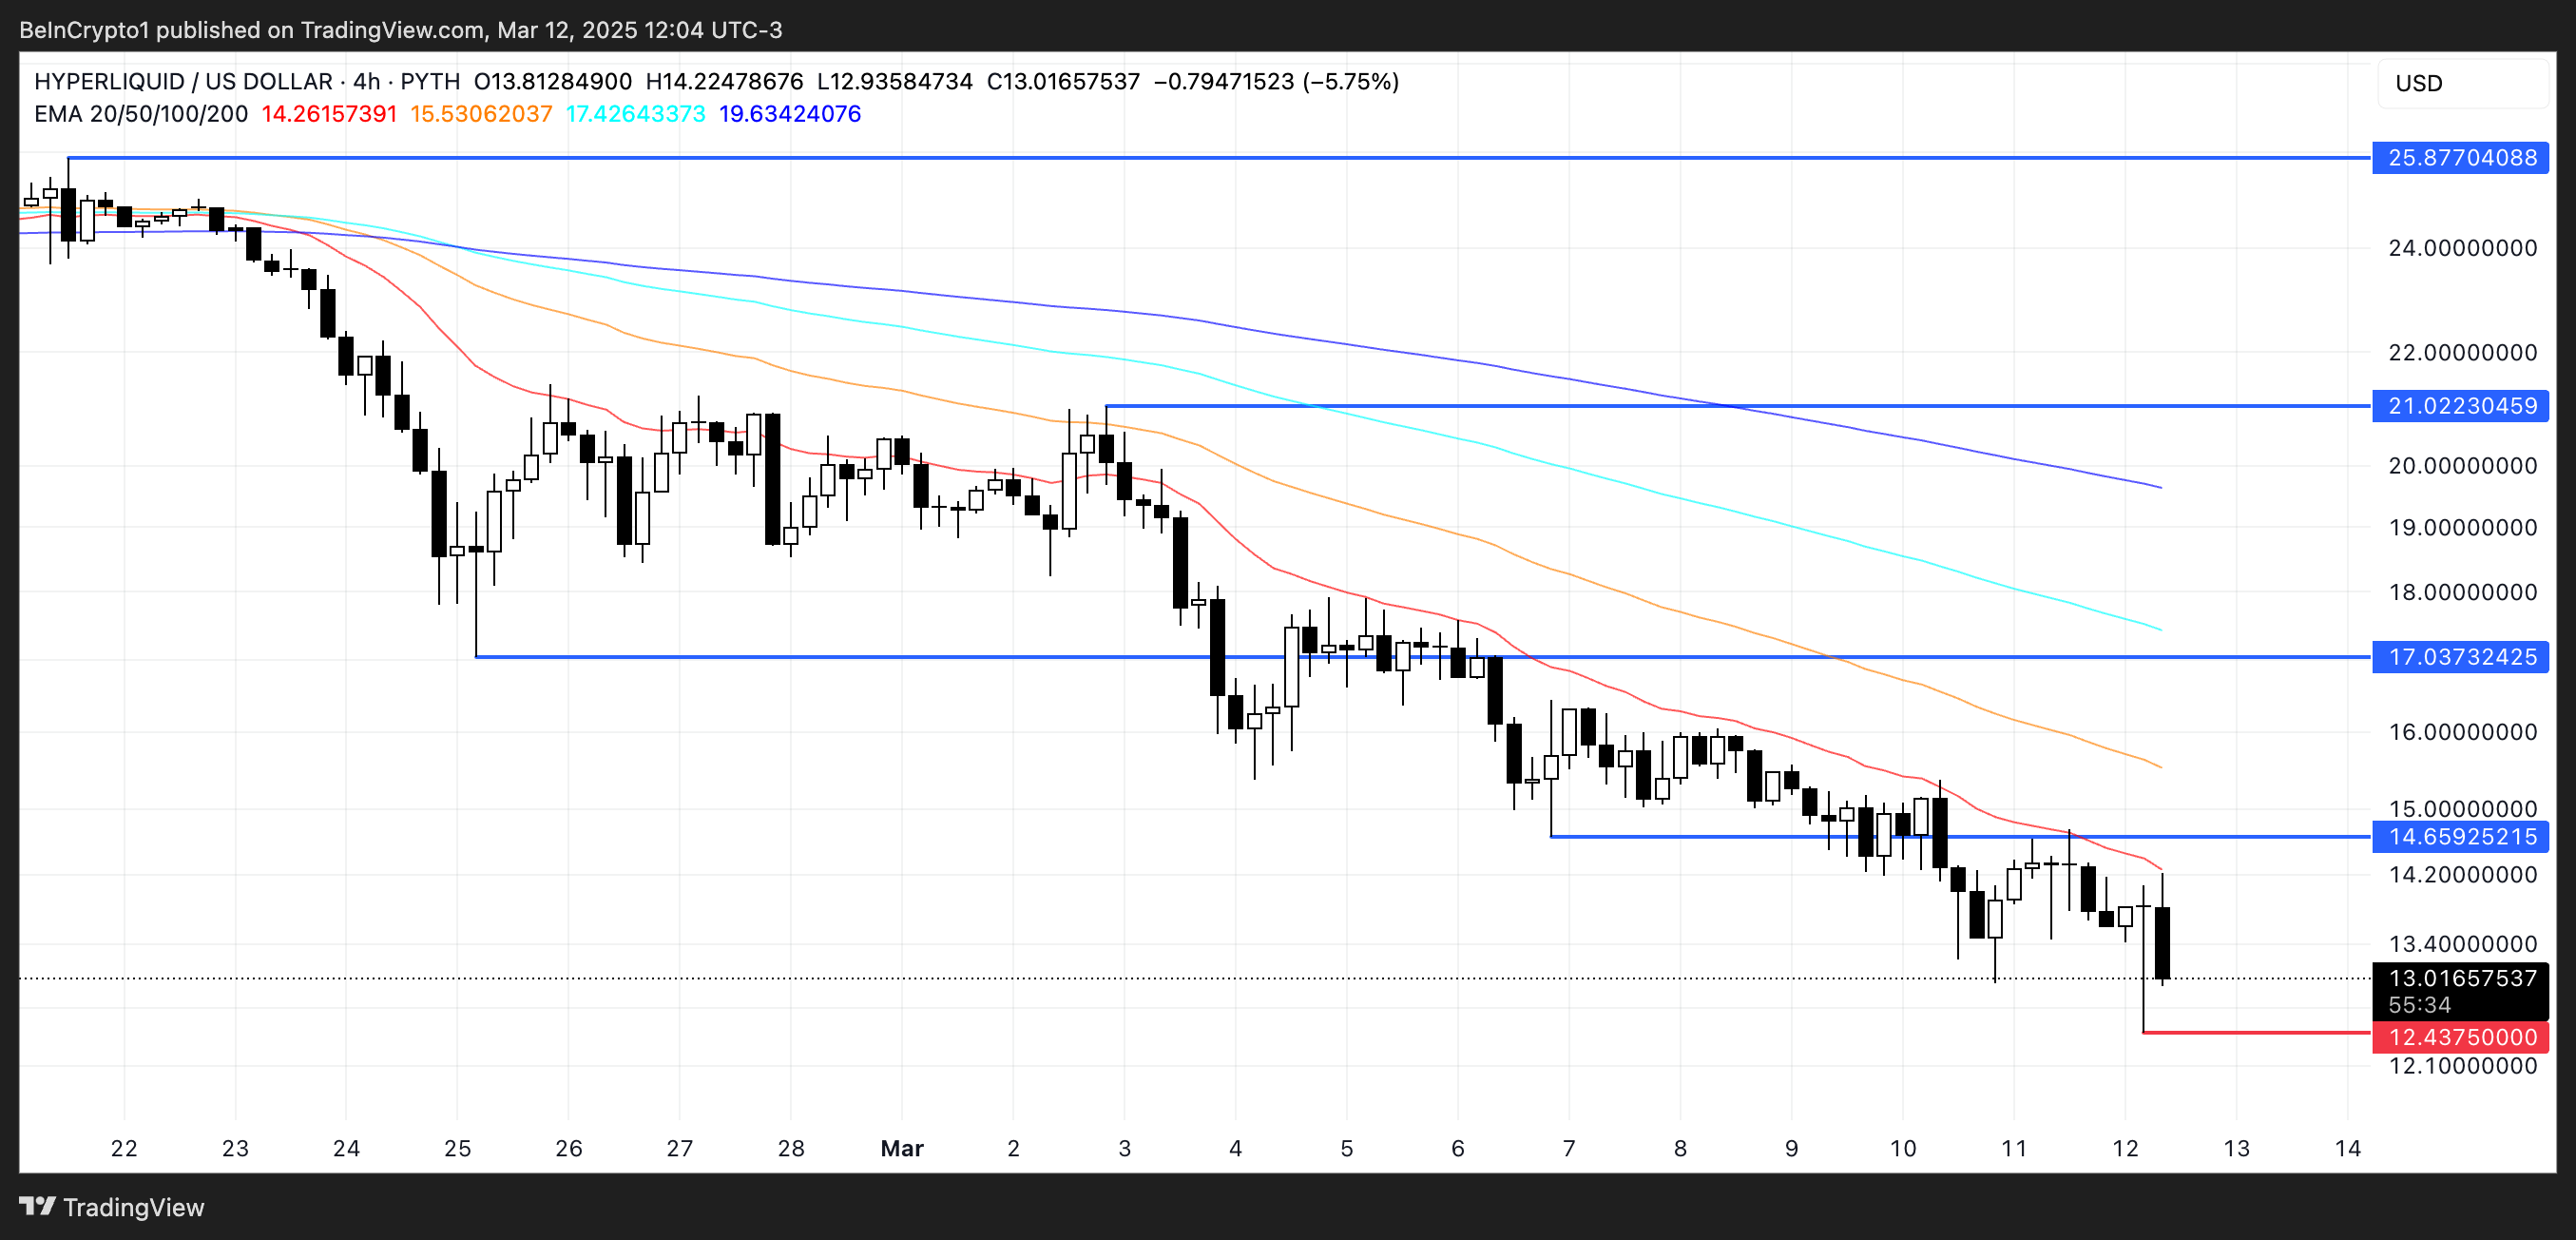
However, Hyperliquid revenue has surged past $11 million in the last seven days, outperforming major players like Pump, Solana, Ethereum, and Raydium.
If momentum returns, HYPE could test the $14.65 resistance, with a potential rally toward $17 if broken. A stronger uptrend could push the price above $20, potentially testing $21 and even $25.87 in the coming days.
Disclaimer
In line with the Trust Project guidelines, this price analysis article is for informational purposes only and should not be considered financial or investment advice. BeInCrypto is committed to accurate, unbiased reporting, but market conditions are subject to change without notice. Always conduct your own research and consult with a professional before making any financial decisions. Please note that our Terms and Conditions, Privacy Policy, and Disclaimers have been updated.


Reason to trust
![]()
Strict editorial policy that focuses on accuracy, relevance, and impartiality
Created by industry experts and meticulously reviewed
The highest standards in reporting and publishing
Strict editorial policy that focuses on accuracy, relevance, and impartiality
Morbi pretium leo et nisl aliquam mollis. Quisque arcu lorem, ultricies quis pellentesque nec, ullamcorper eu odio.
Ethereum price started a recovery wave above the $1,820 zone. ETH is now consolidating and facing hurdles near the $1,950 resistance.
- Ethereum started a recovery wave above the $1,820 level.
- The price is trading below $1,920 and the 100-hourly Simple Moving Average.
- There is a short-term bearish trend line forming with resistance at $1,900 on the hourly chart of ETH/USD (data feed via Kraken).
- The pair must clear the $1,900 and $1,950 resistance levels to start a decent increase.
Ethereum Price Faces Resistance
Ethereum price formed a base above the $1,760 level and started a recovery wave, like Bitcoin. ETH was able to clear the $1,820 and $1,850 resistance levels.
The bulls pushed the price above the $1,920 level. There was a move above the 23.6% Fib retracement level of the downward wave from the $2,150 swing high to the $1,752 low. However, the bears seem to be active near the $1,950 resistance zone.
Ethereum price is now trading below $1,920 and the 100-hourly Simple Moving Average. On the upside, the price seems to be facing hurdles near the $1,900 level.
There is also a short-term bearish trend line forming with resistance at $1,900 on the hourly chart of ETH/USD. The next key resistance is near the $1,950 level or the 50% Fib retracement level of the downward wave from the $2,150 swing high to the $1,752 low.

The first major resistance is near the $1,990 level. A clear move above the $1,990 resistance might send the price toward the $2,050 resistance. An upside break above the $2,050 resistance might call for more gains in the coming sessions. In the stated case, Ether could rise toward the $2,120 resistance zone or even $2,250 in the near term.
Another Drop In ETH?
If Ethereum fails to clear the $1,950 resistance, it could start another decline. Initial support on the downside is near the $1,845 level. The first major support sits near the $1,800 zone.
A clear move below the $1,800 support might push the price toward the $1,750 support. Any more losses might send the price toward the $1,720 support level in the near term. The next key support sits at $1,650.
Technical Indicators
Hourly MACD – The MACD for ETH/USD is gaining momentum in the bullish zone.
Hourly RSI – The RSI for ETH/USD is now above the 50 zone.
Major Support Level – $1,800
Major Resistance Level – $1,920
Reason to trust
![]()
Strict editorial policy that focuses on accuracy, relevance, and impartiality
Created by industry experts and meticulously reviewed
The highest standards in reporting and publishing
Strict editorial policy that focuses on accuracy, relevance, and impartiality
Morbi pretium leo et nisl aliquam mollis. Quisque arcu lorem, ultricies quis pellentesque nec, ullamcorper eu odio.
Ethereum price started a recovery wave above the $1,820 zone. ETH is now consolidating and facing hurdles near the $1,950 resistance.
- Ethereum started a recovery wave above the $1,820 level.
- The price is trading below $1,920 and the 100-hourly Simple Moving Average.
- There is a short-term bearish trend line forming with resistance at $1,900 on the hourly chart of ETH/USD (data feed via Kraken).
- The pair must clear the $1,900 and $1,950 resistance levels to start a decent increase.
Ethereum Price Faces Resistance
Ethereum price formed a base above the $1,760 level and started a recovery wave, like Bitcoin. ETH was able to clear the $1,820 and $1,850 resistance levels.
The bulls pushed the price above the $1,920 level. There was a move above the 23.6% Fib retracement level of the downward wave from the $2,150 swing high to the $1,752 low. However, the bears seem to be active near the $1,950 resistance zone.
Ethereum price is now trading below $1,920 and the 100-hourly Simple Moving Average. On the upside, the price seems to be facing hurdles near the $1,900 level.
There is also a short-term bearish trend line forming with resistance at $1,900 on the hourly chart of ETH/USD. The next key resistance is near the $1,950 level or the 50% Fib retracement level of the downward wave from the $2,150 swing high to the $1,752 low.
The first major resistance is near the $1,990 level. A clear move above the $1,990 resistance might send the price toward the $2,050 resistance. An upside break above the $2,050 resistance might call for more gains in the coming sessions. In the stated case, Ether could rise toward the $2,120 resistance zone or even $2,250 in the near term.
Another Drop In ETH?
If Ethereum fails to clear the $1,950 resistance, it could start another decline. Initial support on the downside is near the $1,845 level. The first major support sits near the $1,800 zone.
A clear move below the $1,800 support might push the price toward the $1,750 support. Any more losses might send the price toward the $1,720 support level in the near term. The next key support sits at $1,650.
Technical Indicators
Hourly MACD – The MACD for ETH/USD is gaining momentum in the bullish zone.
Hourly RSI – The RSI for ETH/USD is now above the 50 zone.
Major Support Level – $1,800
Major Resistance Level – $1,920
Reason to trust
![]()
Strict editorial policy that focuses on accuracy, relevance, and impartiality
Created by industry experts and meticulously reviewed
The highest standards in reporting and publishing
Strict editorial policy that focuses on accuracy, relevance, and impartiality
Morbi pretium leo et nisl aliquam mollis. Quisque arcu lorem, ultricies quis pellentesque nec, ullamcorper eu odio.
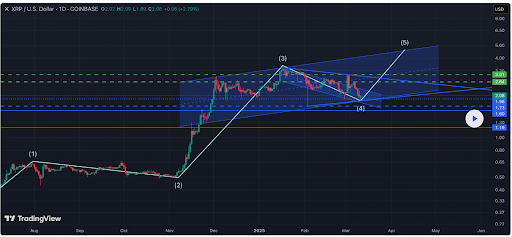
Crypto analyst CW23 has revealed that the XRP price is hinting at a symmetrical triangle, which provides a bullish outlook for the crypto. However, he warned that a price crash could occur before XRP breaks out of this triangle and rallies to the upside.
XRP Price Hints At Symmetrical Triangle
In a TradingView post, CW23 revealed that a symmetrical triangle may be forming for the XRP price. This came as he noted that XRP is bouncing off the bottom of an ascending channel, with the pinbar candle on the 4-hour chart now in upward pressure having tested the bottom. The analyst added that the crypto will probably trade in this range for a while.
Related Reading
However, CW23 stated that a symmetrical triangle is forming and it could be a larger wave 4 pullback in the Elliot wave before wave 5 takes the XRP price to a new all-time high (ATH) to round out this year’s bull cycle. The analyst’s accompanying chart showed that XRP could drop to as low as $1.70 on wave 4. Meanwhile, the asset is projected to rally to a new ATH of $5 on wave 5.
Crypto analyst ElmoX also recently predicted that the XRP price could witness a massive corrective and drop below $2 before it rallies to new highs. The analyst provided a more bullish outlook for XRP, predicting it could rally to as high as $20 in this market cycle. However, he warned that the crypto would face major resistance at $2.9 on its way to a new ATH.
The Altcoin Has Finalized Its Correction
In an X post, crypto analyst Dark Defender stated that the XRP price has finalized the correction on the four-hour time frame. He mentioned that XRP is expected to move towards $2.42 first considering the correction structures. The analyst also affirmed that the real move to the upside will start after XRP climbs above the Ichimoku clouds.
Related Reading
Dark Defender highlighted $2.22 and $2.04 as the support levels to watch out for while he stated that $4.2932 and $5.8563 are the targets which the XRP price could rally to. Crypto analyst CasiTrades highlighted the importance of the altcoin holding the support levels at $2.04 and $2.11.
She added that a hold above either of these levels is critical to maintaining the consolidation. Meanwhile, the analyst revealed that the next resistance levels are $2.25 and $2.70, which happens to be the next breakout level. CasiTrades also assured market participants that the price is still bullish, indicating it is still well primed to reach new highs.
At the time of writing, the XRP price is trading at around $2.24, up over 2% in the last 24 hours, according to data from CoinMarketCap.
Featured image from iStock, chart from Tradingview.com

Ethereum Price Consolidates and Eyes Recovery—Is a Bounce Incoming?
Ethereum Price Consolidates and Eyes Recovery—Is a Bounce Incoming?

XRP Price Hints At Symmetrical Triangle, But A Crash Could Come Before The Surge

CertiK Expert Discusses Surge in Social Engineering Crypto Scams

Cardano (ADA) Struggle Persists—Is a Rebound Still Possible?

Court Ruling Raises 3AC’s FTX Claim to $1.53 Billion

2.52 Million Altcoins Are Ruining Crypto’s Future

Animoca Brands Valuation Tanks 75% In Two Years, Here’s Why

Crypto exchange BingX hacked for $43 million

Are The Big Players Losing Interest?

Hong Kong’s Securities Association Tips Authorities On Crypto Self-Regulation

Coinbase cbBTC Set to go Live on Solana
2.52 Million Altcoins Are Ruining Crypto’s Future
Animoca Brands Valuation Tanks 75% In Two Years, Here’s Why
Crypto exchange BingX hacked for $43 million
Are The Big Players Losing Interest?
Hong Kong’s Securities Association Tips Authorities On Crypto Self-Regulation
Coinbase cbBTC Set to go Live on Solana
-

 Market23 hours ago
Solana Hit by Bearish Signal After 3 Years, Price at Risk
-

 Ethereum19 hours ago
Ethereum Net Taker Volume Signals Huge Selling Pressure – Can Bulls Hold Key Levels?
-

 Market24 hours ago
This Crypto Analyst Correctly Predicted XRP Price Crash Below $2, Here’s The Rest Of The Forecast
-

 Market22 hours ago
Aave Horizon RWA Product To Unlock Trillions in Tokenized Assets
-

 Market20 hours ago
Celestia TIA) Price Nears Consolidation After 31% Rally
-

 Market19 hours ago
Crypto Stocks Post Losses, But Bear Market Fears Diminish
-

 Market21 hours ago
XCN Dip Signals More Downside as Bearish Indicators Intensify
-

 Regulation15 hours ago
Ripple Secures DFSA License in the UAE