
Market
How Telegram Aidrops Could Boost TON

As the Telegram community prepares for several airdrops in October, investors may also need to consider the impact on Toncoin’s price. The anticipated launches could drive demand for TON, the native token of The Open Network.
With excitement building for the tokens’ distribution, this analysis highlights why Toncoin could experience an influx of new investors and what investors stand to gain.
Telegram Airdrops Looks Good for Toncoin
Telegram airdrops have become increasingly popular this year. This happened due to the launch of tokens like Notcoin (NOT) and, more recently, Dogs (DOGS). However, this previous launch was not as big as the number of mini-apps ready to distribute rewards to their users in October.
Starting from September 26, which Hamster Kombat set for its Token Generation Event (TGE), BeInCrypto also reported that other Telegram airdrops, including X Empire, Major, and MemeFi, will launch in October.
As a result, on-chain data shows a significant increase in the number of new, active, and zero-balance addresses on TON. This overall increase suggests that the TON ecosystem is gearing up for the event, which could drive notable demand for the cryptocurrency.
Read more: What Are Telegram Bot Coins?
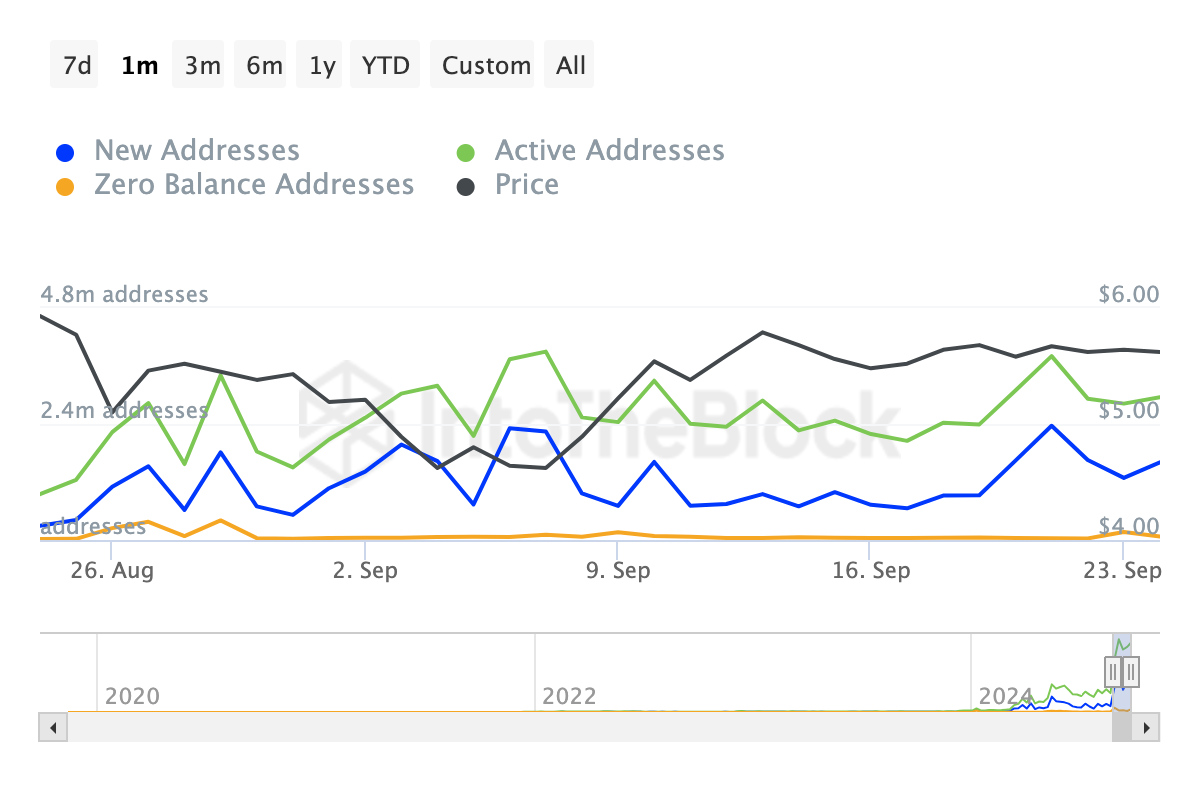
If sustained, Toncoin’s price might see a notable increase next month. Bitget Chief Analyst Ryan Lee also seems to agree with the prediction. In a conversation with BeInCrypto, Lee notes that Toncoin could see significant improvement. The analyst also referred to the surge in stablecoin supply on TON, saying that it represents increased confidence.
“October is the stage when high-traffic TG Bot projects in the TON ecosystem are gradually completing their TGE. In an optimistic market without any black swan events, it is expected that Toncoin could return to above $7,” Lee told BeInCrypto.
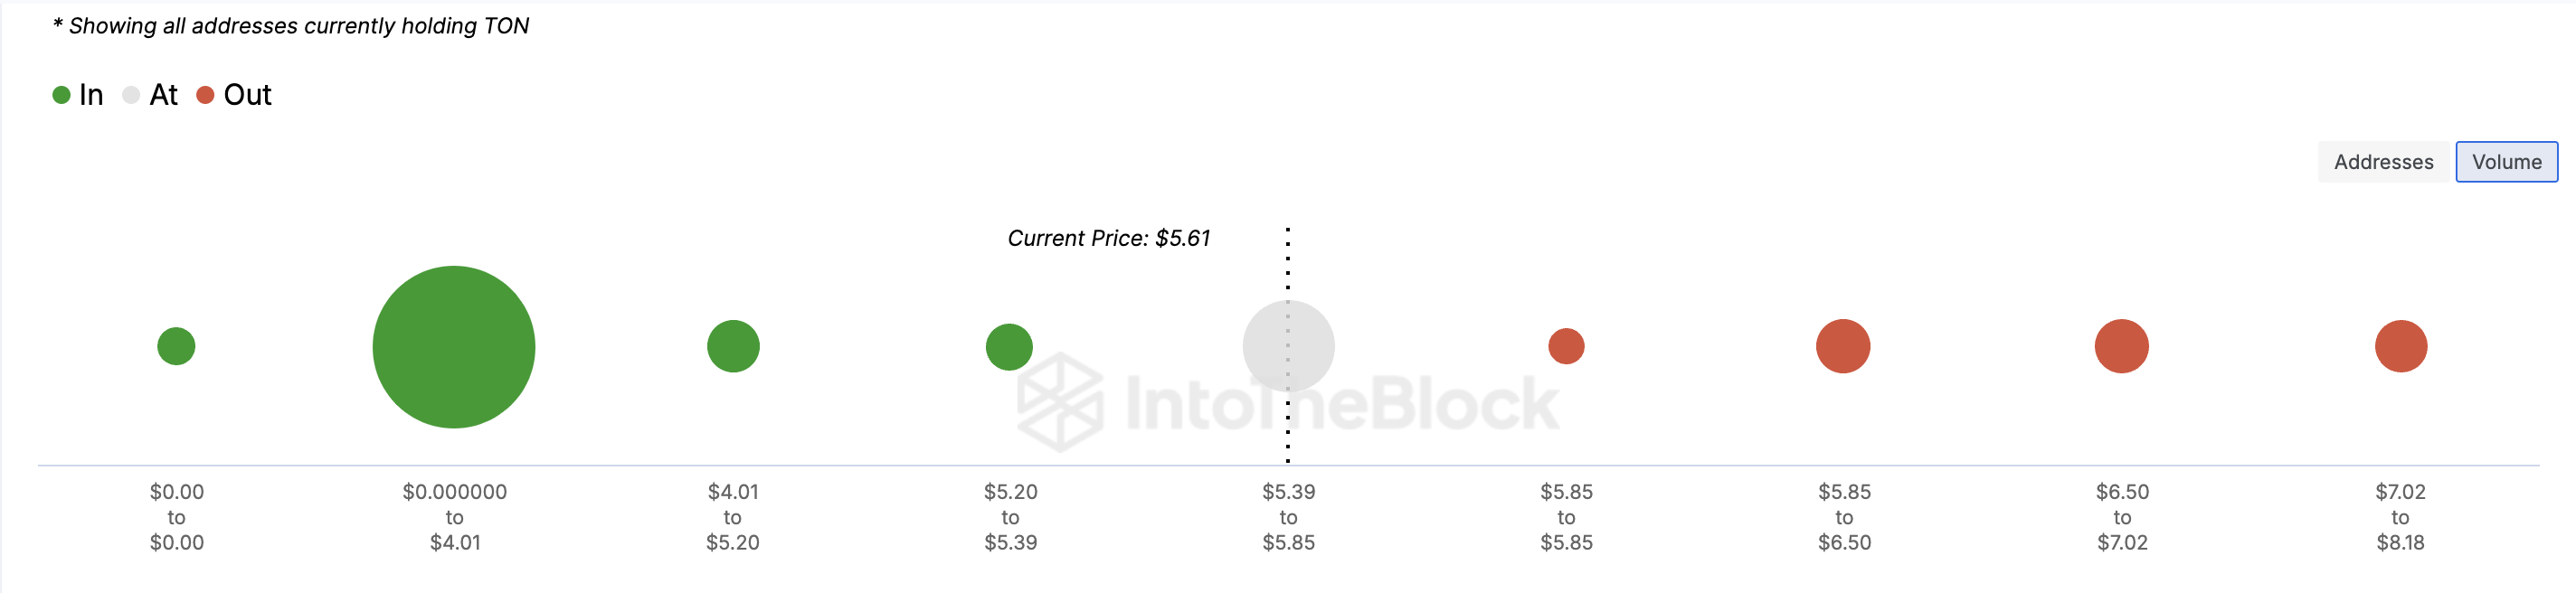
Should this be the case, the Global In/Out of Money (GIOM) reveals that over 17 million addresses currently holding 151.80 million coins at a loss could make $850 million in unrealized profits.
TON Price Prediction: $7 Could Be the First Stop
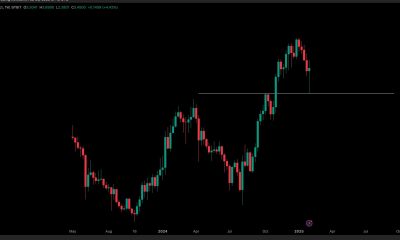
According to the daily chart, Toncoin’s price is $5.70. This is the same spot the altcoin was before it rallied by 23.20% and hit $7 in May. Furthermore, the Awesome Oscillator (AO) is positive, indicating that TON is experiencing increasing upward momentum.
Due to this position, the price of cryptocurrency might continue to increase. Toncoin could encounter resistance at $6.50 in its push for a higher price. However, if it mirrors its performance from May, it might break through this level.
Read more: 7 Best Exchanges To Buy and Sell Hamster Kombat (HMSTR) in 2024
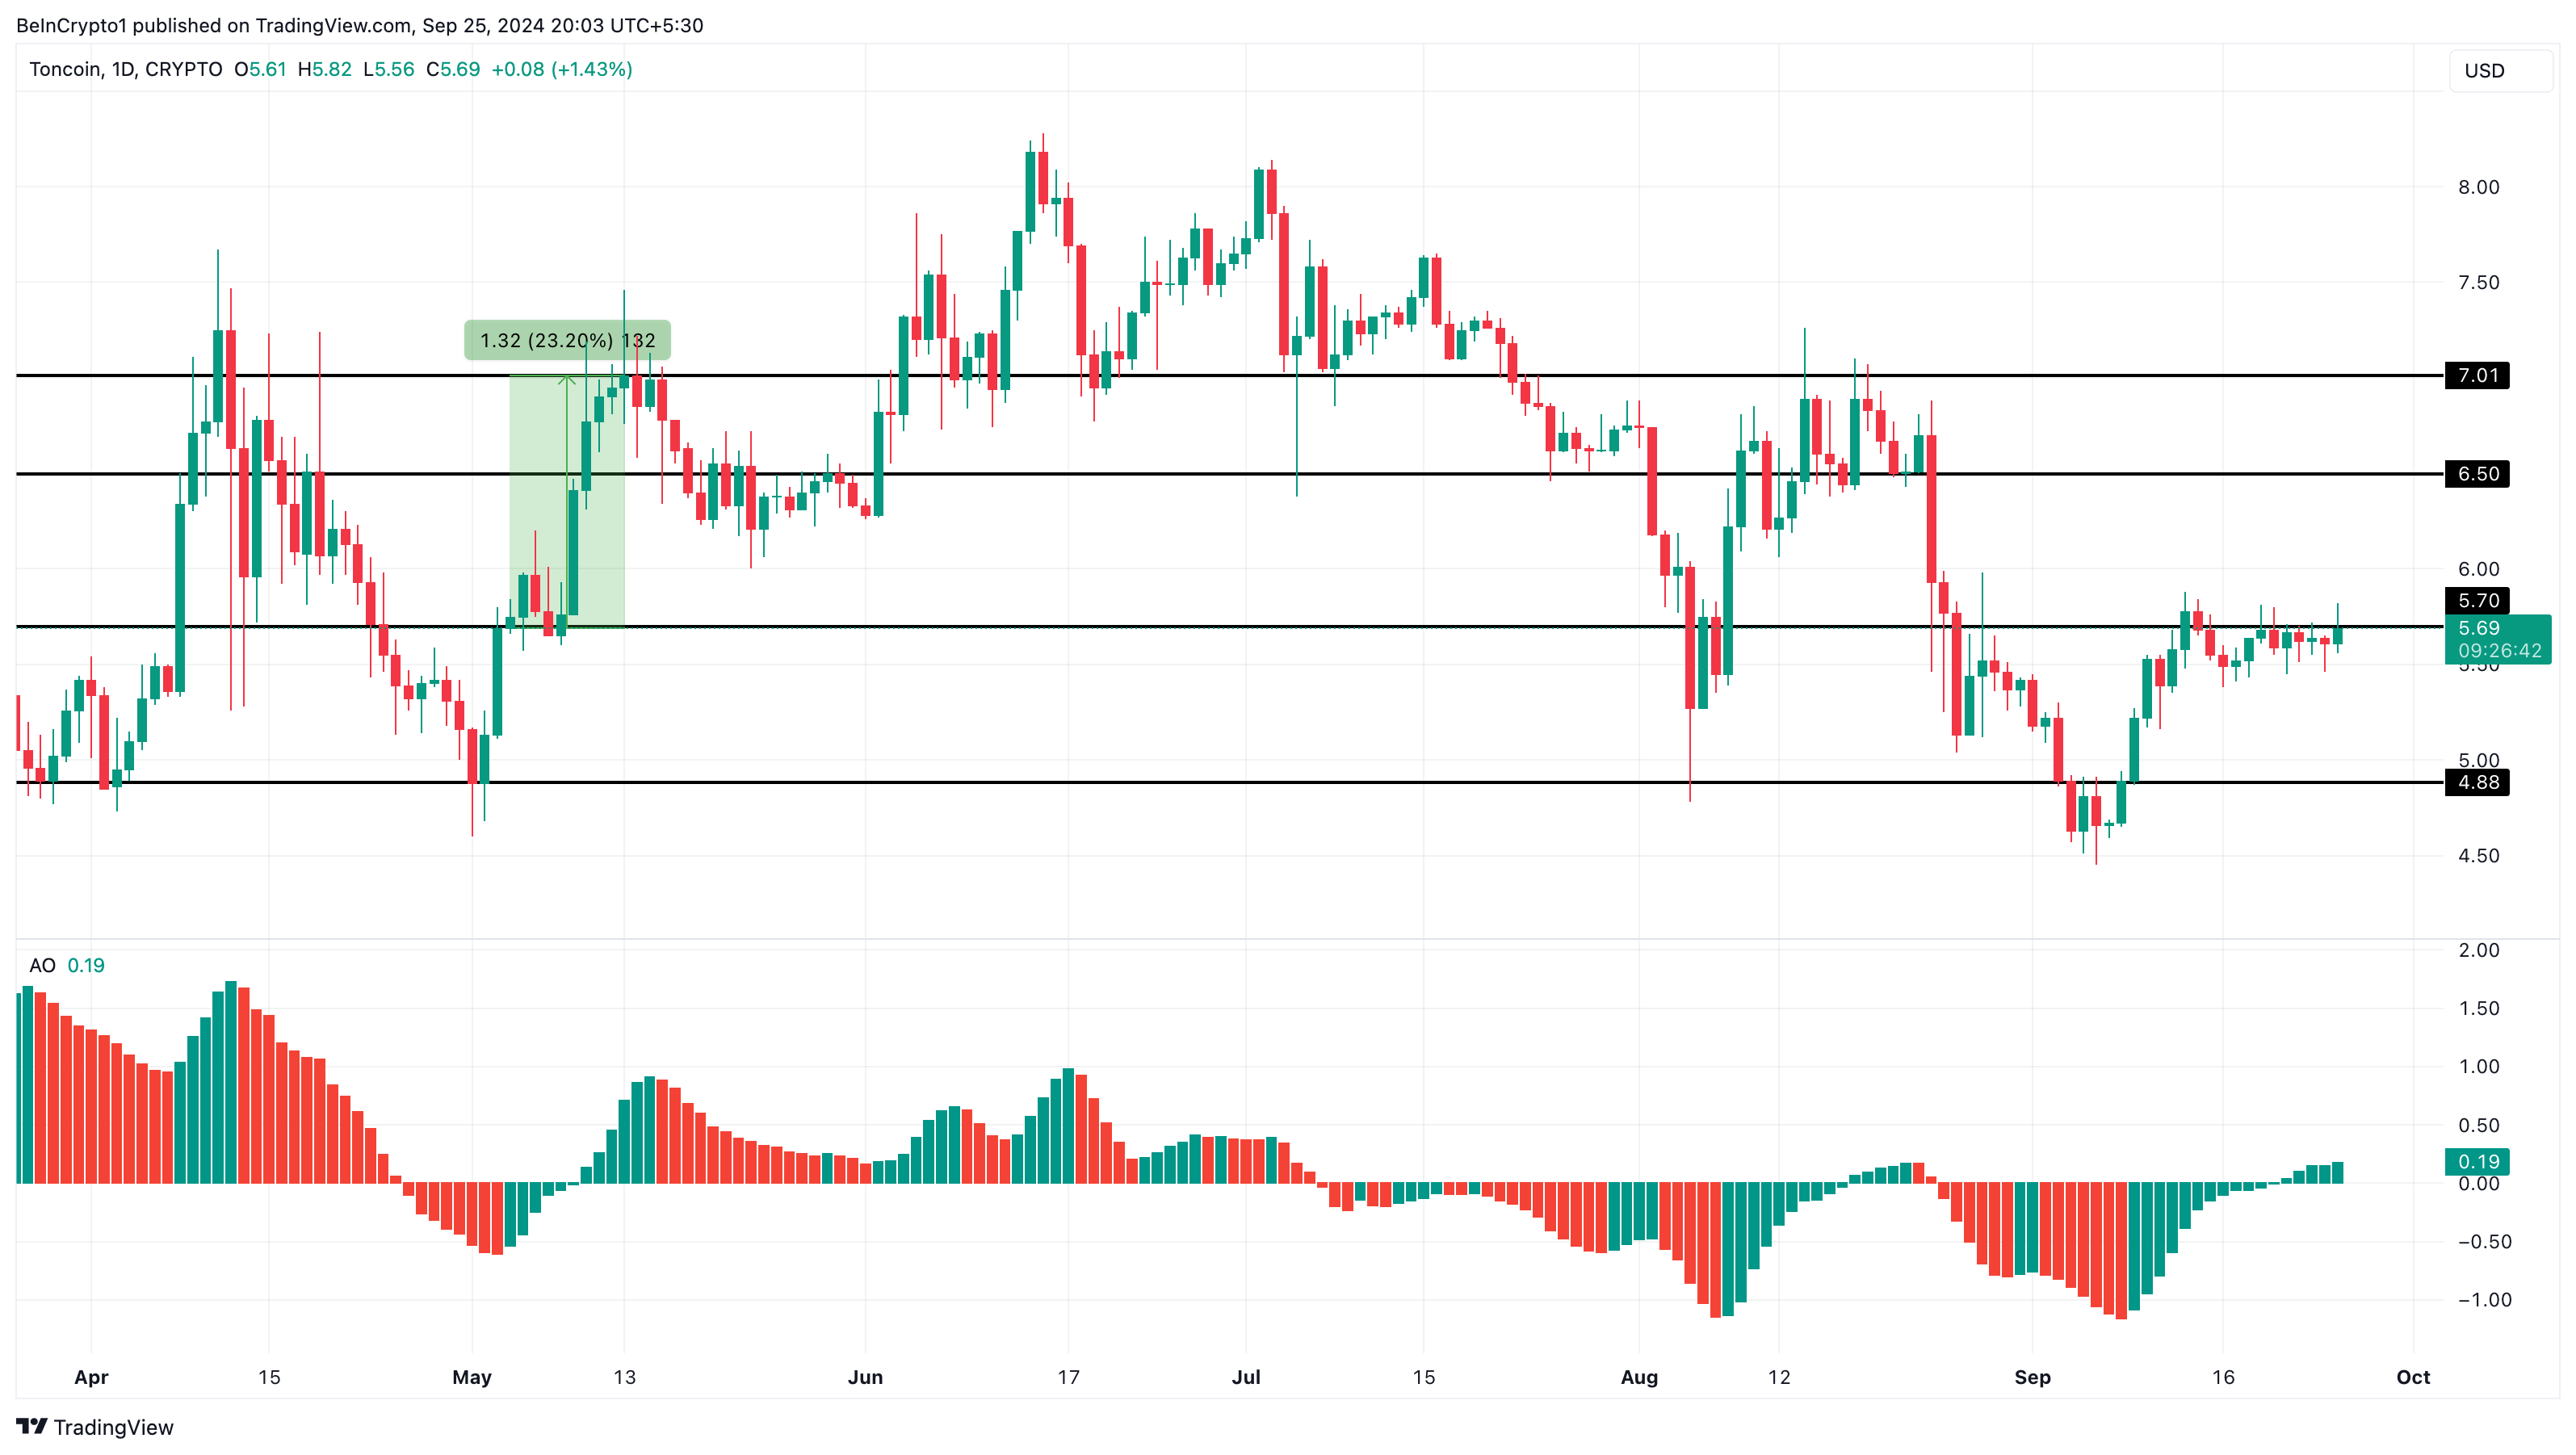
If successful, Toncoin could rise to $7 and approach $8. On the other hand, if it faces rejection at $6.50, the price could fall to $4.88.
Disclaimer
In line with the Trust Project guidelines, this price analysis article is for informational purposes only and should not be considered financial or investment advice. BeInCrypto is committed to accurate, unbiased reporting, but market conditions are subject to change without notice. Always conduct your own research and consult with a professional before making any financial decisions. Please note that our Terms and Conditions, Privacy Policy, and Disclaimers have been updated.


World Liberty Financial (WLF), a decentralized finance (DeFi) project backed by the Trump family, has successfully sold 99.3% of its recently issued 5 billion WLFI tokens.
The tokens went on sale on January 20, following a surge in demand after the initial public sale.
WLFI Token Achieves Major Milestone
According to the data on the project’s official website, World Liberty Financial has now sold a total of 24.97 billion WLFI tokens out of a 25 billion token supply allocated for public sale.

For context, the total supply of WLFI tokens is 100 billion, with an initial allocation of 20 billion tokens designated for the first public sale. This sale commenced on October 15, 2024, with the token priced at $0.015. Furthermore, the project restricted access to individuals who qualified through a whitelist.
The initial target for the WLFI token sale was set at $300 million. Nonetheless, weak demand in the early stages led to a drastic reduction of the presale target to $30 million.
Despite the initial setback, the tides shifted after Official Trump (TRUMP) and Melania Meme (MELANIA) meme coins were launched. This launch sparked renewed interest in World Liberty Financial, leading to a surge in demand for WLFI tokens.
By January 20, World Liberty Financial had completed its initial token sale, selling 20% of its total token supply. However, seeing the surge in demand, the project released an additional 5% of its token supply at a price of $0.05 per token.
“An additional 5% of our token supply is now available to purchase on our website. We appreciate the overwhelming support and look forward to welcoming so many new people to our community!” the project posted on X.
At the time of writing, only 34.6 million tokens of the 5 billion public sale allocation remain available.
The WLFI token’s primary purpose is governance within the World Liberty Financial Protocol. It allows token holders to propose, discuss, and vote on key protocol decisions. This gives token owners an equal voice in shaping the platform’s development, ensuring fair and democratic changes to its ecosystem.
As an added measure, the tokens will remain non-transferable for the first 12 months post-launch. Moreover, any community-approved changes to this restriction will not take effect until the one-year period concludes.
The milestone comes shortly after World Liberty Financial announced a partnership with Sui (SUI). The aim of this collaboration is to explore opportunities in DeFi. It will also integrate Sui’s technology into WLFI’s token reserve, “Macro Strategy,” supporting leading DeFi projects.
Disclaimer
In adherence to the Trust Project guidelines, BeInCrypto is committed to unbiased, transparent reporting. This news article aims to provide accurate, timely information. However, readers are advised to verify facts independently and consult with a professional before making any decisions based on this content. Please note that our Terms and Conditions, Privacy Policy, and Disclaimers have been updated.
Reason to trust
![]()
Strict editorial policy that focuses on accuracy, relevance, and impartiality
Created by industry experts and meticulously reviewed
The highest standards in reporting and publishing
Strict editorial policy that focuses on accuracy, relevance, and impartiality
Morbi pretium leo et nisl aliquam mollis. Quisque arcu lorem, ultricies quis pellentesque nec, ullamcorper eu odio.
Ethereum price started a recovery wave from the $1,750 zone. ETH is now consolidating and facing hurdles near the $1,920 resistance.
- Ethereum started a recovery wave above the $1,850 level.
- The price is trading below $1,950 and the 100-hourly Simple Moving Average.
- There is a short-term bearish trend line forming with resistance at $1,920 on the hourly chart of ETH/USD (data feed via Kraken).
- The pair must clear the $1,920 and $1,950 resistance levels to start a decent increase.
Ethereum Price Faces Hurdles
Ethereum price formed a base above the $1,750 level and started a recovery wave, like Bitcoin. ETH was able to clear the $1,800 and $1,820 resistance levels.
The bulls pushed the price above the $1,880 level. There was a move above the 23.6% Fib retracement level of the downward wave from the $2,150 swing high to the $1,752 low. However, the bears seem to be active near the $1,920 resistance zone.
Ethereum price is now trading below $1,950 and the 100-hourly Simple Moving Average. On the upside, the price seems to be facing hurdles near the $1,920 level.
There is also a short-term bearish trend line forming with resistance at $1,920 on the hourly chart of ETH/USD. The next key resistance is near the $1,950 level or the 50% Fib retracement level of the downward wave from the $2,150 swing high to the $1,752 low.

The first major resistance is near the $2,000 level. A clear move above the $2,000 resistance might send the price toward the $2,060 resistance. An upside break above the $2,060 resistance might call for more gains in the coming sessions. In the stated case, Ether could rise toward the $2,120 resistance zone or even $2,250 in the near term.
Another Decline In ETH?
If Ethereum fails to clear the $1,920 resistance, it could start another decline. Initial support on the downside is near the $1,850 level. The first major support sits near the $1,800 zone.
A clear move below the $1,800 support might push the price toward the $1,750 support. Any more losses might send the price toward the $1,720 support level in the near term. The next key support sits at $1,650.
Technical Indicators
Hourly MACD – The MACD for ETH/USD is losing momentum in the bearish zone.
Hourly RSI – The RSI for ETH/USD is now above the 50 zone.
Major Support Level – $1,800
Major Resistance Level – $1,920

XRP price started a fresh recovery wave above the $2.00 zone. The price is now showing positive signs and might clear the $2.250 resistance zone.
- XRP price started a fresh recovery wave above the $2.120 resistance zone.
- The price is now trading above $2.150 and the 100-hourly Simple Moving Average.
- There is a short-term bullish trend line forming with support at $2.188 on the hourly chart of the XRP/USD pair (data source from Kraken).
- The pair might continue to move up if it clears the $2.250 resistance zone.
XRP Price Eyes Upside Break
XRP price remained supported and started a recovery wave from the $1.90 zone, like Bitcoin and Ethereum. The price was able to clear the $2.00 and $2.050 resistance levels.
There was a move above the $2.120 resistance. The price surpassed the 50% Fib retracement level of the downward wave from the $2.365 swing high to the $1.90 low. However, the bears are now active near the $2.250 resistance zone.
The price is now trading above $2.150 and the 100-hourly Simple Moving Average. There is also a short-term bullish trend line forming with support at $2.188 on the hourly chart of the XRP/USD pair.
On the upside, the price might face resistance near the $2.250 level. It is near the 76.4% Fib retracement level of the downward wave from the $2.365 swing high to the $1.90 low. The first major resistance is near the $2.3650 level.

The next resistance is $2.450. A clear move above the $2.450 resistance might send the price toward the $2.50 resistance. Any more gains might send the price toward the $2.550 resistance or even $2.650 in the near term. The next major hurdle for the bulls might be $2.80.
Another Decline?
If XRP fails to clear the $2.250 resistance zone, it could start another decline. Initial support on the downside is near the $2.1880 level and the trend line. The next major support is near the $2.120 level.
If there is a downside break and a close below the $2.120 level, the price might continue to decline toward the $2.050 support. The next major support sits near the $2.00 zone.
Technical Indicators
Hourly MACD – The MACD for XRP/USD is now gaining pace in the bullish zone.
Hourly RSI (Relative Strength Index) – The RSI for XRP/USD is now above the 50 level.
Major Support Levels – $2.180 and $2.120.
Major Resistance Levels – $2.250 and $2.350.
Lawyer Explains Why the SEC Delay Is Not a Big Issue

WLFI Token Sale Reaches 99.3% Completion
US Strategic Bitcoin Reserve Sparks Crypto Regulation Surge
HYPE Price Crashes 9% As Hyperliquid Faces Outflows After ETH Whale Liquidation

Ethereum Price Hits Resistance—Will The Recovery Stall Here?
Chainlink Whale Sells 356K Coins Sparking Concerns; Can LINK Price Hit $45?

2.52 Million Altcoins Are Ruining Crypto’s Future

Animoca Brands Valuation Tanks 75% In Two Years, Here’s Why

Crypto exchange BingX hacked for $43 million

Are The Big Players Losing Interest?

Hong Kong’s Securities Association Tips Authorities On Crypto Self-Regulation

Coinbase cbBTC Set to go Live on Solana
2.52 Million Altcoins Are Ruining Crypto’s Future
Animoca Brands Valuation Tanks 75% In Two Years, Here’s Why
Crypto exchange BingX hacked for $43 million
Are The Big Players Losing Interest?
Hong Kong’s Securities Association Tips Authorities On Crypto Self-Regulation
Coinbase cbBTC Set to go Live on Solana
-

 Altcoin24 hours ago
Binance Reveals Major Backing For These 5 Crypto, Prices To Rally?
-

 Bitcoin23 hours ago
Suspicious High-Leverage Trades on Hyperliquid Raise Red Flags
-

 Bitcoin22 hours ago
Role of Finality Bridge in Bitcoin’s Future
-
Altcoin19 hours ago
Here Are The Possible Outcomes of the Ripple vs SEC Case
-

 Market19 hours ago
Binance Receives a Record $2 Billion Investment from Abu Dhabi
-
 Altcoin23 hours ago
Can Dogecoin Price Still Hit $5 Despite US SEC’s DOGE ETF Delay?
-

 Market22 hours ago
Americans Miss Out on Billions from Crypto Airdrops, Study Finds
-
 Bitcoin21 hours ago
Bitcoin Price Jumps as US CPI Data Falls Below Expectations