Market
Hedera Under Pressure as Volume Drops, Death Cross Nears

Hedera (HBAR) has lost its $7 billion market cap as bearish momentum builds. Trading volume is down 25% in the last 24 hours to $203 million. Key technical indicators are weakening, pointing to growing pressure on the current trend.
The BBTrend has dropped below 10, the RSI is now under 50, and a potential death cross looms on the EMA lines. Unless buying pressure returns soon, HBAR could face deeper corrections in the near term.
Hedera BBTrend Is Still Positive, But Going Down
Hedera’s BBTrend has dropped to 5.84, falling sharply from 11.99 just two days ago. The BBTrend, or Bollinger Band Trend indicator, measures the strength of a trend based on how far the price deviates from its average range.
Readings above 10 typically signal a strong and active trend, while lower values suggest weakening momentum or consolidation.


With BBTrend now sitting below the 10 threshold, it may indicate that Hedera’s recent bullish momentum is losing strength.
The lower reading suggests price volatility is decreasing, which could mean the asset is entering a sideways phase or preparing for a potential pullback.
Unless BBTrend picks up again, HBAR might struggle to sustain upward movement in the short term.
Hedera Is Losing Bullish Momentum
Hedera’s RSI is currently at 44.67, down from 63.12 just three days ago, signaling a notable loss in bullish momentum. The Relative Strength Index (RSI) is a momentum oscillator that measures the speed and magnitude of recent price changes.
It ranges from 0 to 100, with values above 70 typically indicating overbought conditions and values below 30 suggesting the asset is oversold.

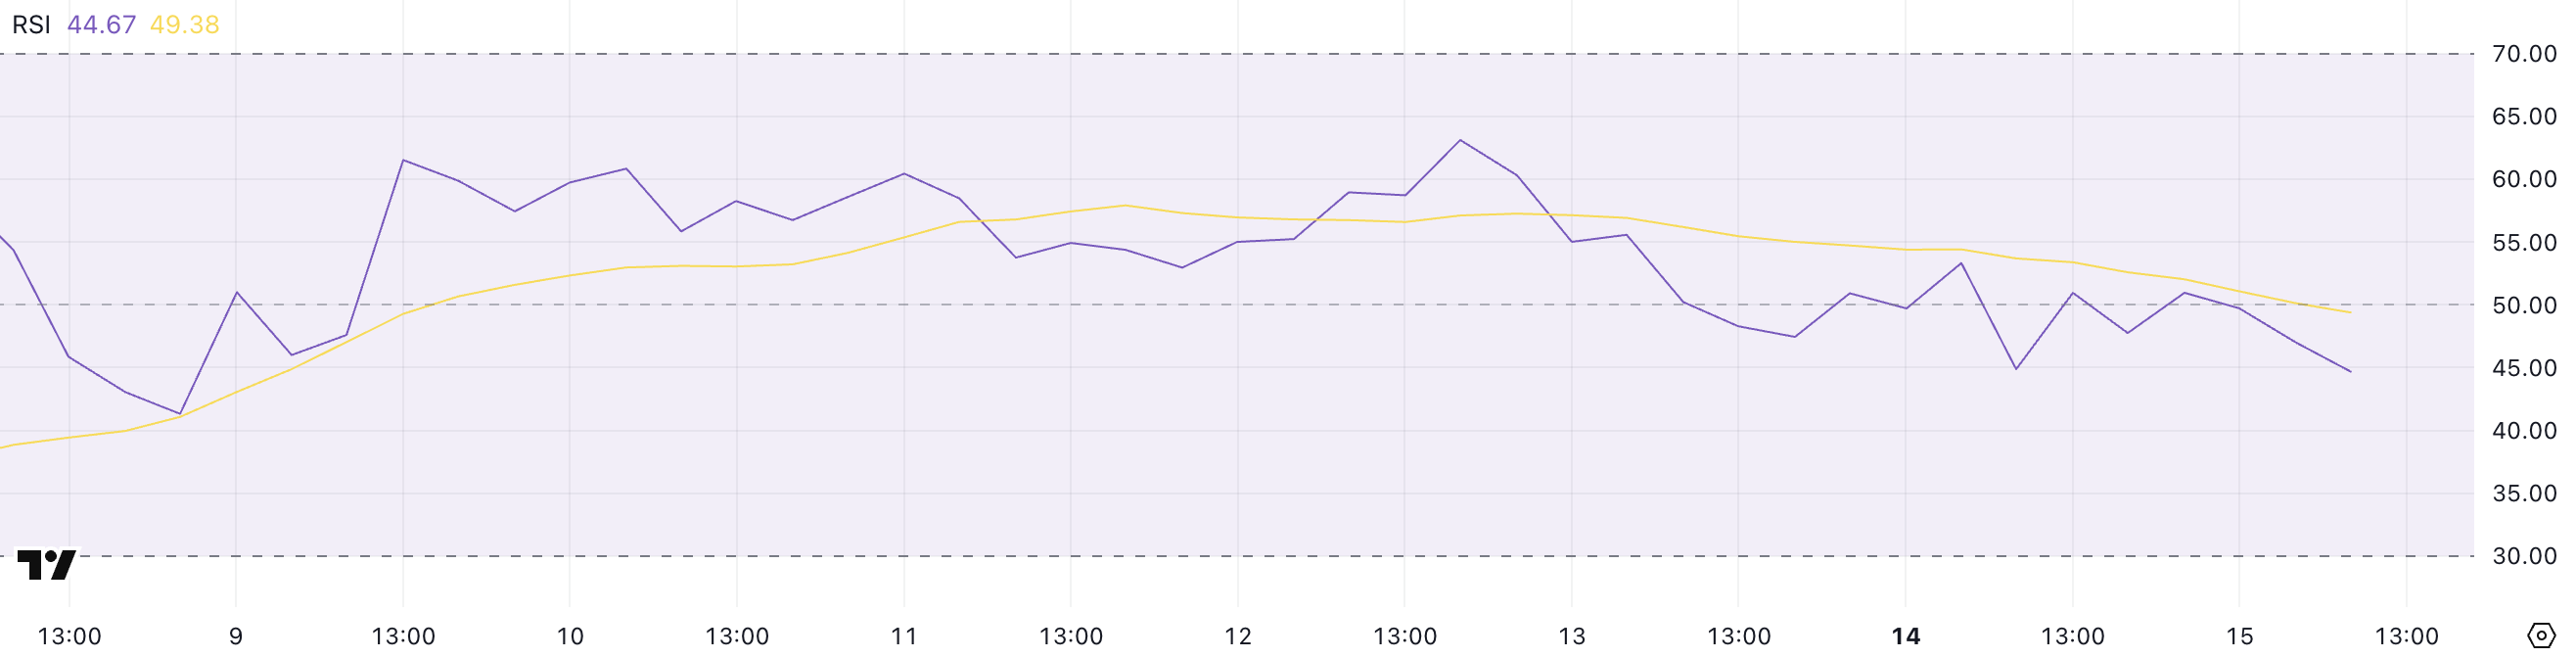
With RSI now below the neutral 50 mark, it suggests that sellers are gaining more control. An RSI around 44.67 points to weakening demand and could mean that HBAR is entering a consolidation phase or facing mild downward pressure.
If the RSI continues to fall, it could lead to a deeper correction unless buyers step back in.
Will Hedera Fall Below $0.15?
Hedera’s EMA lines are signaling a potential death cross, a bearish formation that could lead to increased downside pressure. If this pattern is confirmed, Hedera price may first test two nearby support levels at $0.156 and $0.153.
These levels have recently acted as short-term cushions, and losing them could trigger a sharper drop.


A breakdown below both supports could open the way toward $0.124, especially if selling momentum accelerates. On the flip side, if HBAR can regain strength and push above the $0.168 resistance, it could shift sentiment back in favor of the bulls.
A breakout there may lead to further gains toward $0.178 and potentially $0.20 if the uptrend builds enough momentum.
Disclaimer
In line with the Trust Project guidelines, this price analysis article is for informational purposes only and should not be considered financial or investment advice. BeInCrypto is committed to accurate, unbiased reporting, but market conditions are subject to change without notice. Always conduct your own research and consult with a professional before making any financial decisions. Please note that our Terms and Conditions, Privacy Policy, and Disclaimers have been updated.