
Market
Hedera (HBAR) Jumps 14%—More Gains Ahead?

Hedera (HBAR) has recovered over 5% in the past week. Despite some corrections today, multiple technical indicators flash bullish signals, suggesting a potential shift in momentum.
The DMI shows buyers firmly in control, the Ichimoku Cloud has flipped bullish, and a golden cross appears close to forming on the EMA lines. With key resistance levels approaching, HBAR could be gearing up for an extended move—if the current momentum holds.
HBAR DMI Shows Buyers Are In Full Control
Hedera’s DMI chart is showing signs of strengthening trend momentum, with the ADX (Average Directional Index) rising to 24.17 from 21.82 just a day ago.
The ADX measures the strength of a trend regardless of its direction. Readings above 25 typically indicate a strong trend, while values between 20 and 25 suggest a trend may be developing.
With the ADX nearing that threshold, Hedera could be preparing for a more decisive move if momentum continues building.
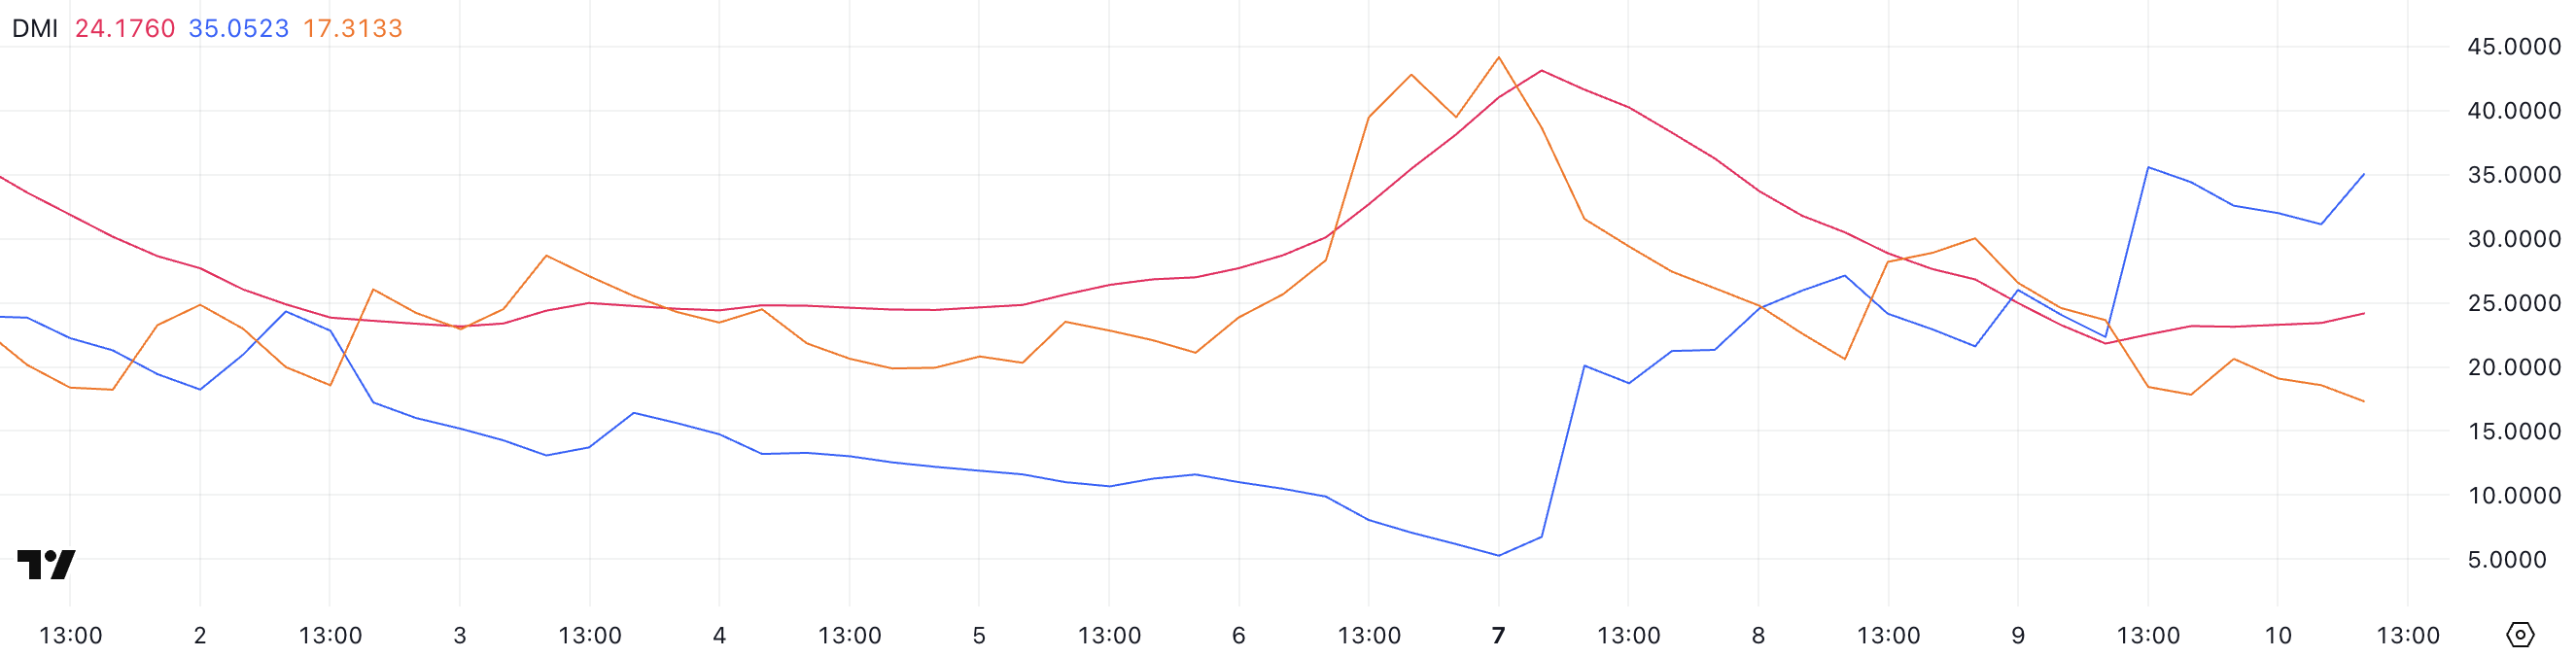
Looking at the directional indicators, the +DI has surged to 35.05 from 22.33, while the -DI has dropped to 17.31 from 23.65. This widening gap between the bullish and bearish pressure signals a strong shift in favor of buyers.
If this setup holds, it could indicate a developing uptrend for HBAR, especially if the ADX continues to climb above 25.
The combination of rising bullish momentum and weakening selling pressure is a positive technical signal, suggesting that Hedera may be gearing up for further upside in the short term.
Hedera Ichimoku Cloud Shows A Bullish Setup
Hedera’s Ichimoku Cloud chart is flashing a bullish signal. After a strong move upward, price action broke above the red cloud (Kumo).
This breakout places the candles above both the Tenkan-sen (blue line) and the Kijun-sen (red line), which is generally seen as a sign of bullish momentum and short-term trend strength.
The cloud ahead has also started to thin, suggesting that resistance may be weakening. If momentum holds, further upside is more achievable.
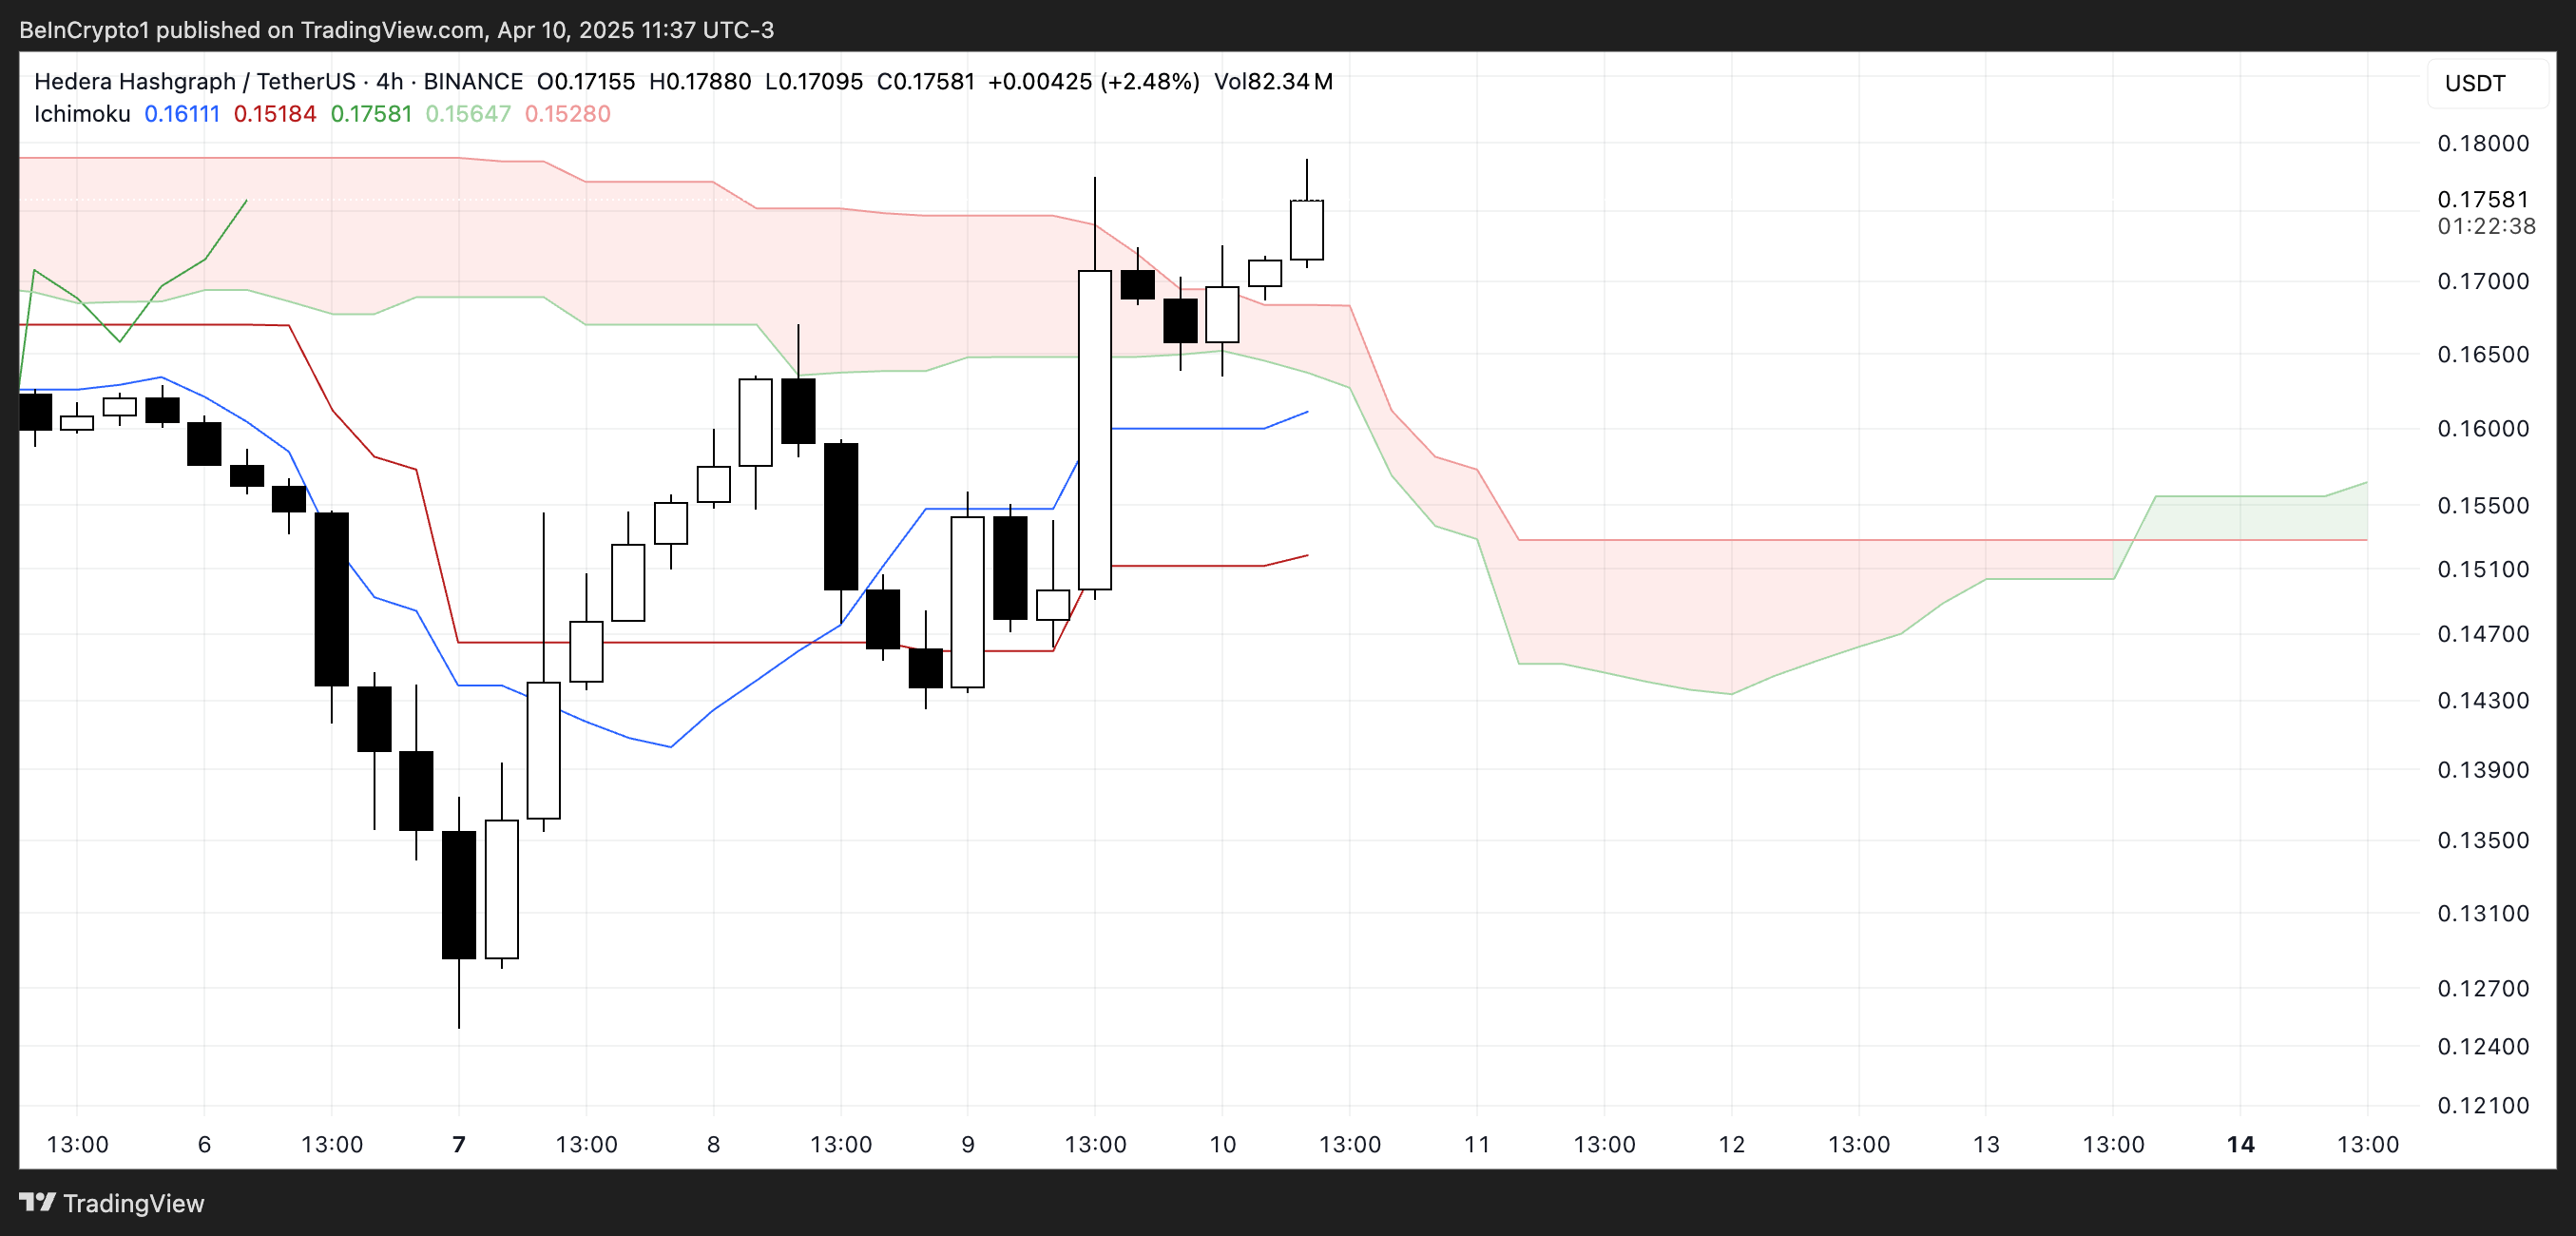
The Chikou Span (lagging green line) is now positioned above the price candles and the cloud, reinforcing the bullish bias. However, with the cloud still showing a mostly flat and narrow structure, the current trend doesn’t yet show strong continuation signals.
If the price remains above the cloud and the Tenkan-sen continues to lead above the Kijun-sen, Hedera could sustain this upward trajectory.
But traders should watch closely for any signs of a reversal back into or below the cloud, which would weaken the bullish setup.
Hedera Could Surge Soon If The Golden Cross Emerges
Hedera’s EMA lines are tightening, signaling a potential breakout. A golden cross—where short-term EMAs move above long-term ones—appears to be forming, which would typically indicate a bullish trend reversal.
If confirmed, this setup could push Hedera price toward resistance levels at $0.18 and $0.20, and if the momentum holds, even higher targets like $0.21 and $0.258 may come into play.
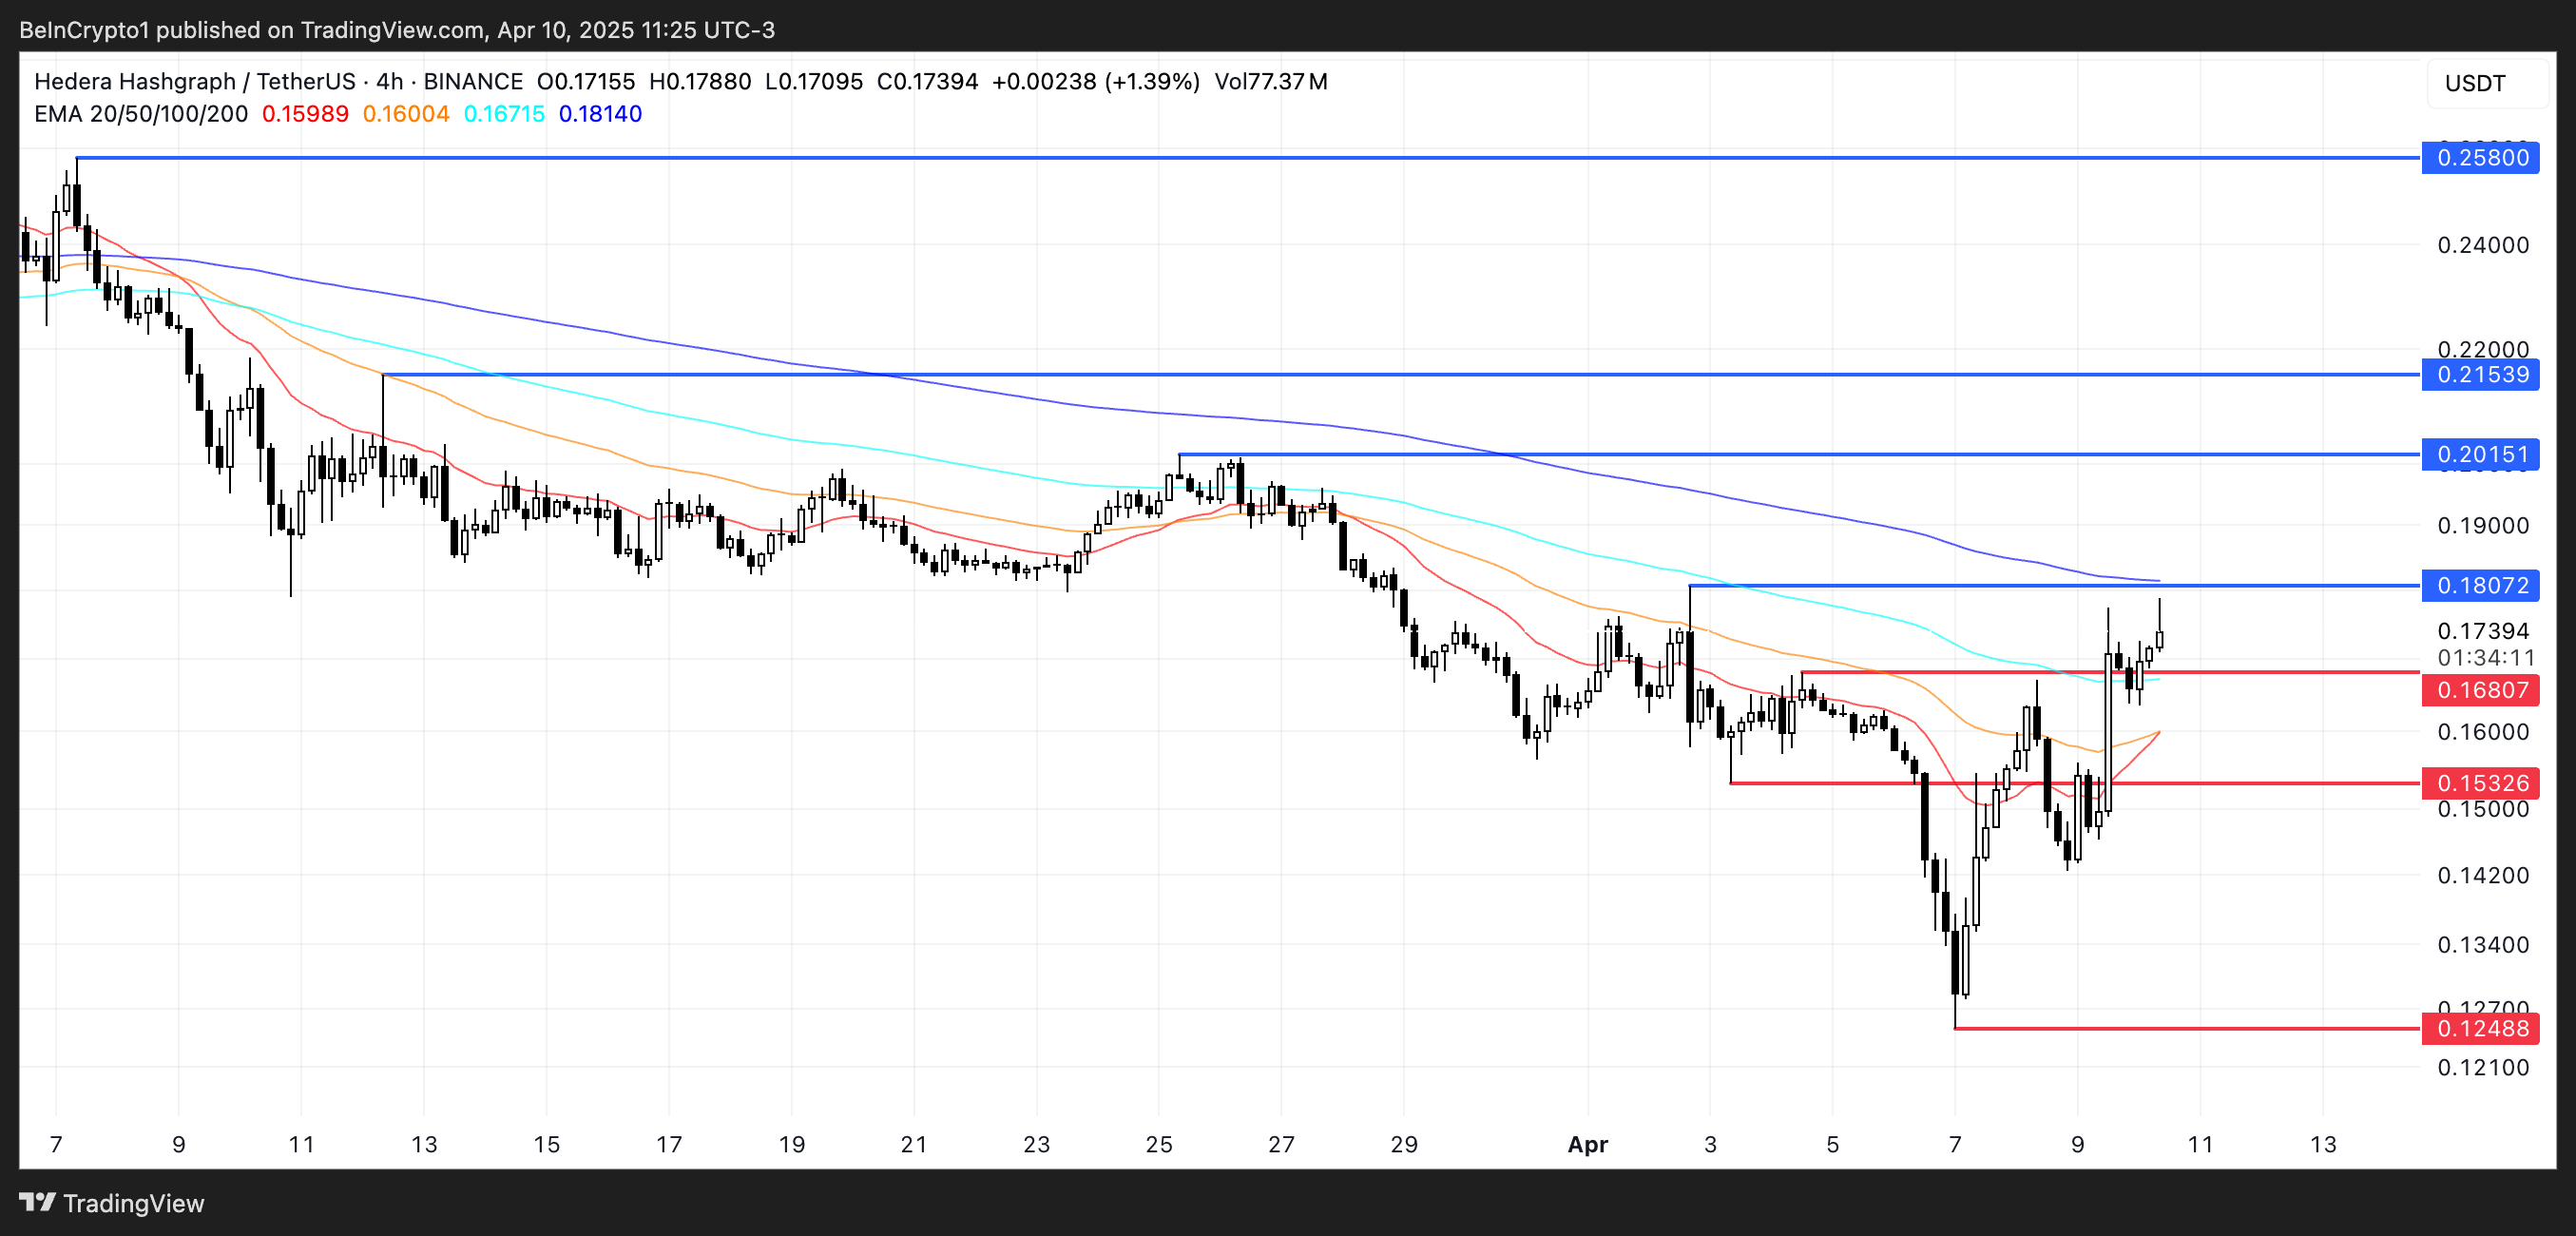
However, this bullish scenario hinges on a successful break above the immediate resistance. If HBAR fails to clear the $0.18 level, it could trigger a pullback toward the support at $0.168.
Losing that support would likely expose Hedera to further downside. The next key levels are $0.153 and possibly below $0.13 if selling pressure intensifies.
Disclaimer
In line with the Trust Project guidelines, this price analysis article is for informational purposes only and should not be considered financial or investment advice. BeInCrypto is committed to accurate, unbiased reporting, but market conditions are subject to change without notice. Always conduct your own research and consult with a professional before making any financial decisions. Please note that our Terms and Conditions, Privacy Policy, and Disclaimers have been updated.


Reason to trust
![]()
Strict editorial policy that focuses on accuracy, relevance, and impartiality
Created by industry experts and meticulously reviewed
The highest standards in reporting and publishing
Strict editorial policy that focuses on accuracy, relevance, and impartiality
Morbi pretium leo et nisl aliquam mollis. Quisque arcu lorem, ultricies quis pellentesque nec, ullamcorper eu odio.
A crypto analyst has presented a compelling case, suggesting that the XRP price may be closely mirroring Bitcoin’s historical macro action. By comparing its multi-year chart patterns and market behaviour, the analyst argues that XRP may be gearing up for a significant price rally to $71 and beyond.
XRP Price Traces Bitcoin Path To Reach $71
TradingView crypto analyst RizeSenpai has forecasted that XRP could surge explosively to $71. At its current market price, this would represent a staggering 3,281% increase.
Related Reading
The TradingView expert conducted a detailed comparative analysis, drawing striking similarities between Bitcoin’s breakout from its multi-year accumulation range in 2015-2017 and XRP’s current price structure. He points out that XRP’s movements since it was listed on Poloniex in 2014 have closely mirrored Bitcoin’s macro price action but at a slower rate, estimated at 65%.
For emphasis, the price chart shows that Bitcoin experienced a sharp surge of 5,424% after consolidating between 2013 and 2016 and finally breaking out in 2017. Similarly, XRP had a big rise in 2017 but has since been stuck trading within a large multi-year range for nearly six years as of the end of 2022.
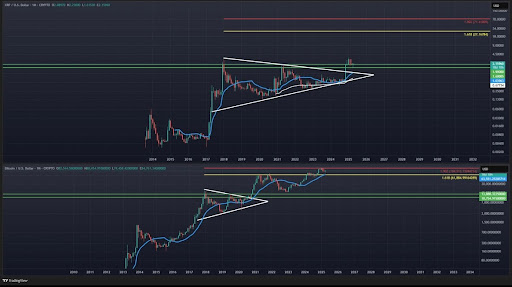
Recently, XRP broke out of its long-term price range and has been consolidating above its old all-time high resistance for several months. Considering its current price action, the analyst assumes that the asset may be attempting to move toward new breakout levels.
The TradingView analyst has highlighted the potential for XRP to surge toward a more realistic target of $27 – $30, near the 1.618 Fibonacci Extension level. For reference, he shared a chart comparing Bitcoin’s past bull market breakout and performance with XRP’s current breakout and future price action.
The chart reveals that when BTC broke out, it surged toward the 1.618 Fibonacci level at $61,800 before initiating a secondary run that topped at the 1.902 HOP level. As a result, RizeSenpai predicts that if XRP can completely mirror Bitcoin’s performance, it could skyrocket to $27, potentially reaching as high as $71, where the 1.902 HOP level lies.
The Token To Surge Above $71 To $120
As mentioned earlier, XRP is still trading within a multi-year range breakout similar to Bitcoin’s in its past cycle. As of writing, XRP’s price sits at $2.13, having declined by more than 11% over the last month.
Related Reading
Notably, if the altcoin replicates the breakout momentum previously seen in Bitcoin, RizeSenpai predicts an explosive 5,400% increase, pushing its price to a very ambitious target of $120.94. This suggests that the TradingView analyst believes that XRP could exceed its previously projected target of $71 and climb past $120.
Adding to the weight of this bullish forecast is the presence of a monthly Moving Average Convergence Divergence (MACD) Hidden Bullish Divergence. This technical indicator is often associated with an uptrend continuation and potential upside momentum.
Featured image from Adobe Stock, chart from Tradingview.com

Ondo Finance (ONDO) is showing renewed strength, up more than 4% in the last 24 hours, with trading volume jumping nearly 13% following the collapse of MANTRA’s OM token. This shift in capital appears to be favoring other RWA-focused projects like ONDO, which is now gaining momentum across several technical indicators.
A golden cross has just formed on the EMA lines, while both the DMI and CMF suggest growing bullish pressure and fading selling interest. As sentiment recovers, ONDO could be gearing up for a breakout toward the $1.20 mark if key resistance levels are cleared.
ONDO DMI Chart Shows Buyers Are In Control
ONDO’s DMI (Directional Movement Index) chart shows that its ADX has declined to 28, down from 36 two days ago, indicating that the strength of the recent trend is beginning to fade.
While an ADX value above 25 still suggests a solid trend is in place, the drop reflects weakening momentum after a period of strong directional movement.
This shift could mean the market is entering a phase of consolidation or hesitation as traders reassess ONDO’s next move.
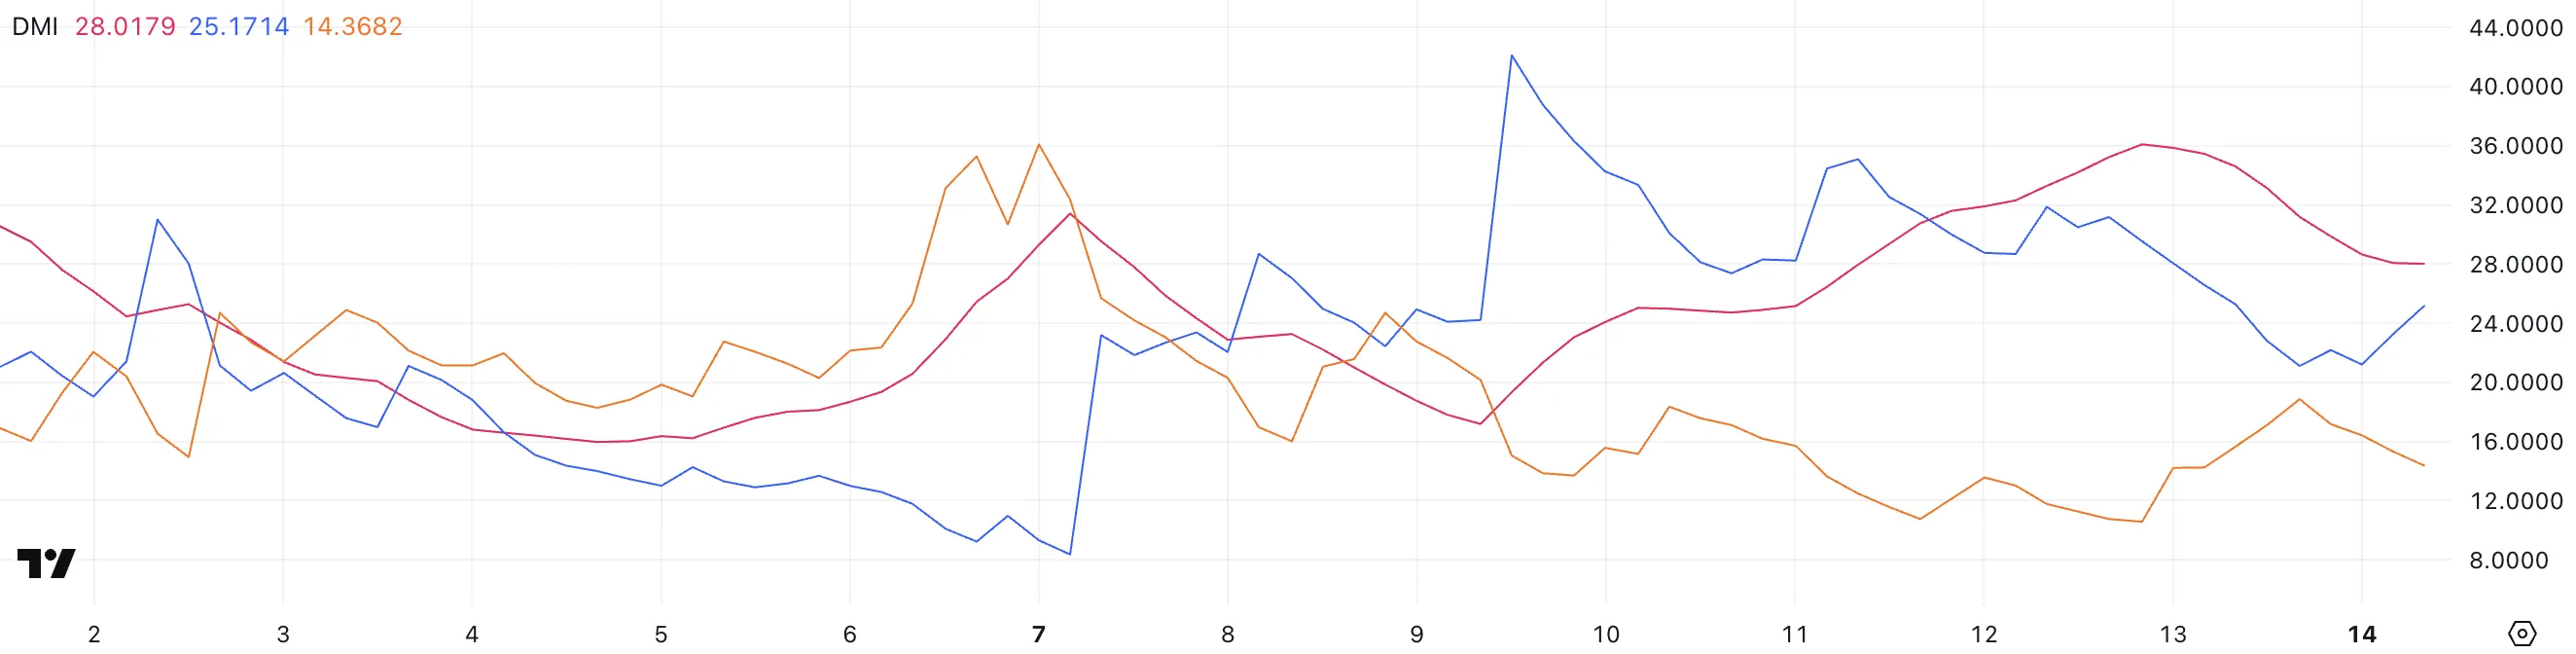
The +DI (positive directional index), which tracks upward price pressure, is currently at 25.17—up from 21.1 yesterday but still down from 31.18 two days ago.
Meanwhile, the -DI (negative directional index), which measures downward pressure, has dropped to 14.36 from 18.86 yesterday, though it remains higher than its 10.56 reading from two days ago.
This combination suggests that bullish pressure is regaining some ground in the short term, even as the overall trend strength cools off.
For ONDO, this could mean a potential recovery attempt is forming, but unless ADX stabilizes or rises again, the trend may remain fragile and susceptible to quick reversals.
ONDO CMF Is Growing After Touching -0.17
ONDO’s Chaikin Money Flow (CMF) is currently at -0.06, a sharp recovery from -0.17 just one day ago.
The CMF is a volume-based indicator that measures the buying and selling pressure of an asset over time, using both price movement and trading volume.
Values above 0 indicate net buying pressure, while values below 0 reflect net selling pressure, helping to gauge the strength of market sentiment.
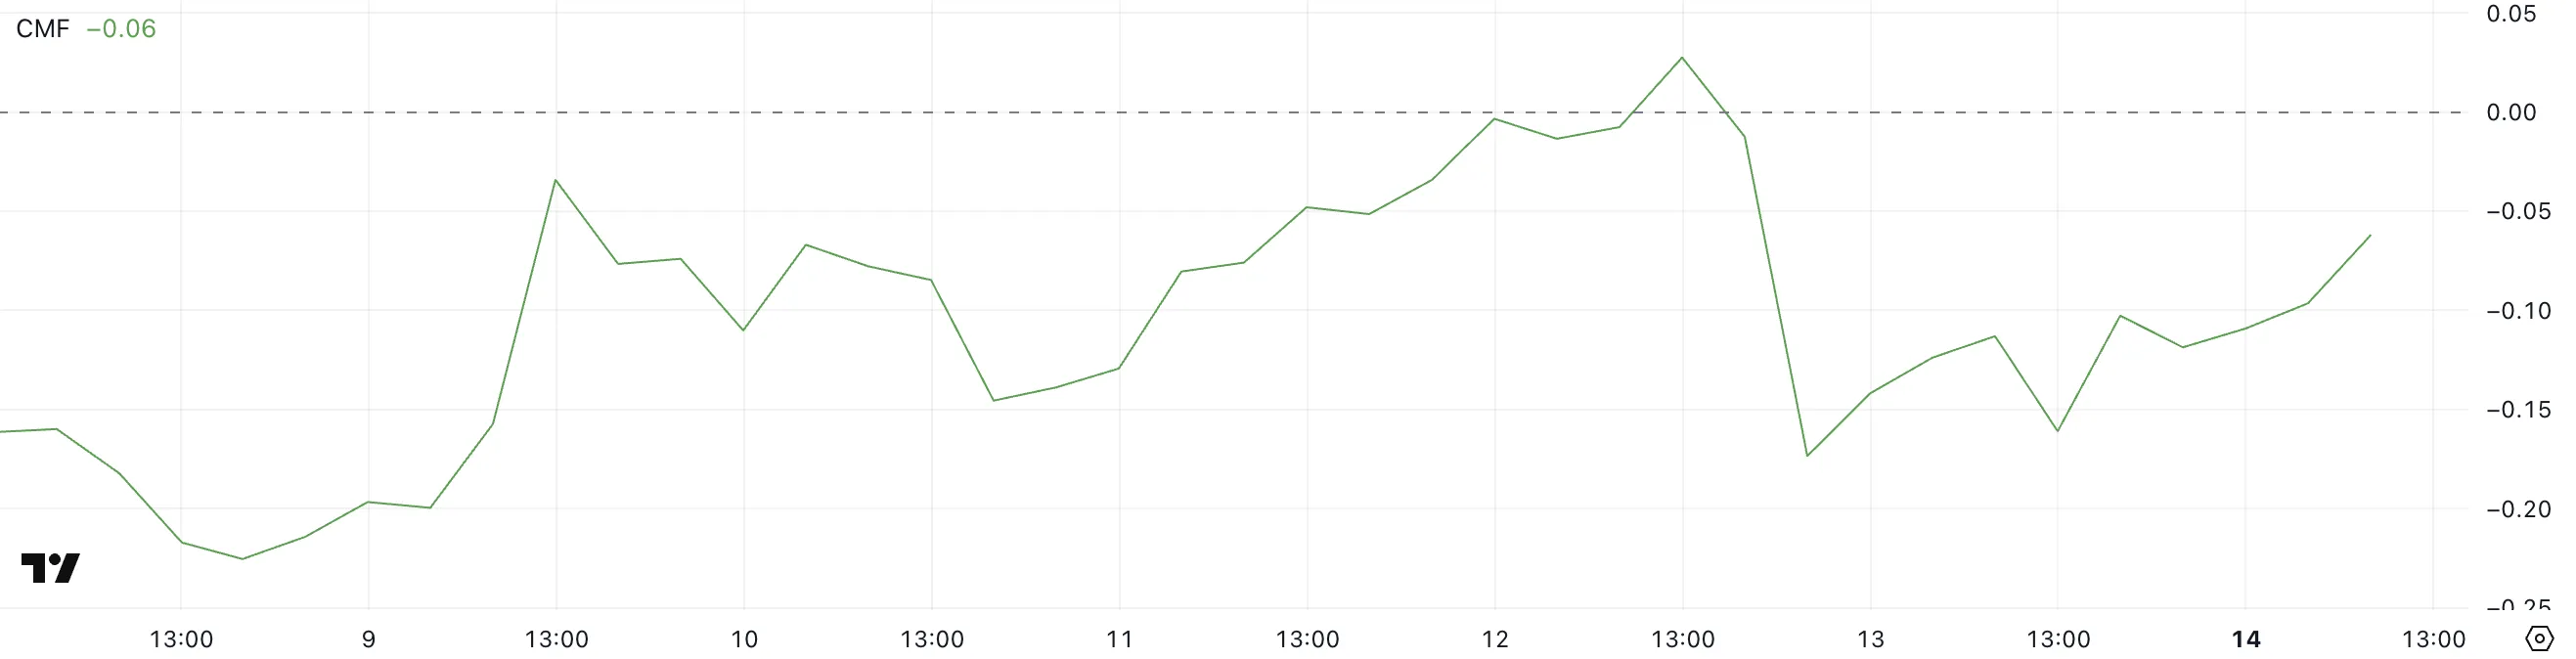
Although ONDO’s CMF remains slightly negative, the rapid shift toward the zero line suggests that selling pressure has significantly weakened, and buying interest may be starting to return.
This surge could be linked to a shift in investor sentiment following the collapse of MANTRA’s OM token, as capital may be rotating to other RWA coins like ONDO.
While the current CMF still shows a cautious tone, the upward move signals improving market confidence that, if sustained, could support a further price recovery.
Will ONDO Reclaim $1.20 Soon?
ONDO’s EMA lines have just formed a golden cross, a bullish signal that often marks the beginning of a fresh upward trend.
This technical development suggests growing upward momentum, with a potential test of the $0.956 resistance level likely in the near term.
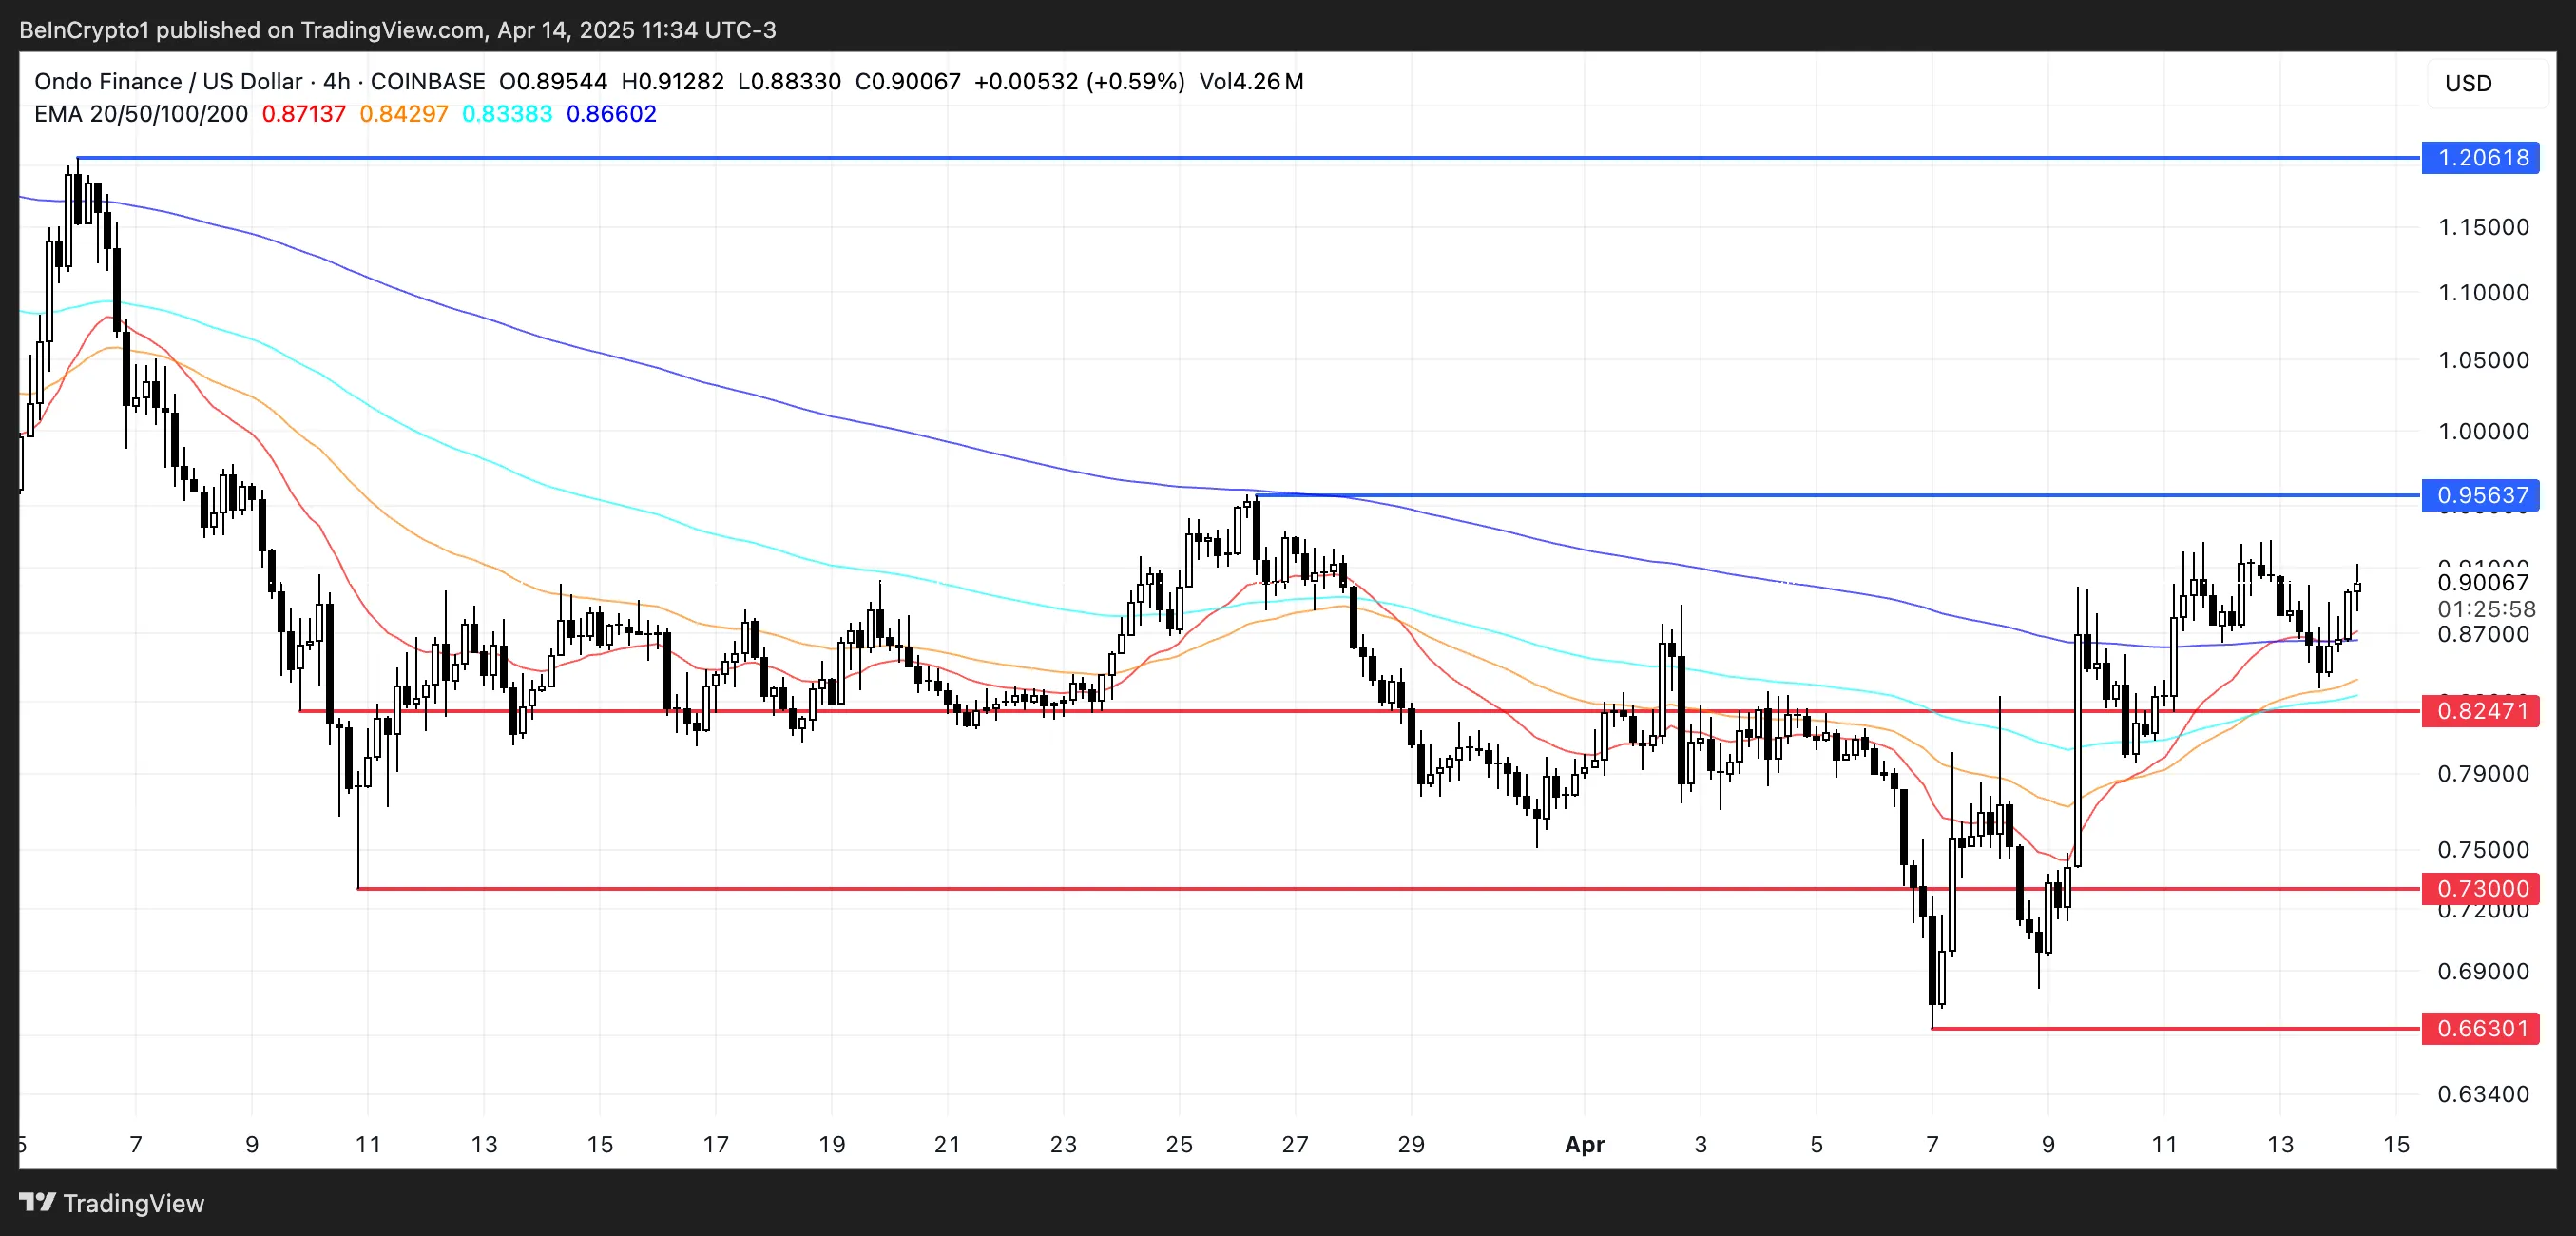
If that resistance is broken, ONDO could gain further traction and rally toward the $1.20 mark, reinforcing bullish sentiment and drawing in more buyers.
If the RWA coin fails to maintain its current momentum and the price drops below the key support at $0.82, selling pressure could intensify.
A breakdown below that level could lead to a deeper correction toward $0.73, and if that zone doesn’t hold, it may slide further to $0.66.
Disclaimer
In line with the Trust Project guidelines, this price analysis article is for informational purposes only and should not be considered financial or investment advice. BeInCrypto is committed to accurate, unbiased reporting, but market conditions are subject to change without notice. Always conduct your own research and consult with a professional before making any financial decisions. Please note that our Terms and Conditions, Privacy Policy, and Disclaimers have been updated.

Story (IP) and The AI Prophecy (ACT) token saw a massive 20% crash and subsequent rebound earlier today. The exact trigger is unclear, but the pattern has been linked to high trade volumes on Binance Futures.
Despite the recovery, the sudden drops were concerning, as MANTRA’s OM token crashed 90% yesterday, and its co-founder blamed Binance.
ACT and IP, two largely unrelated token projects, saw similar patterns of crashing and rebounding at the same time. The exact trigger is unclear, but the pattern has been linked to high trade volumes on Binance Futures.
Why Did ACT and IP Suddenly Crash and Rebound?
Binance Futures is a popular trading platform launched by the world’s largest crypto exchange, and its listings can spike the prices of various assets.
Today, however, the community is left with many questions, as speculation on Binance Futures apparently caused ACT and IP to tank in price.
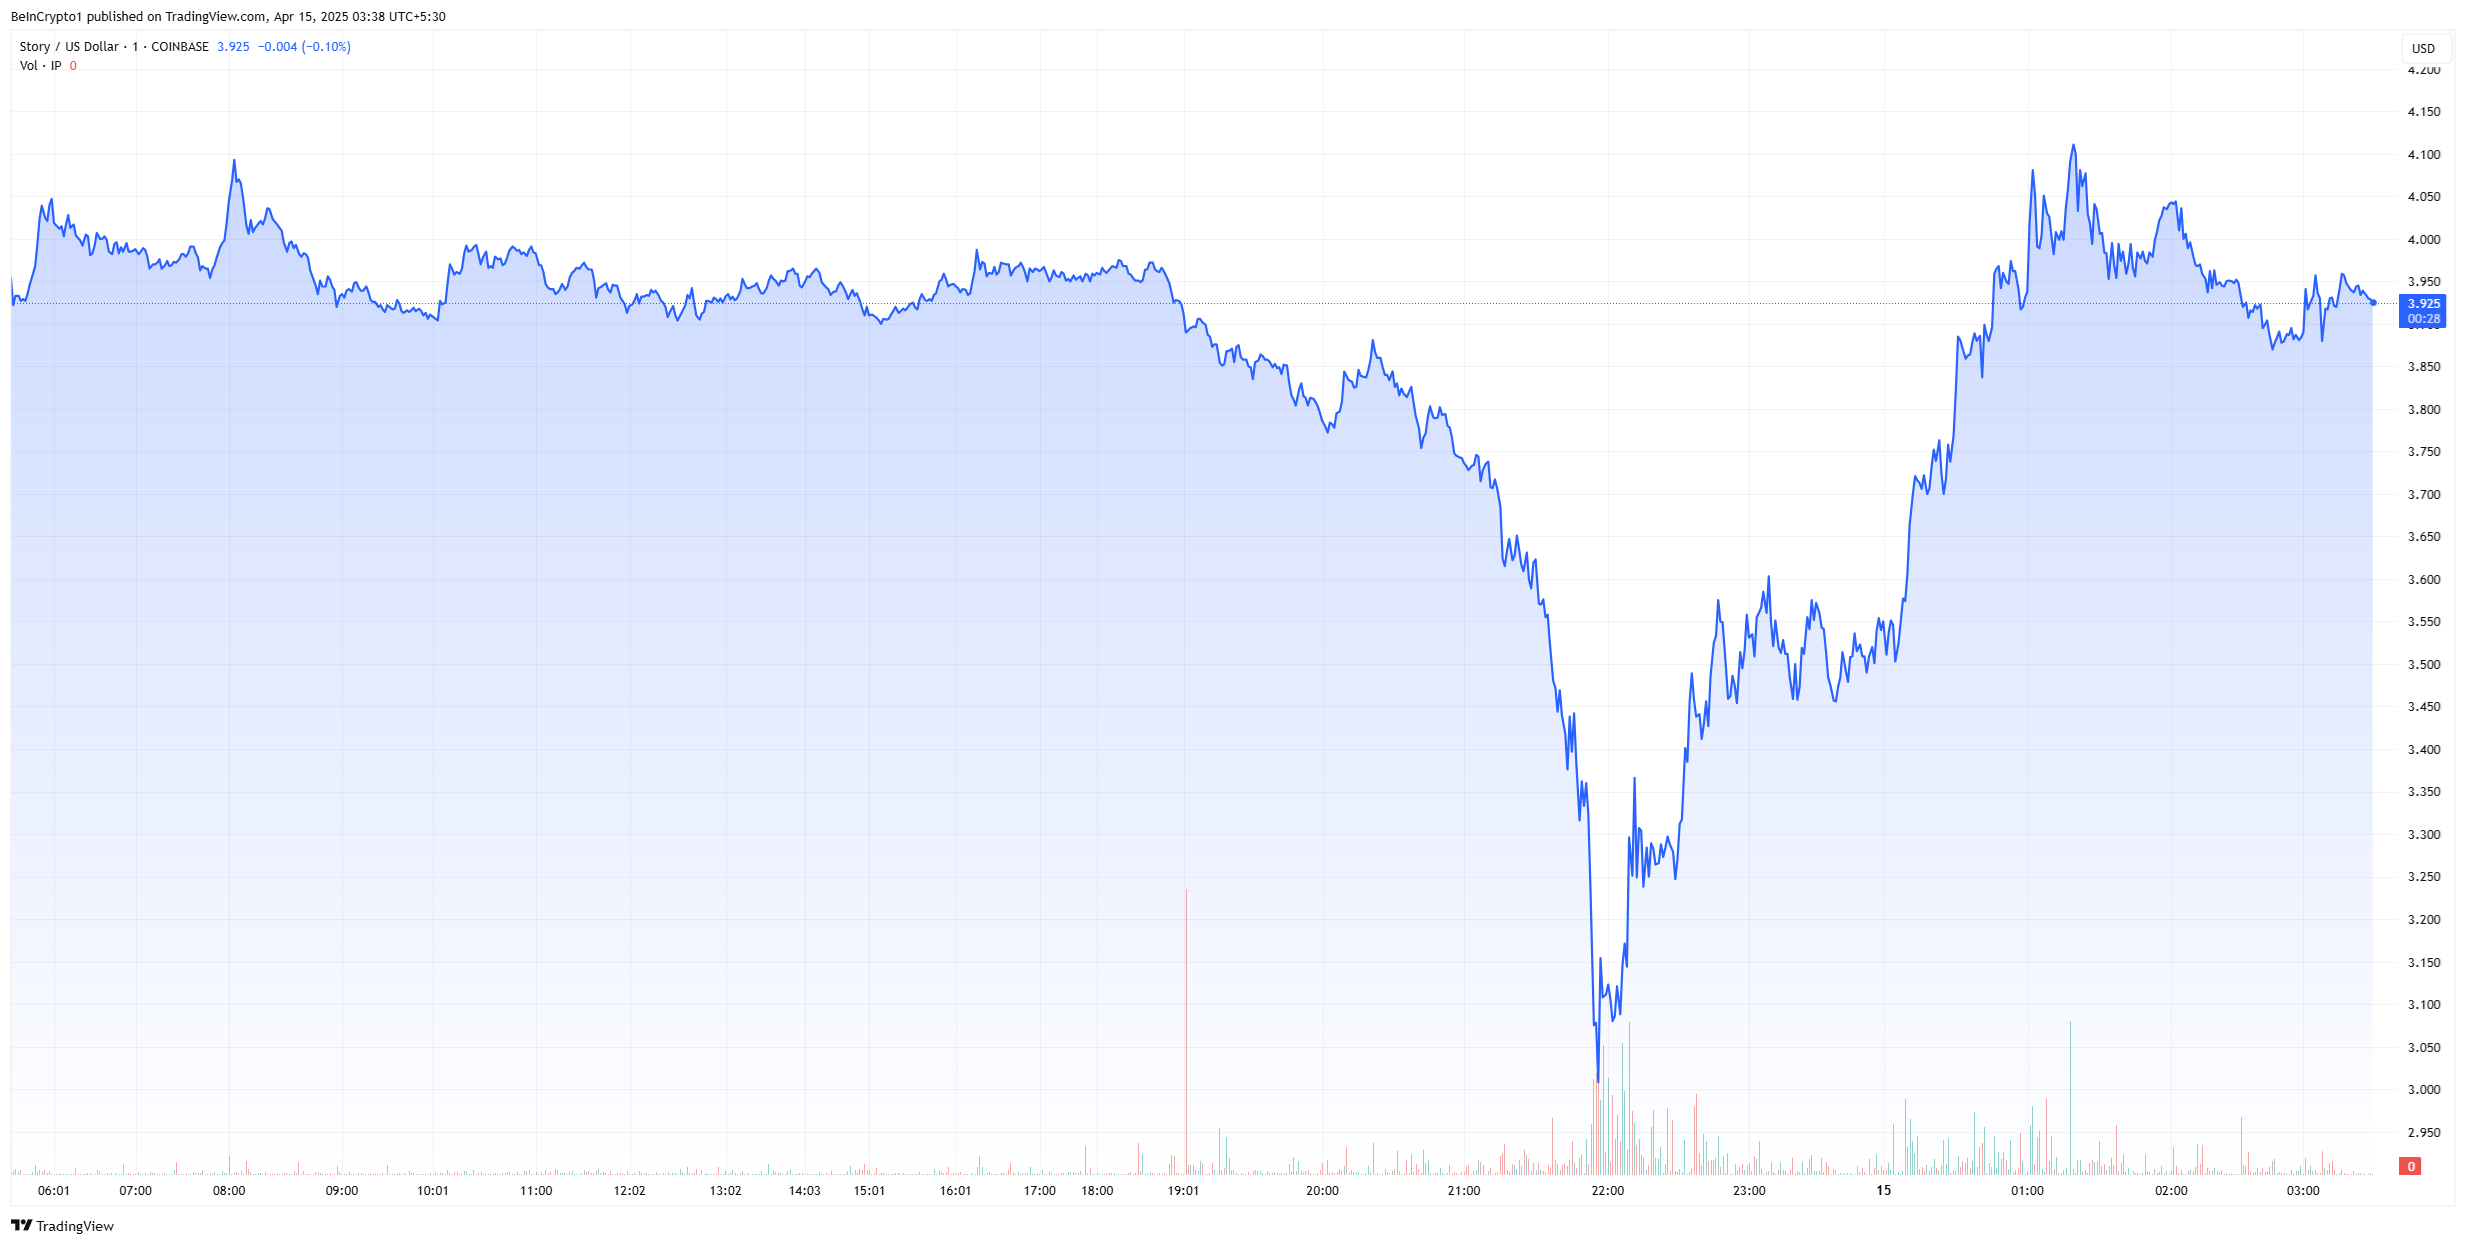
ACT is an AI token, and IP aims to put intellectual property on the blockchain. Both of these tokens plummeted rapidly, by 27% and 21.5%, respectively.
However, they both managed to shoot back up after, with ACT even having a net 24-hour growth of 2.5%. IP has been a top-performing asset for several months, and its sudden drop sparked fear among holders. The subsequent recovery suggested the volatility was short-term.
According to Coinglass data, over 1.27 million ACT futures trades were executed on Binance—more than double the second-highest exchange, BingX. Binance also holds over $20.4 million in ACT futures open interest.
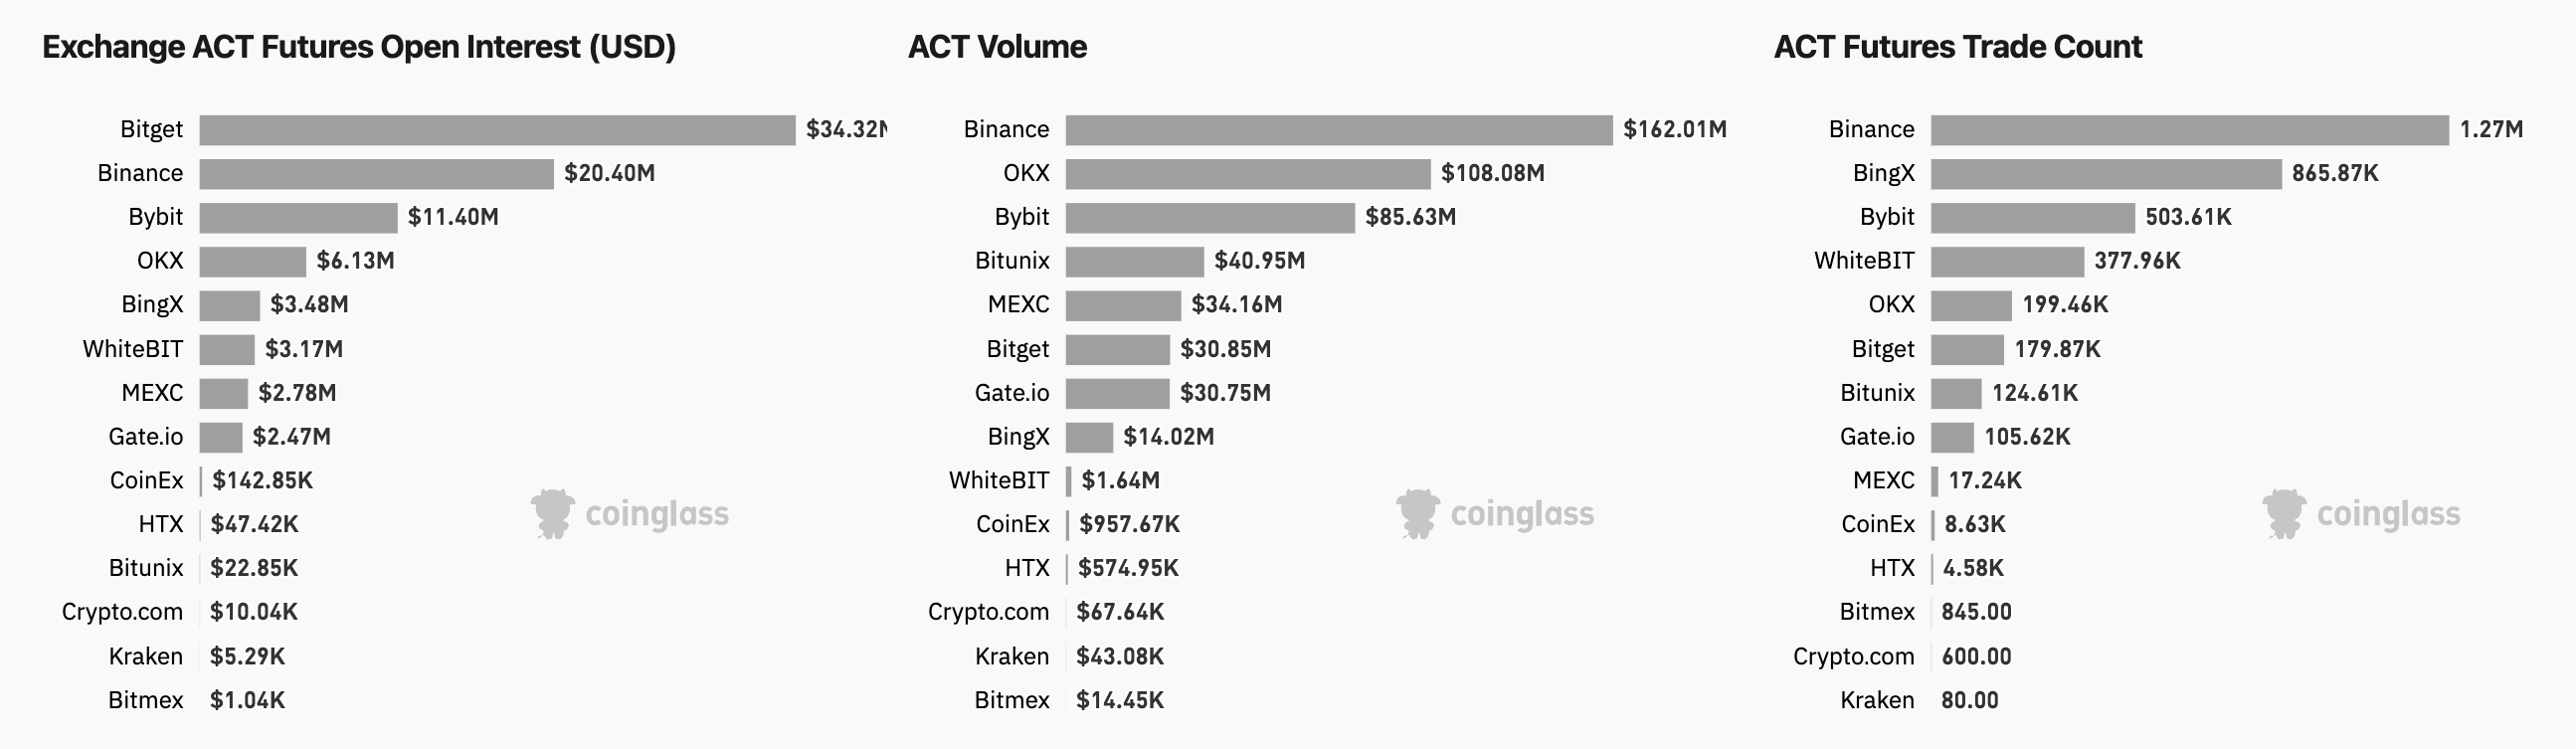
This concentration makes Binance a critical price discovery engine. When large positions are quickly liquidated—often triggered by stop-losses, margin calls, or algorithmic trading—it can create an outsized impact on underlying token prices.
Futures markets now frequently surpass spot markets in volume and velocity. While this enhances liquidity, it also increases fragility.
A liquidation cascade—where long positions are forcefully closed due to declining prices—can accelerate downward momentum. Today’s synchronized drop in both IP and ACT suggests that excessive leverage and crowded positions may have triggered such a cascade on Binance.
These moves reaffirm that token prices, particularly for emerging or mid-cap assets, are increasingly shaped by derivatives markets. As more projects are listed on futures platforms early, volatility driven by short-term positioning rather than long-term value creation is becoming the norm.
Disclaimer
In adherence to the Trust Project guidelines, BeInCrypto is committed to unbiased, transparent reporting. This news article aims to provide accurate, timely information. However, readers are advised to verify facts independently and consult with a professional before making any decisions based on this content. Please note that our Terms and Conditions, Privacy Policy, and Disclaimers have been updated.

Is The XRP Price Mirroring Bitcoin’s Macro Action? Analyst Maps Out How It Could Get To $71
Ondo Finance (ONDO) Rises 3.5% Following MANTRA Crash

Binance Futures Causes a Brief Crash For Story (IP) and ACT

XRP Jumps 22% in 7 Days as Bullish Momentum Builds

Ethereum Price Threatened With Sharp Drop To $1,400, Here’s Why

Cardano (ADA) Eyes Rally as Golden Cross Signals Momentum

2.52 Million Altcoins Are Ruining Crypto’s Future

Animoca Brands Valuation Tanks 75% In Two Years, Here’s Why

Crypto exchange BingX hacked for $43 million

Are The Big Players Losing Interest?

Hong Kong’s Securities Association Tips Authorities On Crypto Self-Regulation

Coinbase cbBTC Set to go Live on Solana
2.52 Million Altcoins Are Ruining Crypto’s Future
Animoca Brands Valuation Tanks 75% In Two Years, Here’s Why
Crypto exchange BingX hacked for $43 million
Are The Big Players Losing Interest?
Hong Kong’s Securities Association Tips Authorities On Crypto Self-Regulation
Coinbase cbBTC Set to go Live on Solana
-

 Market24 hours ago
MANTRA’s OM Token Crashes 90% Amid Insider Dump Allegations
-
 Altcoin12 hours ago
XRP Price Climbs Again, Will XRP Still Face a Death Cross?
-

 Market17 hours ago
Bitcoin’s Price Under $85,000 Brings HODlers Profit To 2-Year Low
-
 Altcoin11 hours ago
Analyst Predicts Dogecoin Price Rally To $0.29 If This Level Holds
-

 Altcoin15 hours ago
Binance Breaks Silence Amid Mantra (OM) 90% Price Crash
-

 Market14 hours ago
XRP Outflows Cross $300 Million In April, Why The Price Could Crash Further
-

 Market13 hours ago
FLR Token Hits Weekly High, Outperforms Major Coins
-

 Bitcoin13 hours ago
Crypto Outflows Hit $795 Million On Trump’s Tariffs & Market Fear