Market
Hedera (HBAR) Bears Dominate, HBAR Eyes Key $0.15 Level

Hedera (HBAR) is under pressure, down roughly 13.5% over the past seven days, with its market cap holding at around $7 billion. Recent technical signals point to growing bearish momentum, with both trend and momentum indicators leaning heavily negative.
The price has been hovering near a critical support zone, raising the risk of a breakdown below $0.15 for the first time in months. Unless bulls regain control soon, HBAR could face further losses before any meaningful recovery attempt.
HBAR BBTrend Has Been Turning Heavily Down Since Yesterday
Hedera’s BBTrend indicator has dropped sharply to -10.1, falling from 2.59 just a day ago. This rapid decline signals a strong shift in momentum and suggests that HBAR is experiencing an aggressive downside move.
Such a steep drop often reflects a sudden increase in selling pressure, which can quickly change the asset’s short-term outlook.
The BBTrend, or Bollinger Band Trend, measures the strength and direction of a trend using the position of price relative to the Bollinger Bands. Positive values generally indicate bullish momentum, while negative values point to bearish momentum.

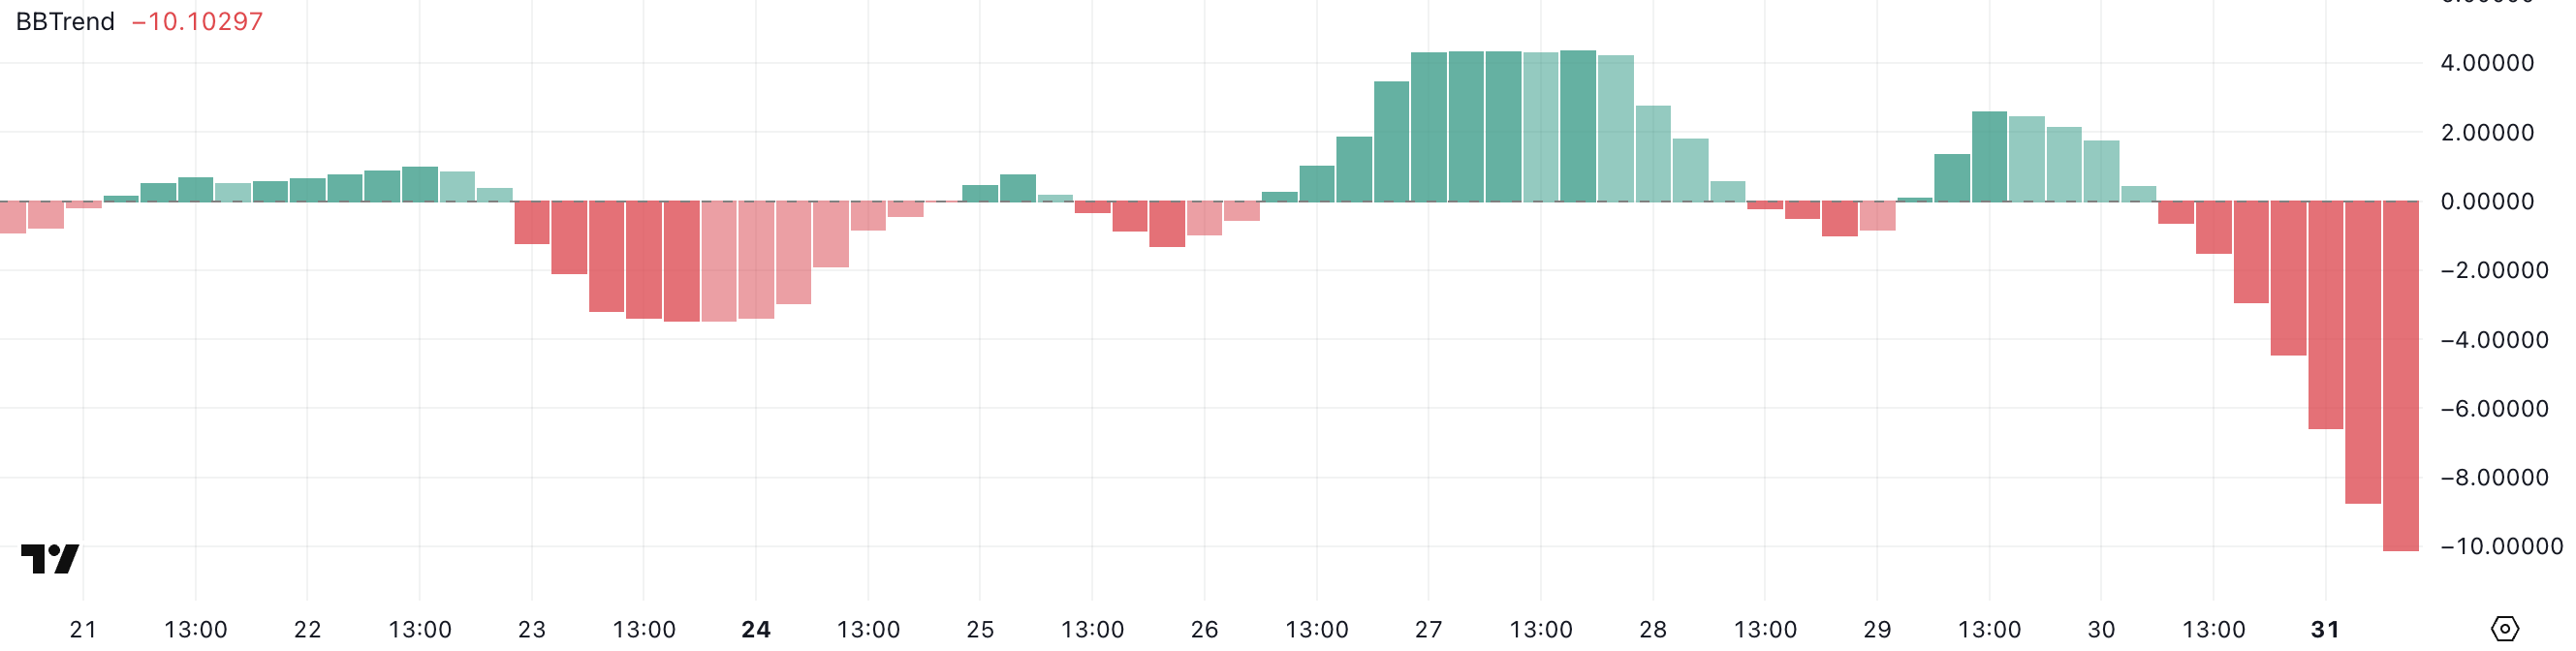
The further the value is from zero, the stronger the trend. HBAR’s BBTrend is now at -10.1, signaling strong bearish momentum.
This suggests that the price is trending lower and doing so with increasing strength, which could lead to further downside unless buyers step in to slow the momentum.
Hedera Ichimoku Cloud Paints a Bearish Picture
Hedera’s Ichimoku Cloud chart reflects a strong bearish structure, with the price action positioned well below both the blue conversion line (Tenkan-sen) and the red baseline (Kijun-sen).
This setup indicates that short-term momentum is clearly aligned with the longer-term downtrend.
The price has consistently failed to break above these dynamic resistance levels, signaling continued seller dominance.

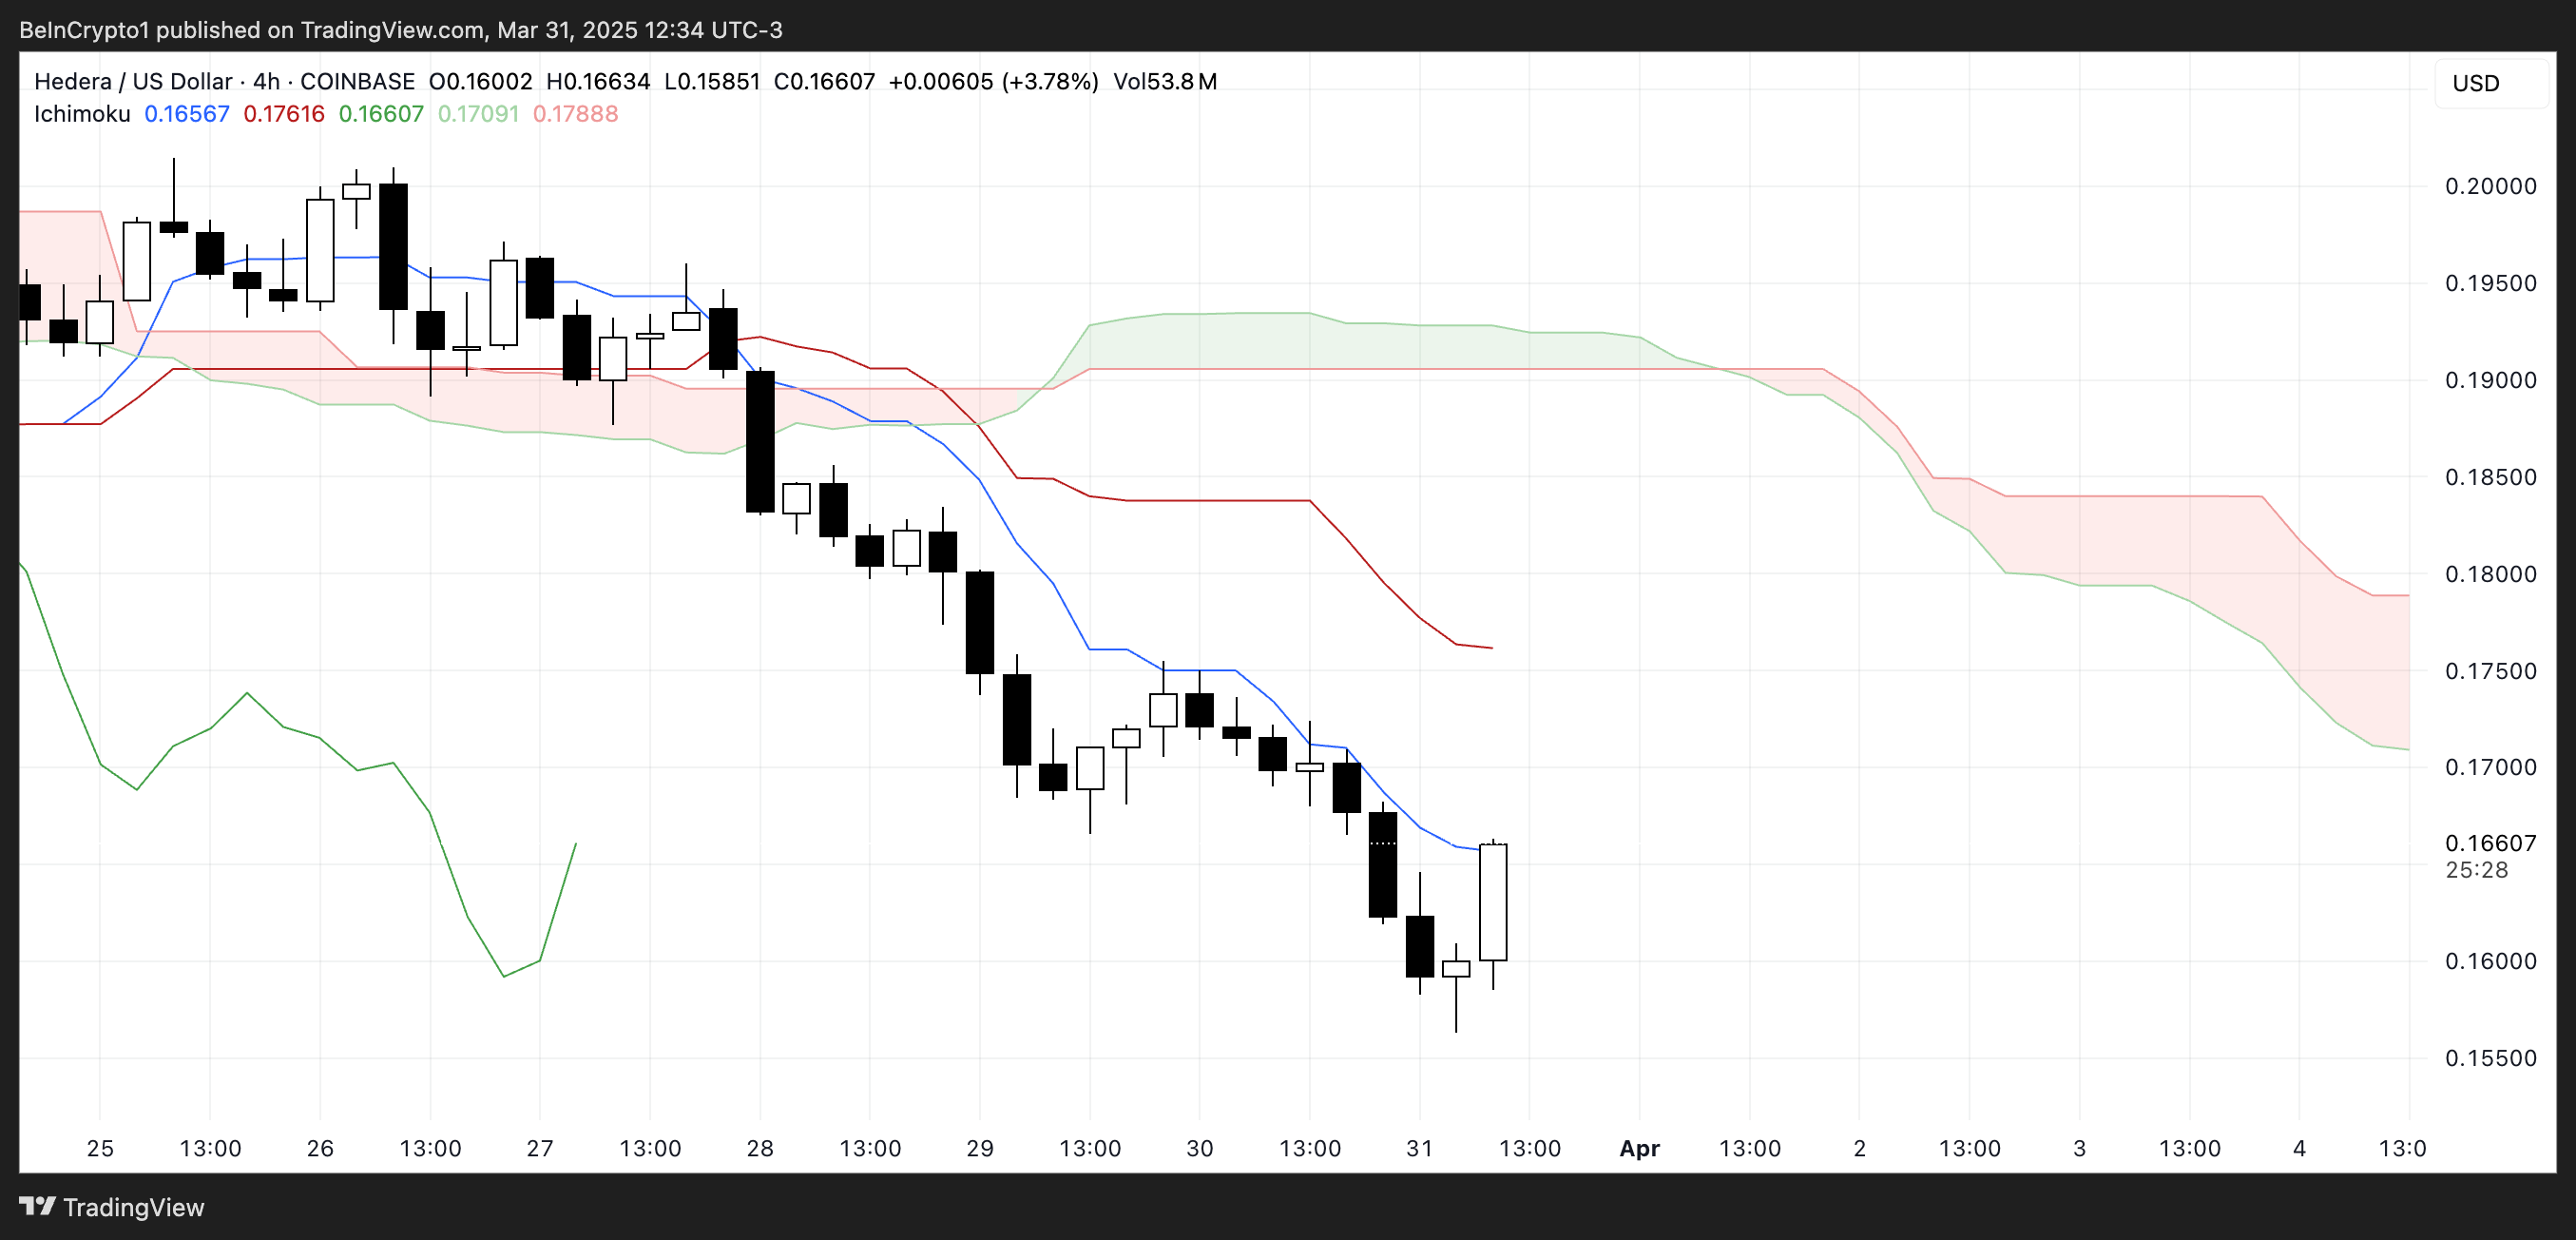
The future cloud is also red and trending downward, suggesting that bearish pressure is expected to persist in the near term.
The span between the Senkou Span A and B lines remains wide, reinforcing the strength of the downtrend. For any potential reversal to gain credibility, HBAR would first need to challenge and break above the Tenkan-sen and Kijun-sen, and eventually push into or above the cloud.
Until then, the current Ichimoku configuration supports a continuation of the bearish outlook.
Can Hedera Fall Below $0.15 Soon?
Hedera price has been hovering around the $0.16 level and is approaching a key support at $0.156.
If this support fails to hold, it could open the door for further downside, potentially pushing HBAR below the $0.15 mark for the first time since November 2024.
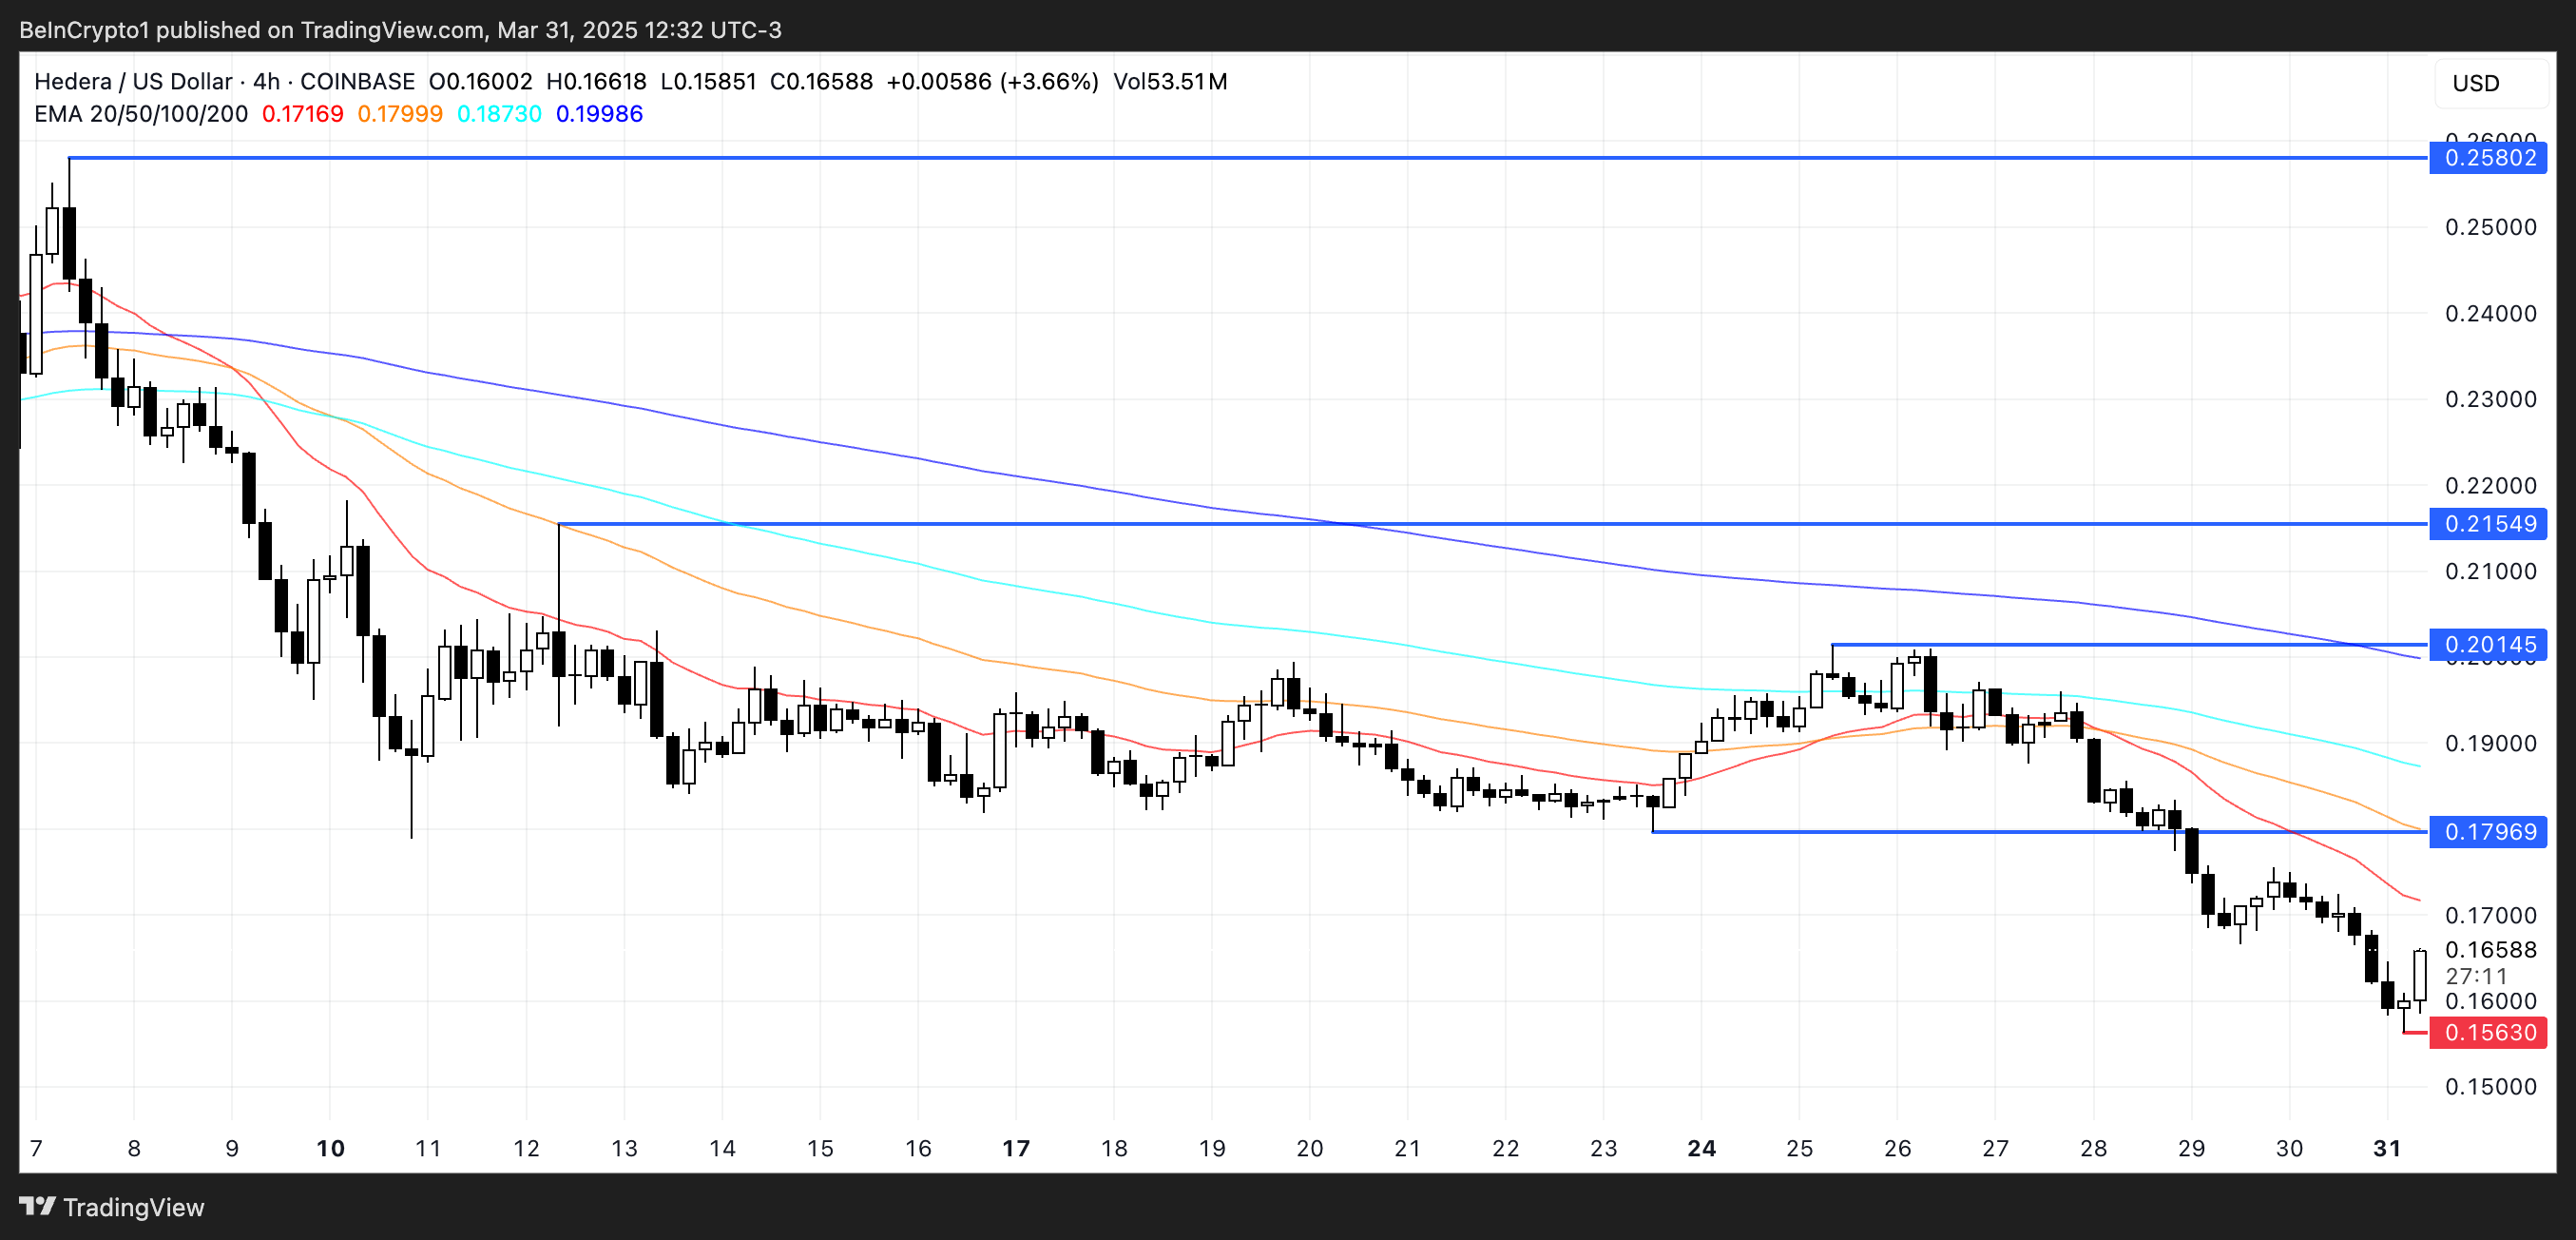
However, if HBAR manages to reverse its current trajectory and regain bullish momentum, the first target to watch is the resistance at $0.179.
A breakout above that level could lead to a stronger rally toward $0.20 and, if momentum continues, even reach $0.215. In a more extended bullish scenario, HBAR could climb to $0.25, signaling a full recovery and trend reversal.
Disclaimer
In line with the Trust Project guidelines, this price analysis article is for informational purposes only and should not be considered financial or investment advice. BeInCrypto is committed to accurate, unbiased reporting, but market conditions are subject to change without notice. Always conduct your own research and consult with a professional before making any financial decisions. Please note that our Terms and Conditions, Privacy Policy, and Disclaimers have been updated.