
Market
HBAR Buyers Fuel Surge with Golden Cross, Suggesting Upside

Hedera’s HBAR has bucked the broader market dip to record a slight 1% rally over the past 24 hours. As of this writing, the altcoin trades at $0.17.
This upward movement comes amidst signs of a resurgence in new demand for the altcoin, as highlighted by key technical indicators on the daily chart.
HBAR Bullish Trend Gains Strength
Readings from HBAR’s Moving Average Convergence Divergence (MACD) reveal that on April 9, the token’s MACD line (blue) climbed above its signal line (orange), forming a “golden cross.”
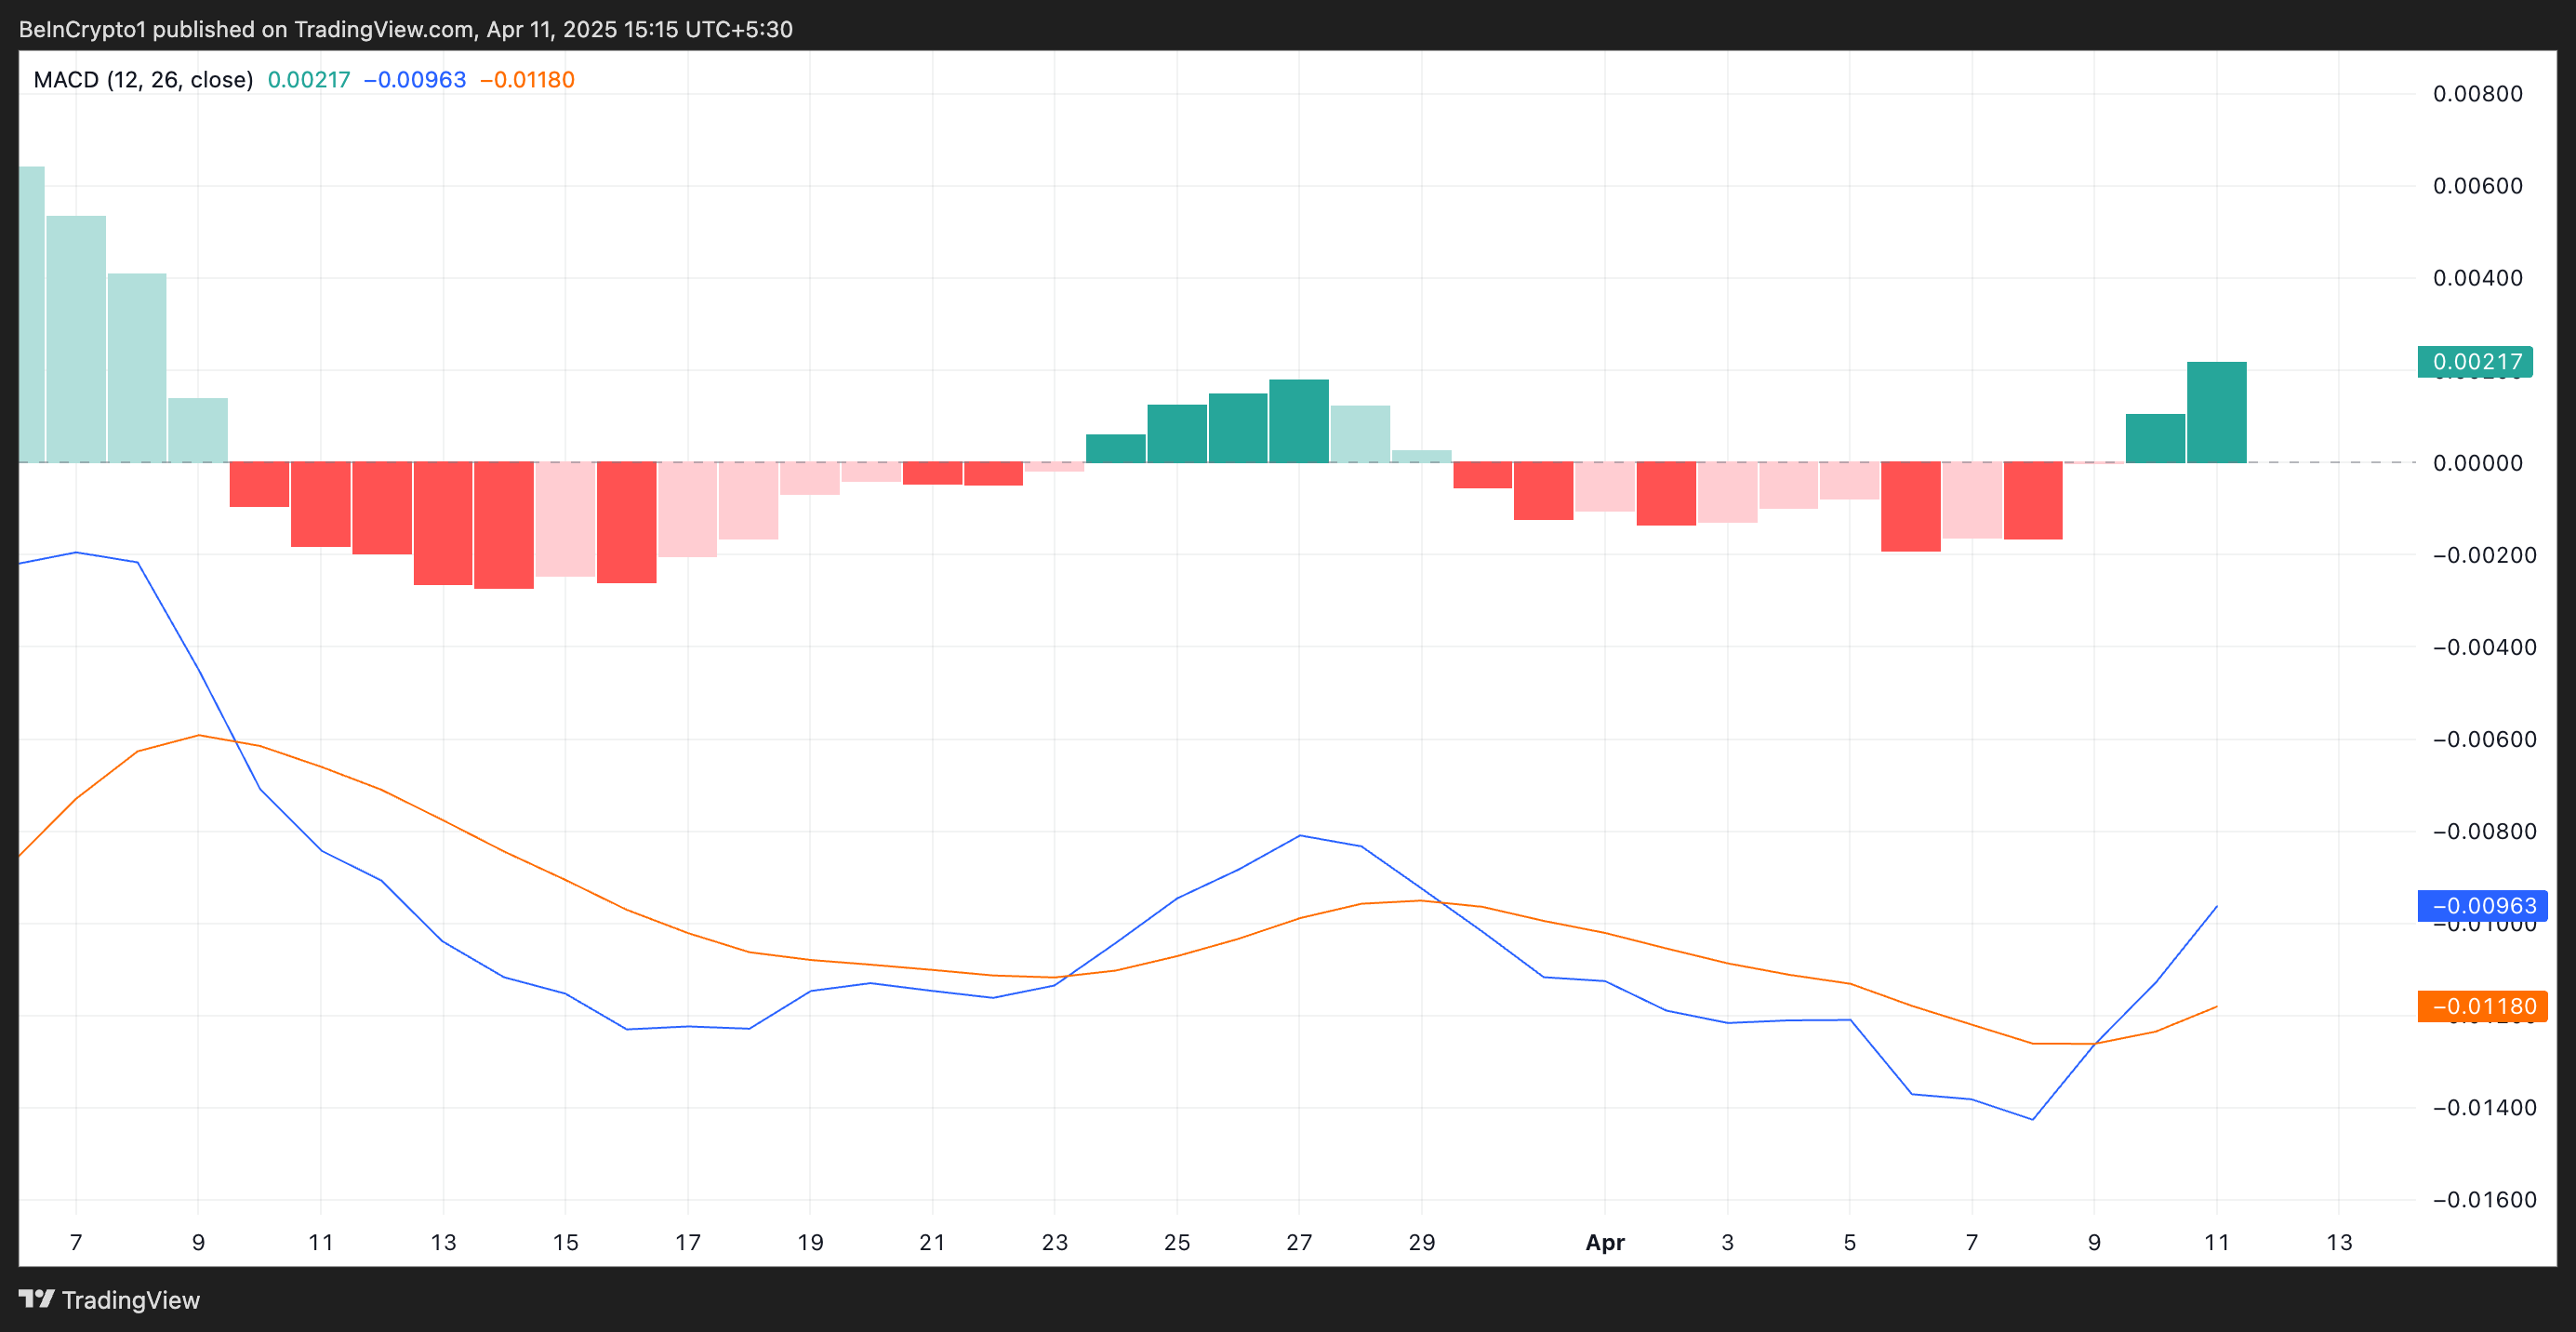
A golden cross occurs when the MACD line crosses above the signal line, signaling a potential bullish trend and increased buying pressure. This confirms that HBAR’s upward momentum is gaining strength, especially as investors commonly view this pattern as a buy signal.
Moreover, as of this writing, HBAR’s Relative Strength Index (RSI) is poised to break above the 50-neutral line, highlighting the spike in fresh demand for the altcoin. It is currently at 49.17 and remains in an uptrend.
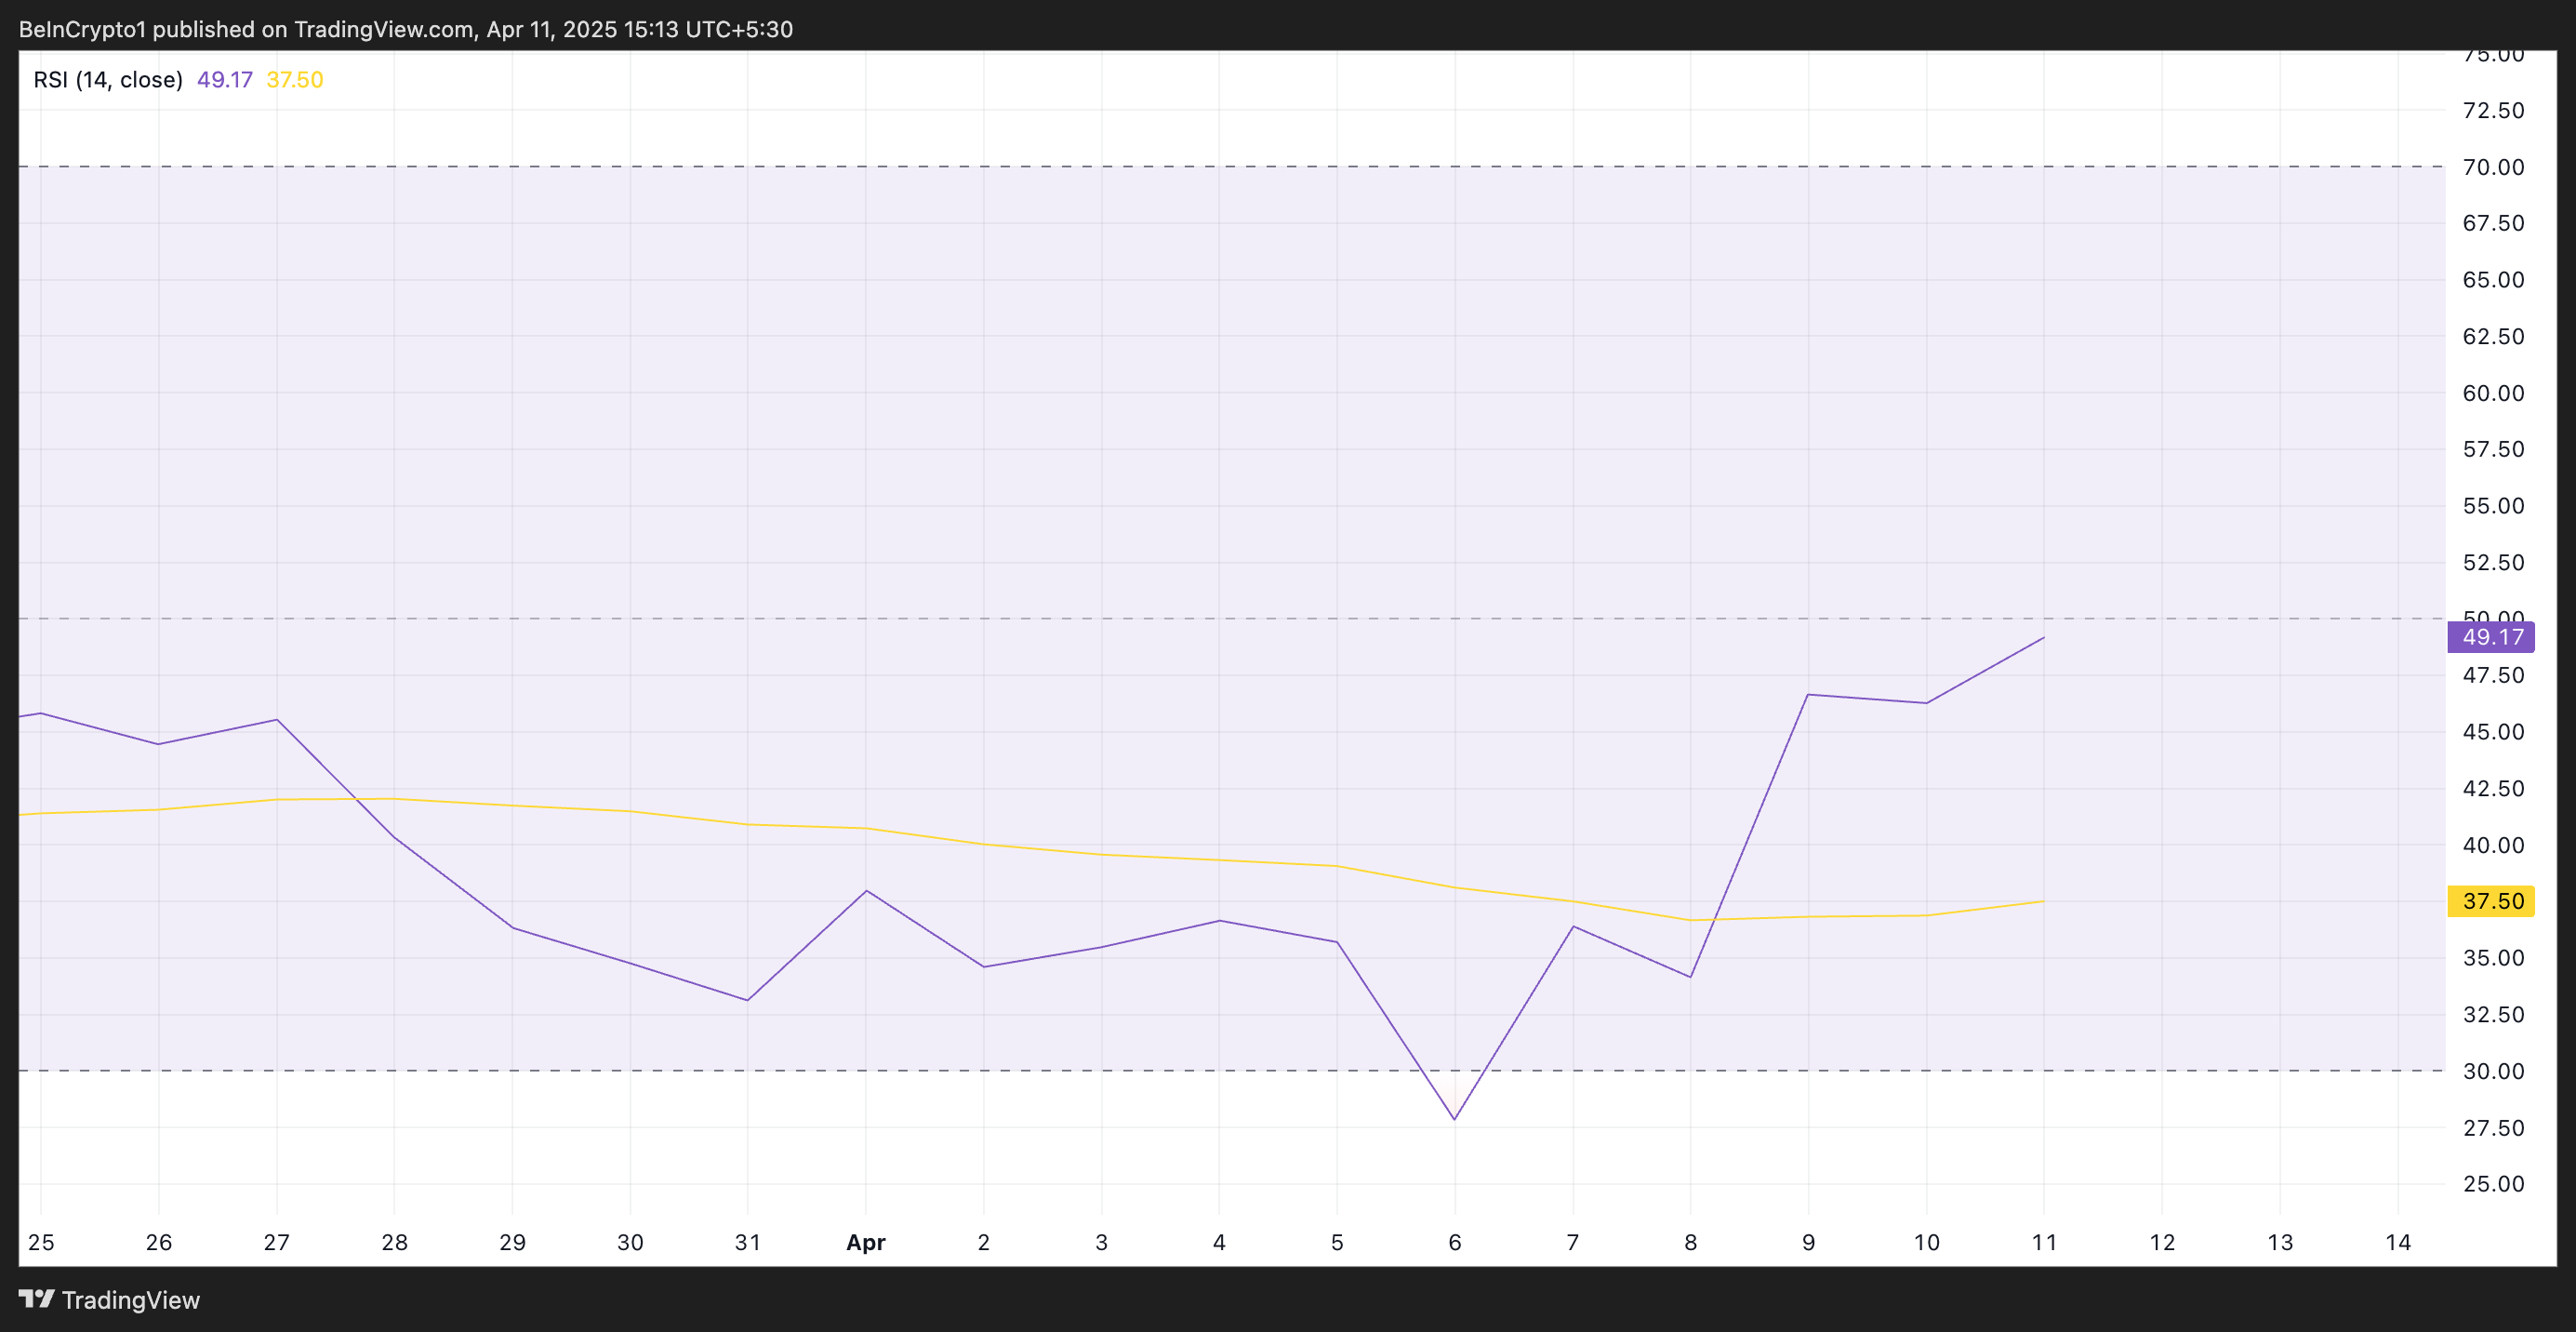
The RSI indicator measures an asset’s overbought and oversold market conditions. It ranges between 0 and 100. Values above 70 suggest that the asset is overbought and due for a price decline, while values under 30 indicate that the asset is oversold and may witness a rebound.
At 49.17 and climbing, HBAR’s RSI signals a gradual shift from bearish territory into a more neutral zone. If the altcoin’s RSI continues to rise above 50, it would signal increasing bullish sentiment, driving up HBAR’s value.
HBAR Eyes $0.19 Amid Strong Buying Pressure
HBAR’s surge over the past day has pushed its price above the key resistance formed at $0.16, which has kept the token in a downtrend since March 30.
With growing buying pressure, the token could flip this zone into a support floor. If successful, it could propel HBAR’s price to $0.19.
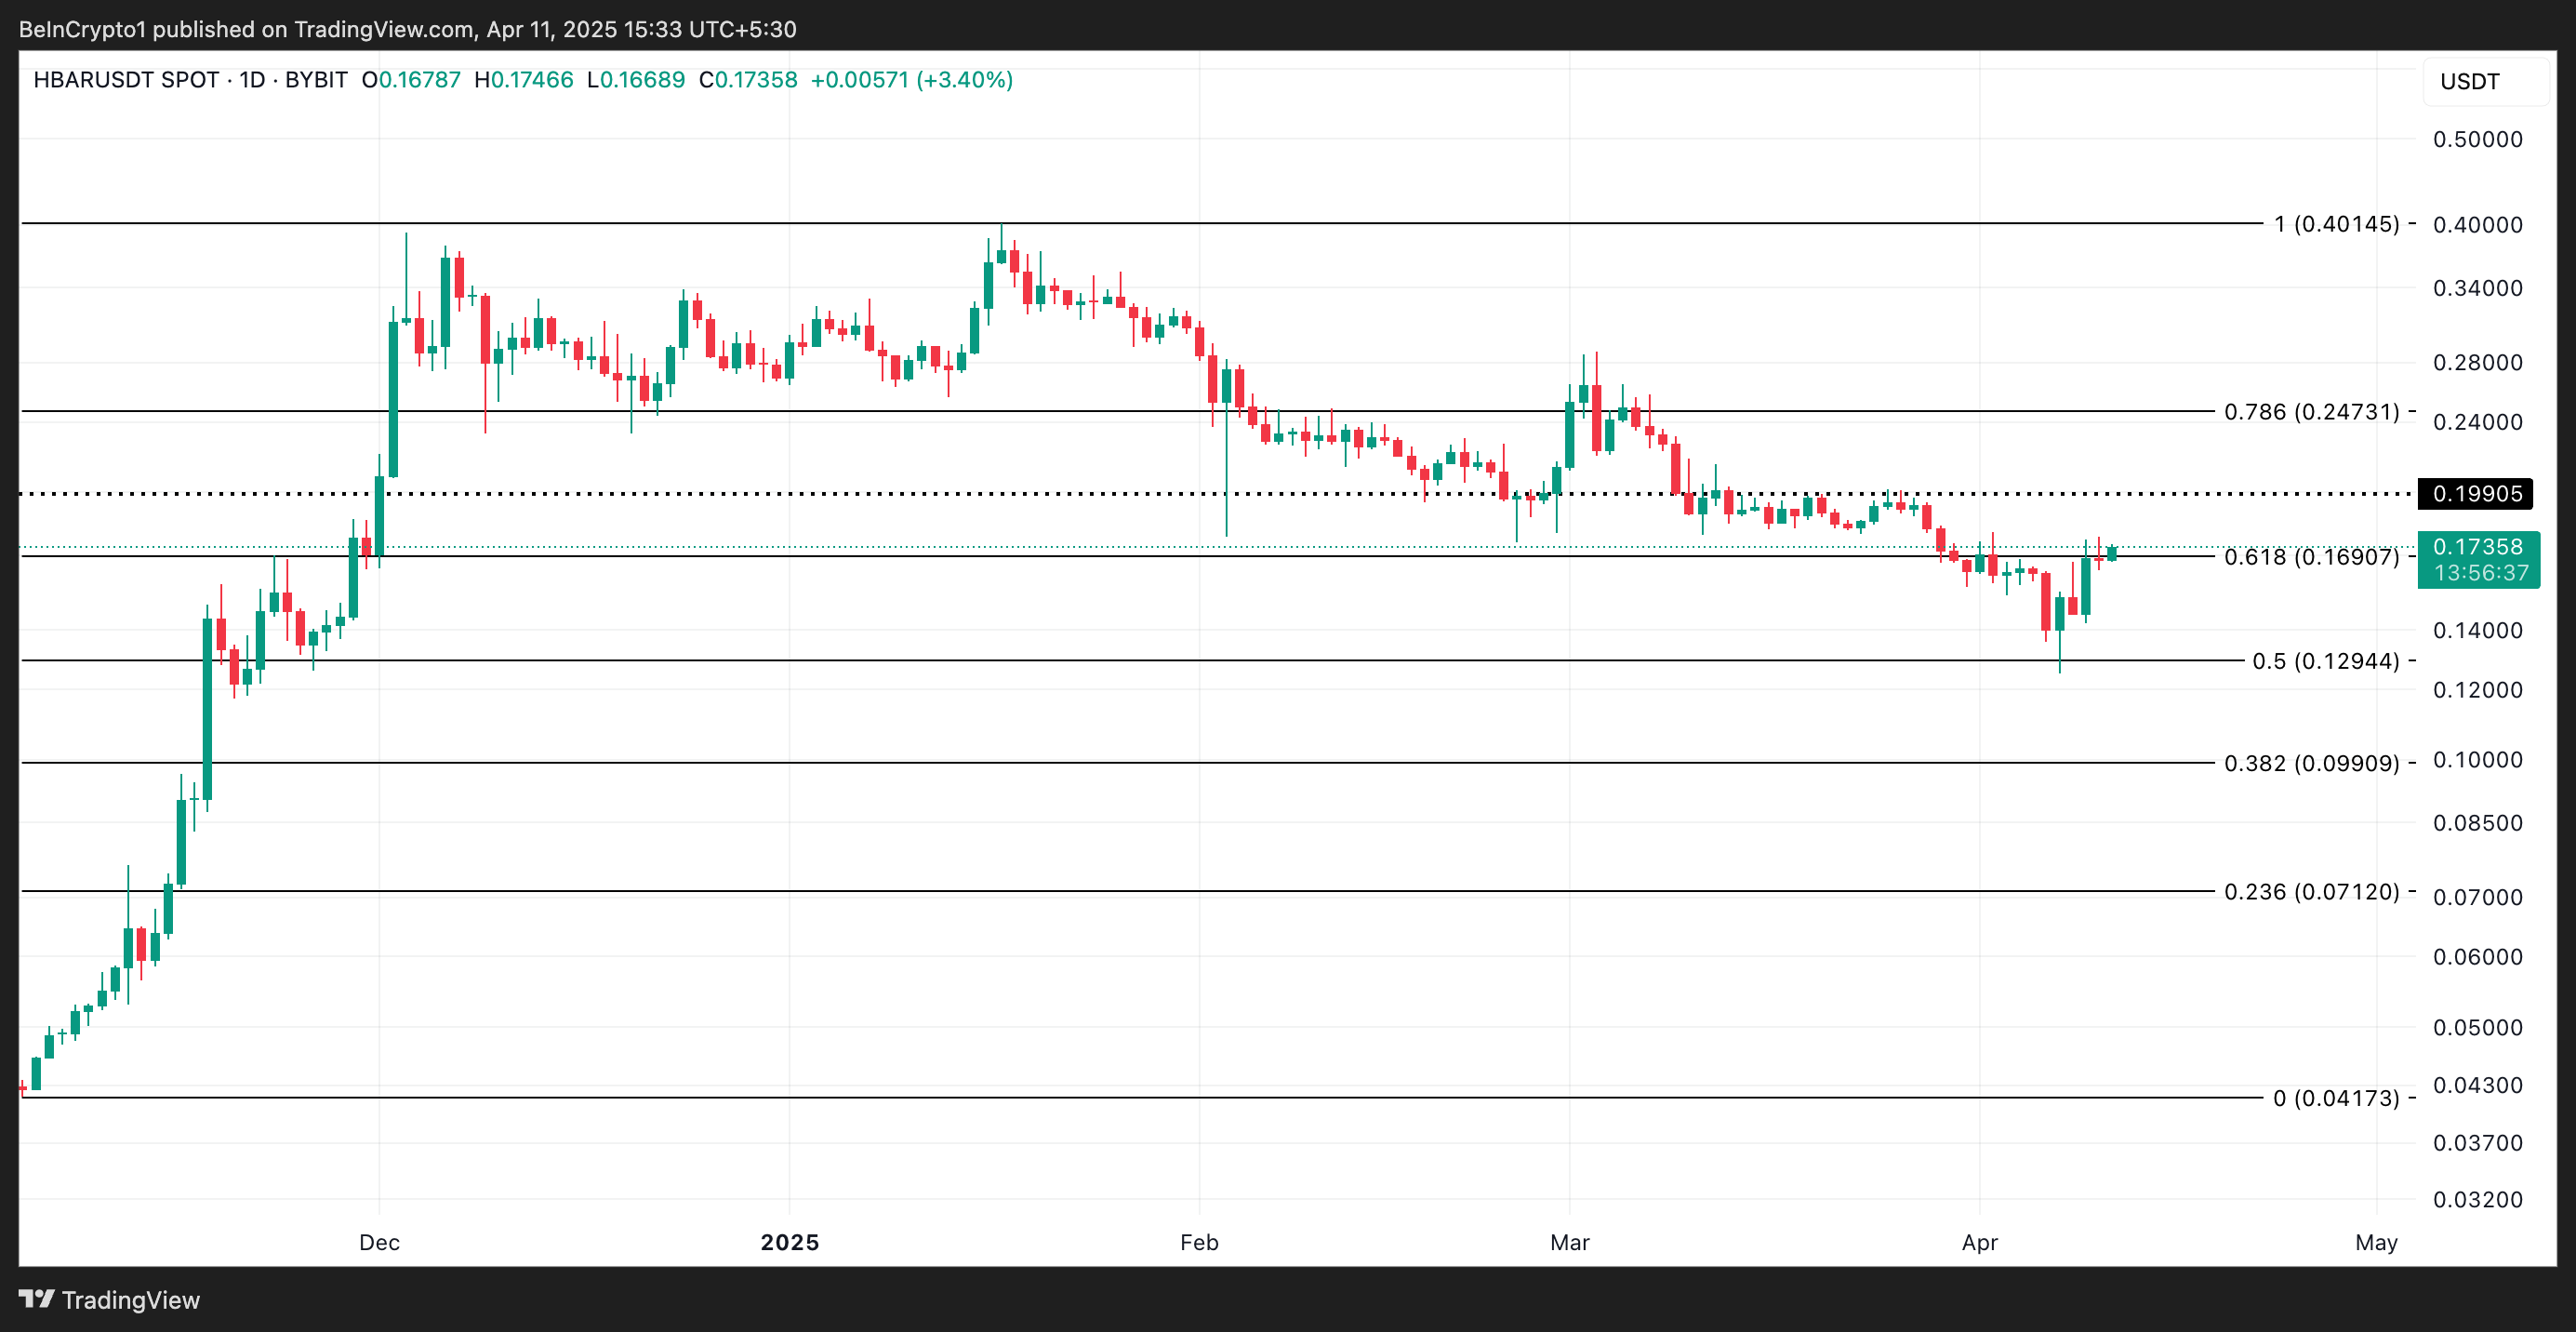
However, if traders resume profit-taking, HBAR’s current rally would halt, and the token’s price could fall below $0.16 and decline toward $0.12.
Disclaimer
In line with the Trust Project guidelines, this price analysis article is for informational purposes only and should not be considered financial or investment advice. BeInCrypto is committed to accurate, unbiased reporting, but market conditions are subject to change without notice. Always conduct your own research and consult with a professional before making any financial decisions. Please note that our Terms and Conditions, Privacy Policy, and Disclaimers have been updated.


Bitcoin (BTC) is up 9% over the past week and is currently trying to establish support above the key $88,000 level. Momentum indicators like the DMI and Ichimoku Cloud are showing clear bullish signals, with buyers firmly in control.
If this trajectory continues, BTC could soon test higher resistances near $88,000 and potentially aim for $90,000 and beyond. However, analysts warn that renewed uncertainty around Trump’s trade tariffs could disrupt the rally and trigger a pullback toward the $81,000 support zone.
Bitcoin DMI Show Buyers In Full Control
Bitcoin’s DMI chart shows a notable rise in trend strength, with the ADX climbing to 29.54 from 24.07 yesterday.
This increase suggests growing momentum behind the current move, pushing the ADX close to the 30 threshold—widely seen as confirmation of a strong, sustained trend.
A rising ADX doesn’t indicate direction on its own, but when paired with directional indicators, it helps identify the prevailing force in the market.

Looking at those directional indicators, the +DI is currently at 23.47 and has remained steady between 21 and 23 over the past two days.
Meanwhile, the -DI has dropped sharply to 9.45 from 16.65, signaling a significant decline in bearish pressure.
This widening gap between bullish and bearish momentum points to buyers taking control, and if the ADX continues to rise above 30, it could validate a new bullish phase for BTC.
BTC Ichimoku Cloud Shows A Clear Bullish Structure
Bitcoin’s Ichimoku Cloud chart continues to lean bullish, with price holding firmly above both the Tenkan-sen (blue line) and Kijun-sen (red line).
This positioning suggests that both short-term and medium-term momentum remains in favor of buyers.
The flat nature of the Kijun-sen could act as a strong support area, while the rising Tenkan-sen shows buyers are still active on smaller timeframes.
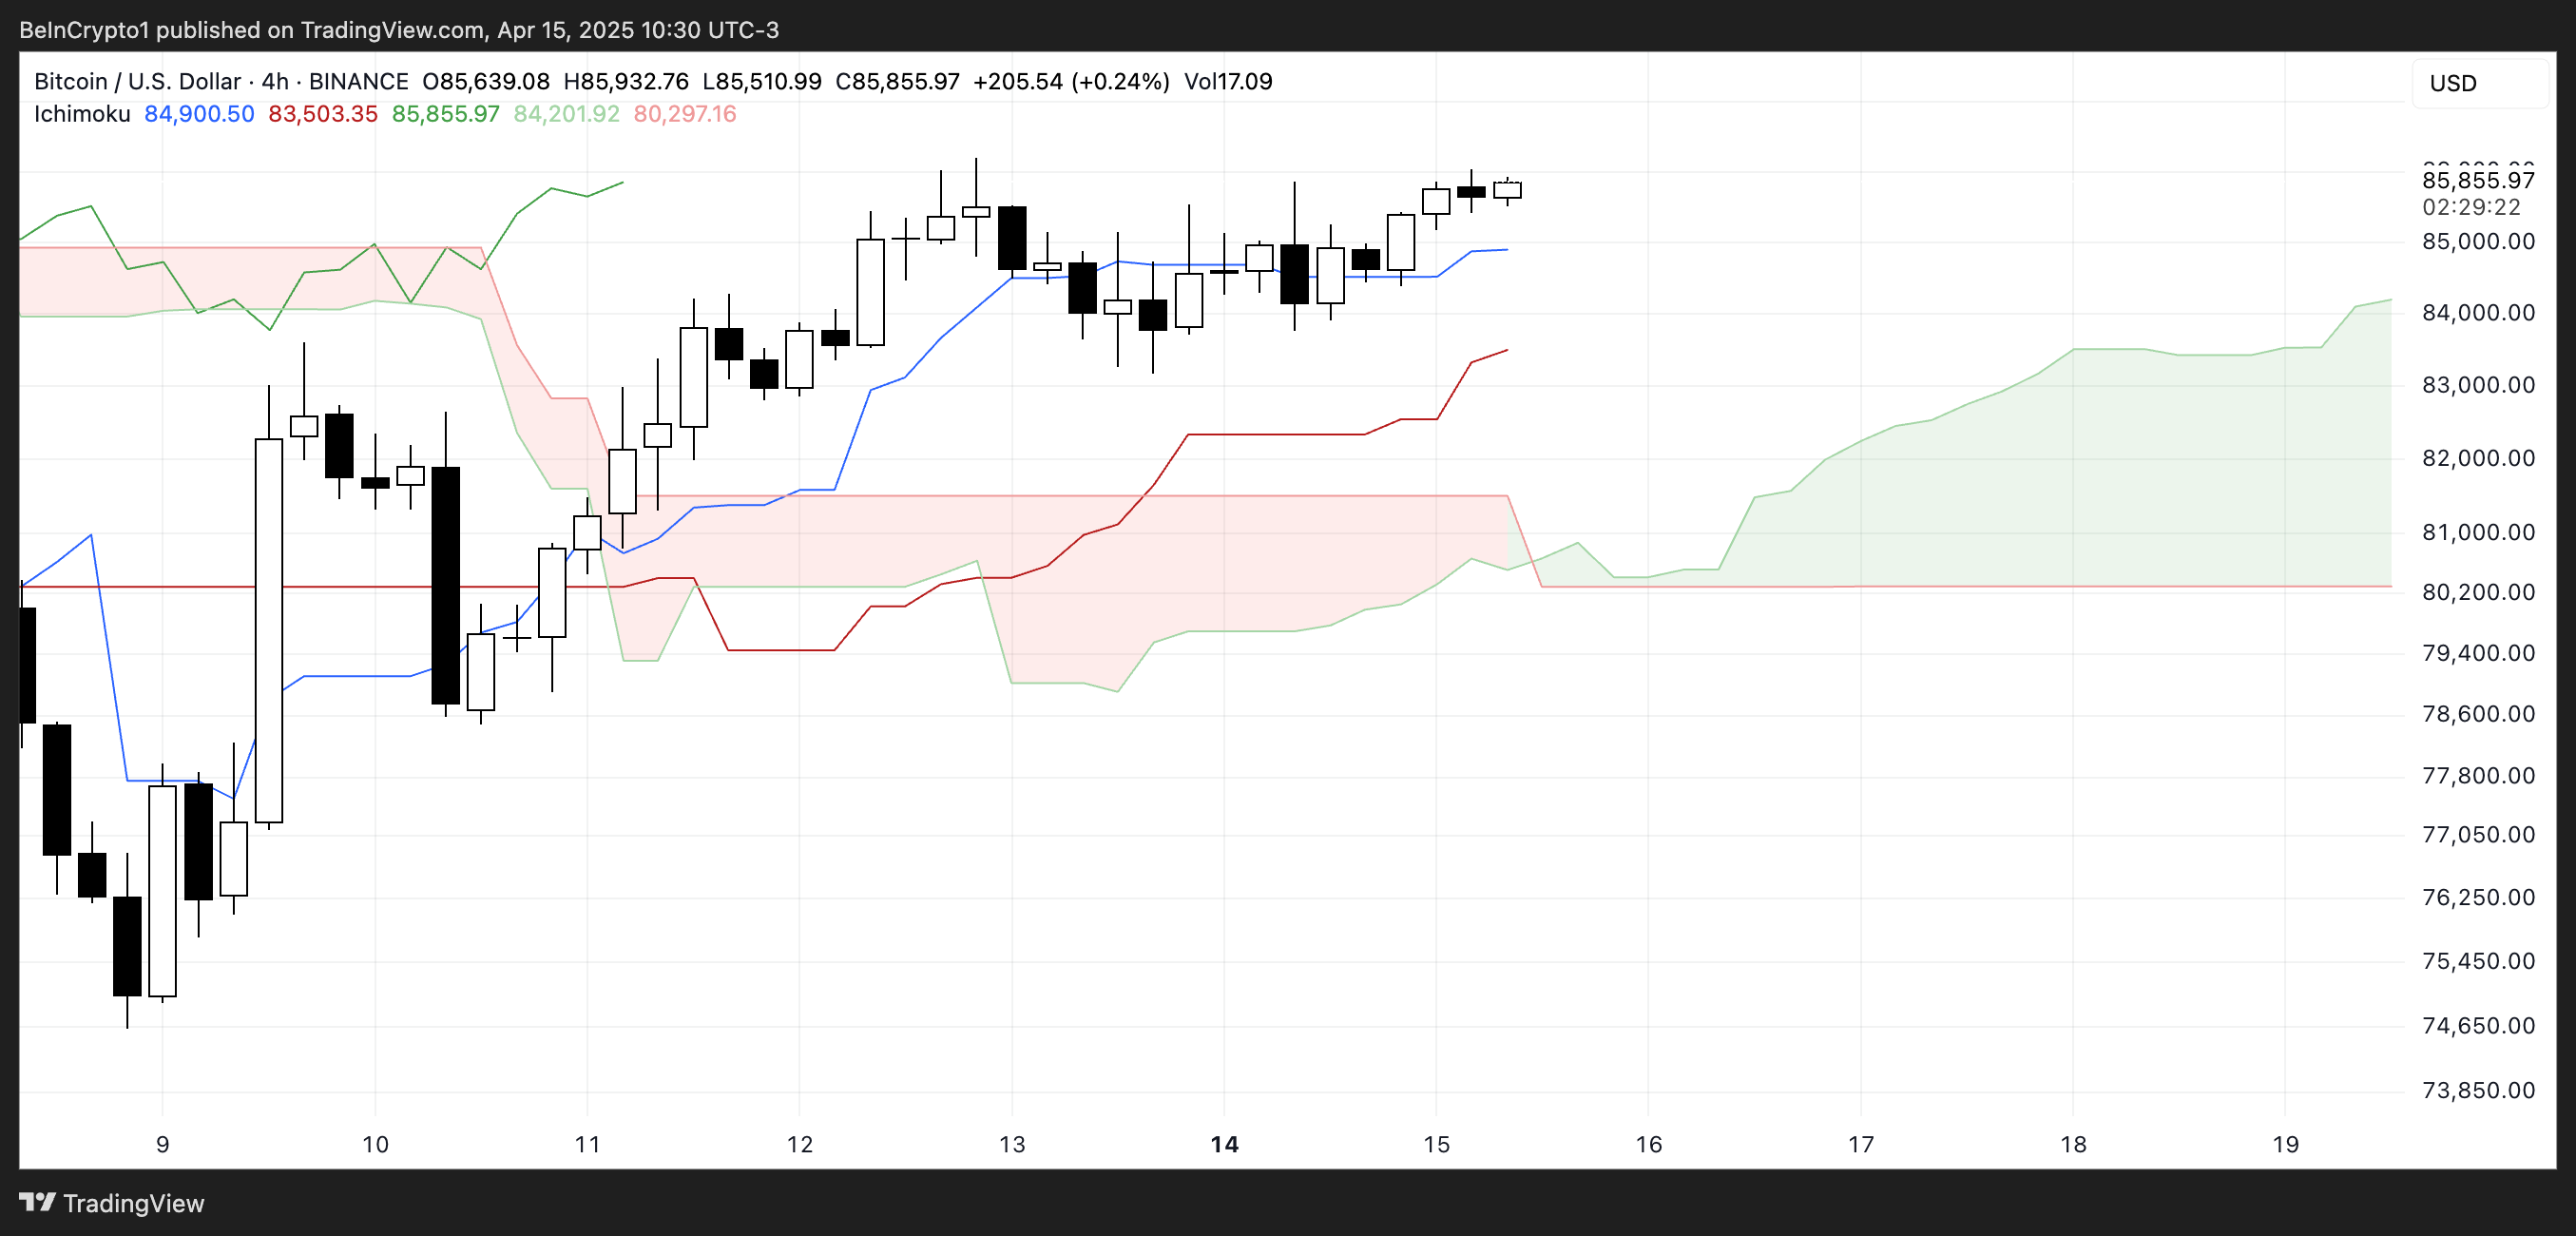
Looking ahead, the Kumo (cloud) is green and steadily rising, which reinforces a positive outlook for the coming sessions. The price is well above the cloud, indicating the trend is bullish and also firmly established.
There’s also a clear gap between the current candle and the cloud, suggesting that the market has room to retrace without shifting the overall structure.
As long as the price stays above the Kijun-sen and the cloud remains green, the bullish trend remains technically intact.
Will Bitcoin Break Above $90,000 Soon?
If Bitcoin price maintains its current momentum, it could soon challenge the resistance at $88,839, with $90,000 as a psychological milestone.
Should the uptrend remain strong, further targets lie at $92,920 and potentially $98,484, marking a continuation of the bullish structure.
However, crypto analyst and Coin Bureau founder Nic Puckrin warns that this momentum could be short-lived. He notes that renewed uncertainty around Trump’s trade tariffs might weigh on BTC:
“The caveat here is that all this positive momentum could disappear in a puff of smoke if there’s any backpedalling on tariffs or an unexpected shock announcement – which we all know is always a possibility. In fact, we continue to have constant back-and-forth on tariffs: exemptions on electronics turned out to be temporary, the details of when tariffs will come in are lacking, and so on,” Puckrin told BeInCrypto.

He also defends that the $81,000 support could be tested again:
“This, perhaps, explains why Bitcoin is, once again, in a “wait and see” pattern, with low liquidations at under $200 million pointing to uncertainty in the market. If we don’t see any external shocks, $88,000-$90,000 is the next range to watch, with liquidity pool clusters at this level suggesting we will see an uptick of volatility here. However, a short-term correction to re-test support at $81,000 would be healthy and, as long as BTC remains above this threshold, would even point to a sustainable price recovery,”
Overall, it looks like the current macroeconomic factors are priced in. Yet, the market is cautious about sudden surprises, as Trump’s recent tariffs went beyond any conventional economic trend and disrupted almost every global financial market.
Disclaimer
In line with the Trust Project guidelines, this price analysis article is for informational purposes only and should not be considered financial or investment advice. BeInCrypto is committed to accurate, unbiased reporting, but market conditions are subject to change without notice. Always conduct your own research and consult with a professional before making any financial decisions. Please note that our Terms and Conditions, Privacy Policy, and Disclaimers have been updated.

The meme coin market is full of surprises, as new trends emerge with every passing day, and the past few days have not disappointed. As the demand for trading bots grows, Solana, being a hotspot for meme coins, has noted the emergence of Axiom as the next big thing.
BeInCrypto has analyzed two other meme coins for investors to watch as they attempt to recover their recent losses.
Animecoin (ANIME)
- Launch Date – January 2025
- Total Circulating Supply – 5.53 Billion ANIME
- Maximum Supply – 10 Billion ANIME
- Fully Diluted Valuation (FDV) – $195.39 Million
ANIME’s price surged by 31% in the last 24 hours, trading at $0.019. The meme coin is now approaching the $0.020 resistance, which it failed to secure in the previous month. This resistance level is crucial for continuing its recent momentum and sustaining upward movement.
If ANIME maintains its current bullish momentum and flips $0.020 into support, it could target the next resistance level at $0.023. A successful breach of this level would indicate a strong uptrend and potentially lead to further price increases, attracting additional investor interest.
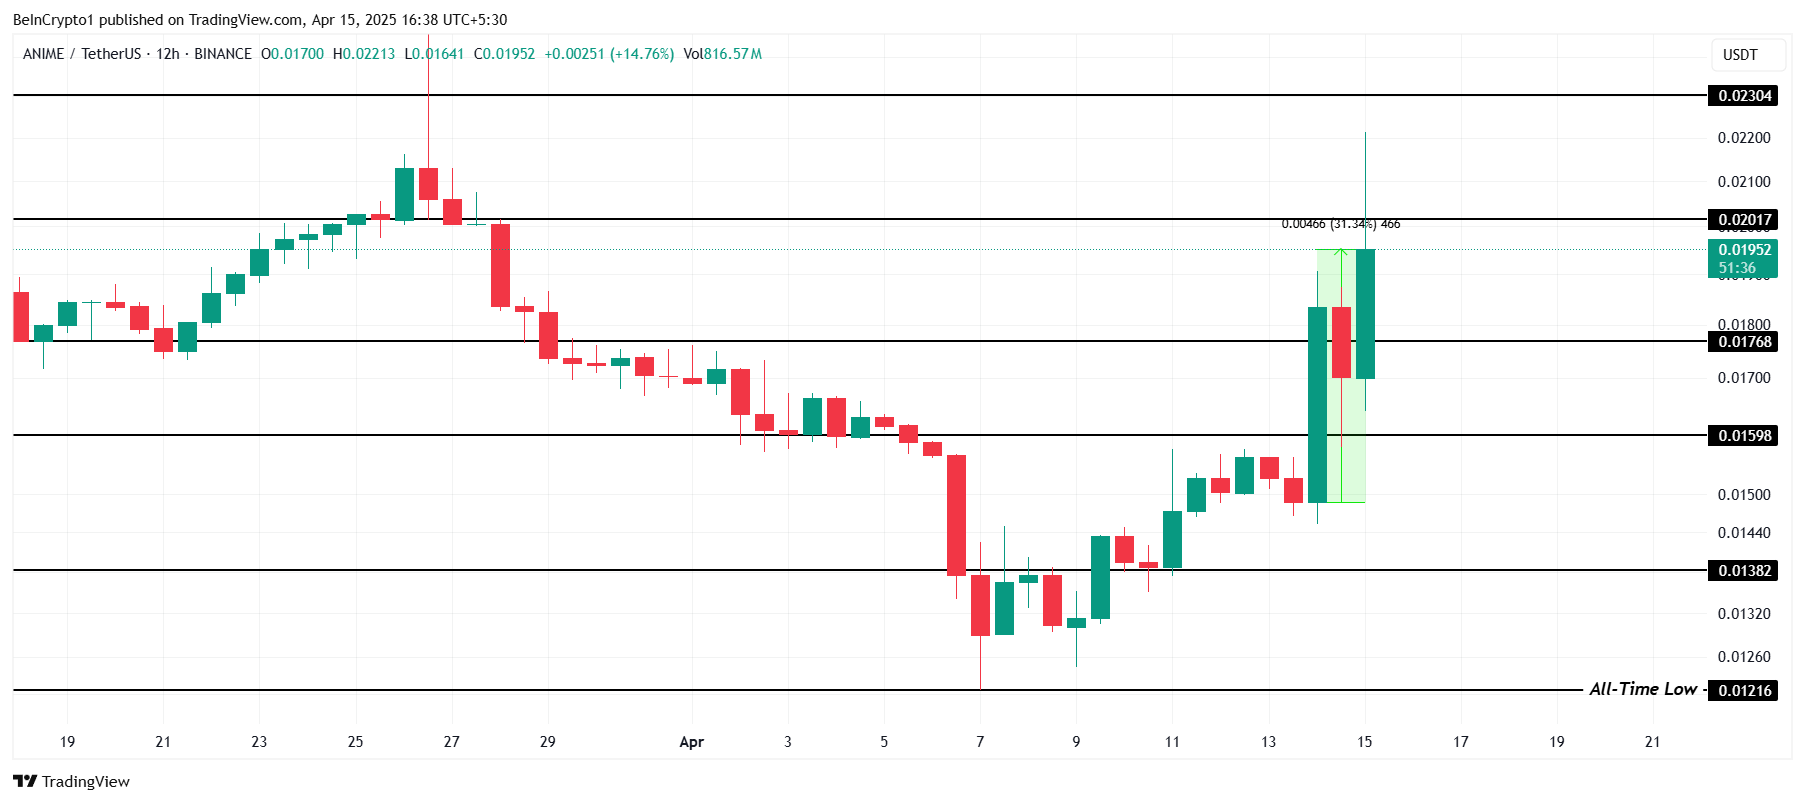
However, if broader market conditions fail to support this bullish outlook, ANIME could face a decline. A drop below the $0.017 support would suggest a reversal, with the possibility of the price falling to $0.015, invalidating the bullish thesis and signaling a potential further downturn.
Brett (BRETT)
- Launch Date – May 2023
- Total Circulating Supply – 9.91 Billion BRETT
- Maximum Supply – 10 Billion BRETT
- Fully Diluted Valuation (FDV) – $375.52 Million
Another one of the meme coins to watch, BRETT, has shown significant growth, posting a 46% increase in the last seven days. This strong performance has brought the meme coin to $0.036 despite the dominance of other meme coins in the market. BRETT’s price action shows potential for further growth if key resistance levels are breached.
However, BRETT is now facing resistance at $0.038, a level it failed to breach in March. If the meme coin can successfully break through this barrier, it may rise to $0.042, reaching a new monthly high and signaling continued upward momentum, attracting investor interest.

On the other hand, if BRETT fails to breach $0.038 again, the price could retreat towards $0.030. This would invalidate the current bullish outlook, erasing much of the recent gains and suggesting the meme coin may struggle to maintain its upward momentum in the short term.
Small Cap Corner – Axiom
Axiom, although not a meme coin, has caught the attention of meme coin enthusiasts. This Solana-based trading bot recently saw a surge in demand, making it the largest bot on the platform, surpassing established bots like Photon, BullX, and GMGN.
Axiom’s success is impressive, recently surpassing $100 million in daily trading volume and commanding 41% of Solana’s entire trading bot volume. The rise of bots for speculative trading offers a convenient solution, and Axiom adds to this trend with its one-tap functionality for executing complex trades.
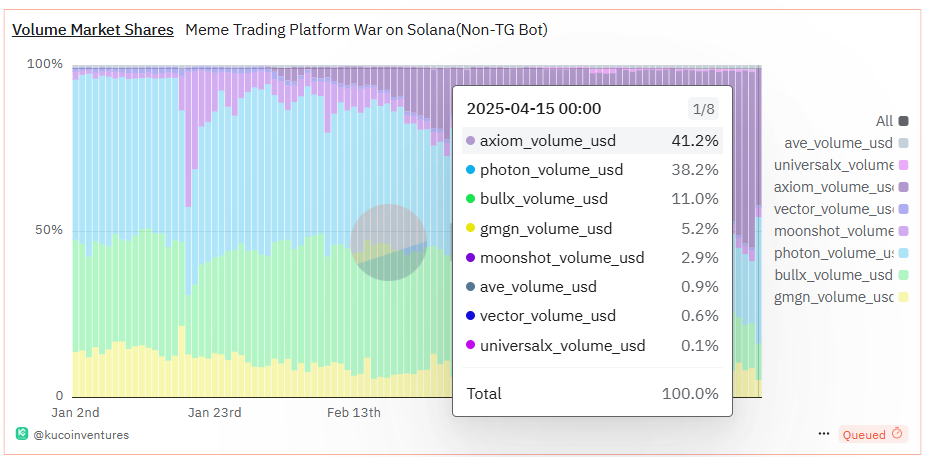
The growing reliance on bots for speculative trading, especially when it comes to meme coins, provides an easier path for investors. As meme coin investments are often driven by volatility, Axiom offers a middle ground for users seeking to trade these assets effectively. Given the increasing interest, Q2 could see a surge in trading bots, making it essential for meme coin enthusiasts to explore these tools.
However, speculative trading, particularly with meme coins, carries inherent risks. BeInCrypto strongly advises to DYOR before diving into such investments.
Disclaimer
In line with the Trust Project guidelines, this price analysis article is for informational purposes only and should not be considered financial or investment advice. BeInCrypto is committed to accurate, unbiased reporting, but market conditions are subject to change without notice. Always conduct your own research and consult with a professional before making any financial decisions. Please note that our Terms and Conditions, Privacy Policy, and Disclaimers have been updated.

Leading altcoin Ethereum has seen its price climb 5% over the past week, riding the wave of a broader market recovery. This price growth has reignited demand for the altcoin, particularly among US-based ETH retail traders, as indicated by on-chain data.
However, institutional investors appear to remain skeptical. They continue to pull their capital from ETH-backed funds, signaling their lack of confidence in any near-term price rebound.
Retail Interest in Ethereum Grows as Coinbase Premium Signals Buying Surge
The increase in retail interest is evident in ETH’s Coinbase Premium. It has moved back above zero, signaling heightened buying activity from US investors. At press time, this is at 0.016.

ETH’s Coinbase Premium Index measures the difference between the coin’s prices on Coinbase and Binance. When its value climbs above zero, it suggests significant buying activity by US-based investors on Coinbase.
Conversely, when it declines and dips into the negative territory, it signals less trading activity on the US-based exchange.
ETH’s Coinbase Premium Index reflects bullish sentiment in the market, as traders are willing to pay a premium to purchase the coin on Coinbase. In the short term, this can drive up the altcoin’s value, as it signals growing investor interest.
However, institutional investors in the US remain cautious. This is evident in the ongoing outflows from US-based spot ETH exchange-traded funds (ETFs), marking the altcoin’s seventh consecutive day of withdrawals.

The continued exit of institutional capital stands in stark contrast to the growing enthusiasm among retail traders. This divergence suggests that while US retail investors are increasingly optimistic about ETH’s short-term prospects, institutional players are more cautious, possibly due to macroeconomic uncertainty.
ETH Shows Strong Capital Inflows, But Bearish Sentiment Could See Price Drop
ETH’s Balance of Power (BoP) is positive at press time, reflecting today’s market recovery. This indicator, which measures buying and selling pressures, is in an upward trend at 0.57.
A positive BoP like this indicates more capital inflow into ETH than outflow, signaling an accumulation trend. If this continues, it could push the altcoin’s price to $2,114.
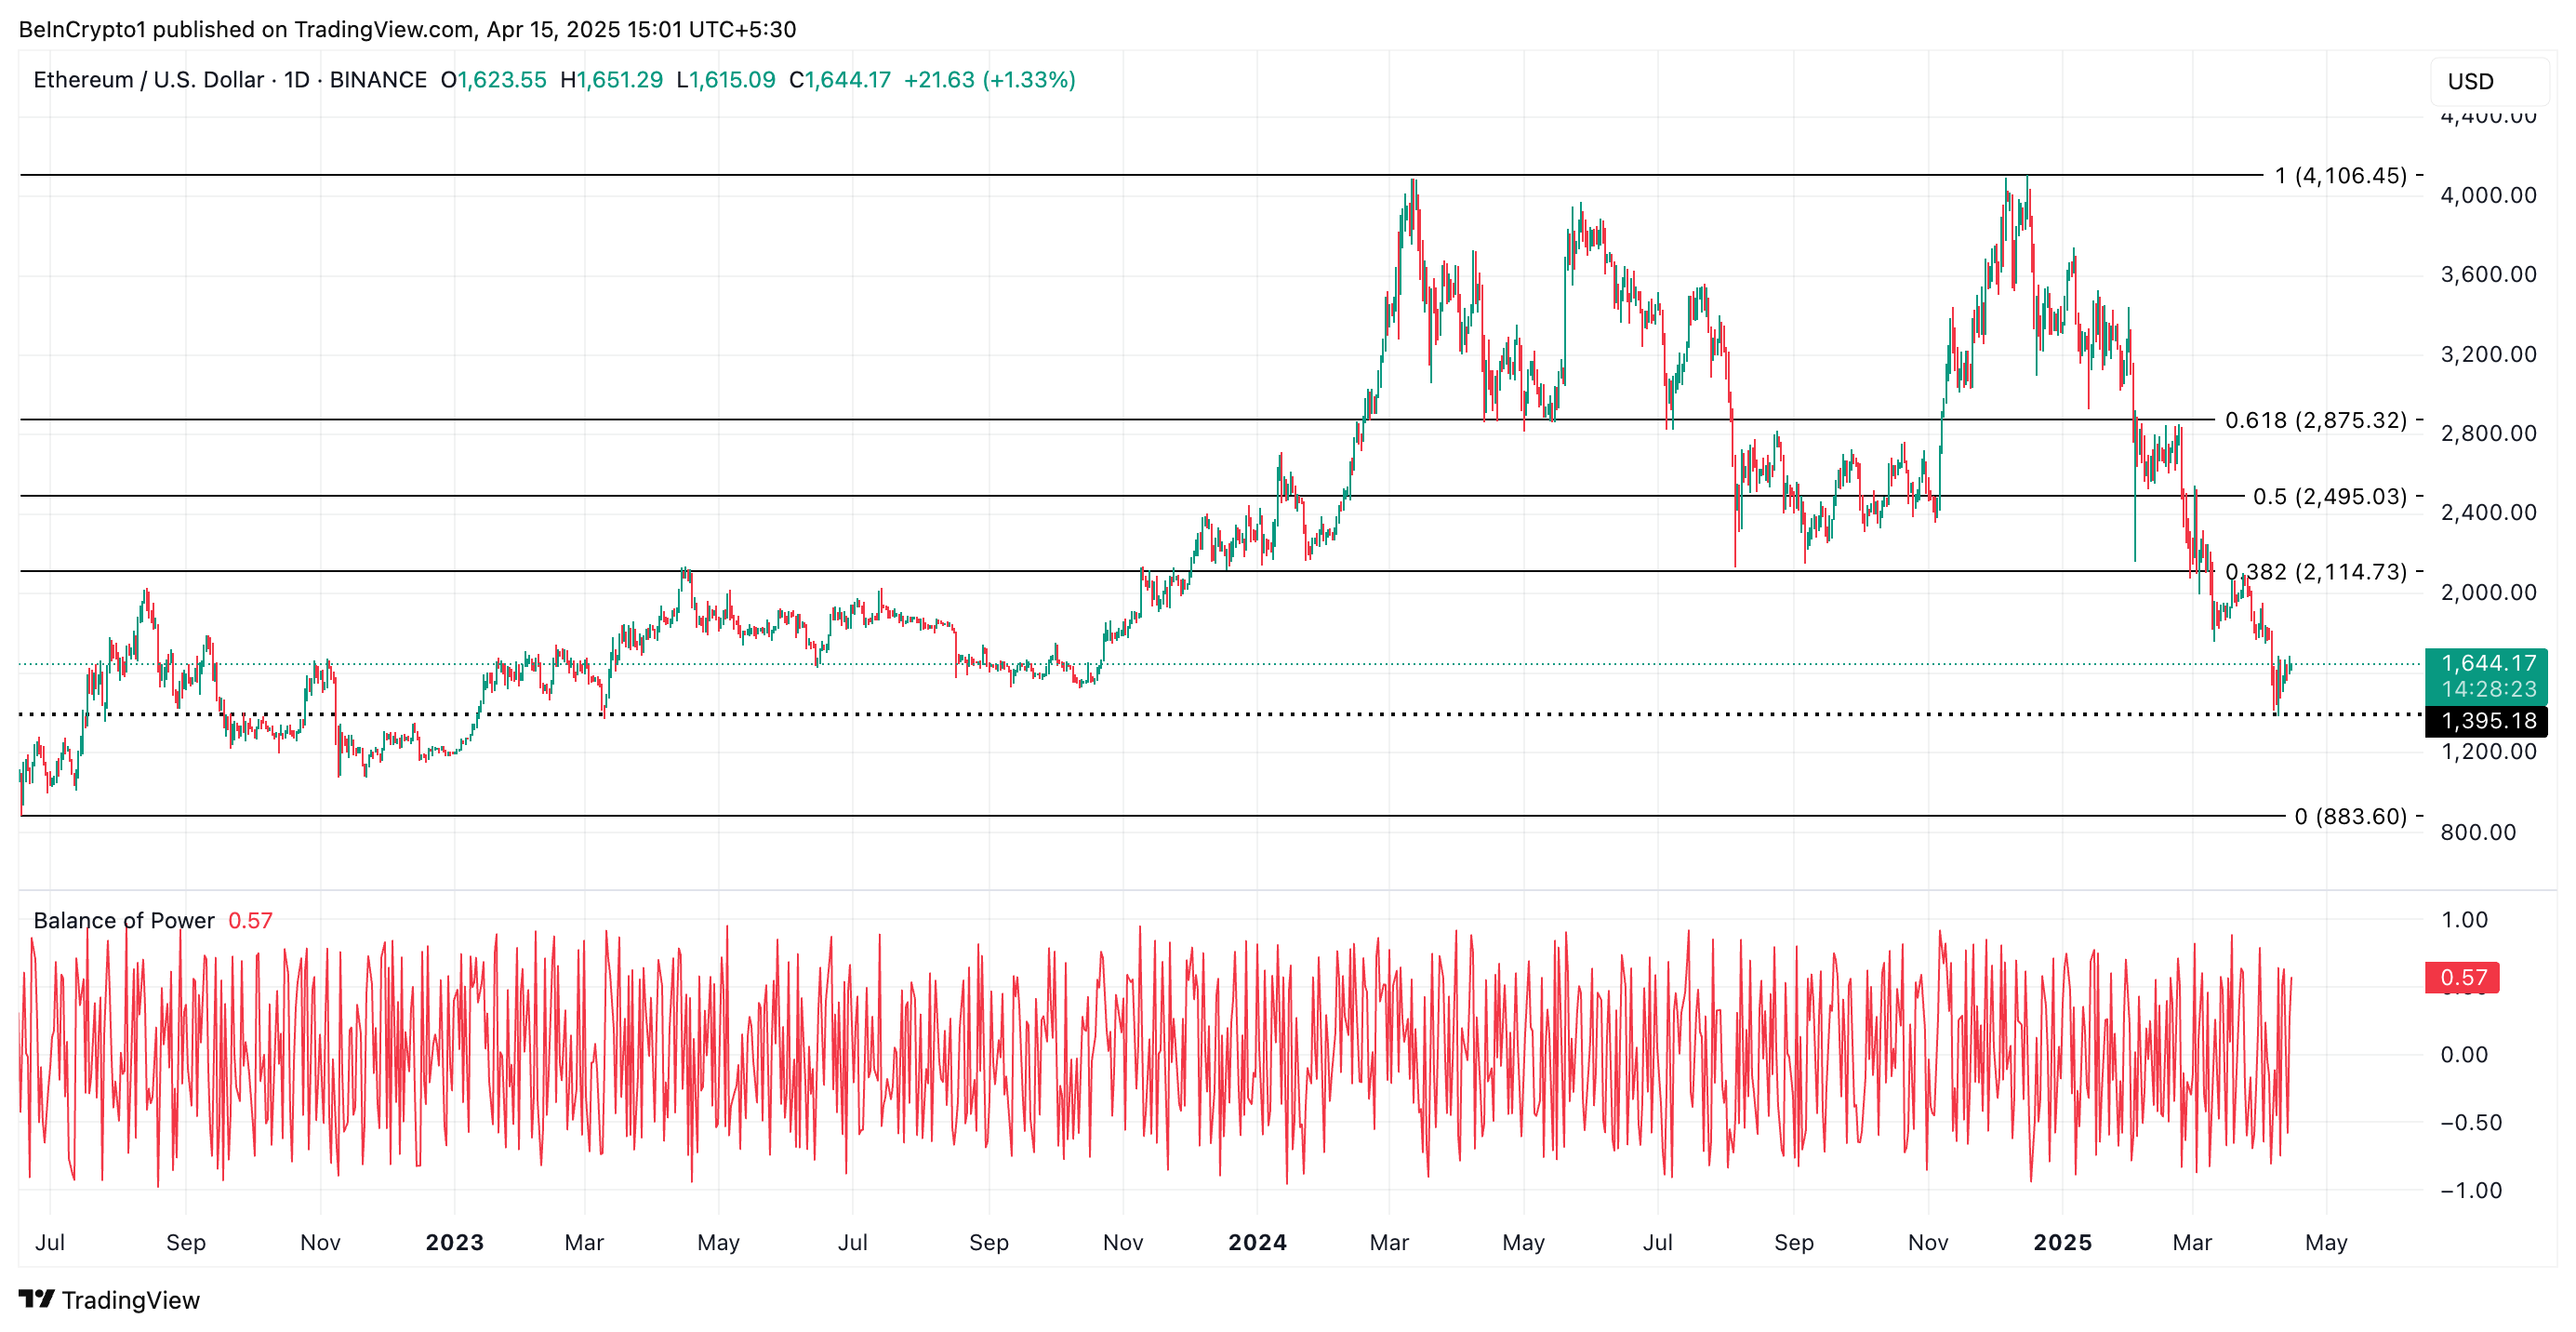
However, if market sentiment turns bearish and ETH retail traders reduce their demand for the altcoin, it could lose recent gains and drop to $1,395.
Disclaimer
In line with the Trust Project guidelines, this price analysis article is for informational purposes only and should not be considered financial or investment advice. BeInCrypto is committed to accurate, unbiased reporting, but market conditions are subject to change without notice. Always conduct your own research and consult with a professional before making any financial decisions. Please note that our Terms and Conditions, Privacy Policy, and Disclaimers have been updated.

Bitcoin Eyes $90,000, But Key Resistance Levels Loom

Axiom Leads Solana Trading Bots
Could Tomorrow’s Canada Solana ETF Launch Push SOL Price to $200?

ETH Retail Traders Boost Demand Despite Institutional Outflows

Trump Family Plans Crypto Game Inspired by Monopoly

Whispers Of Insider Selling As Mantra DAO Relocates Nearly $27 Million In OM To Binance

2.52 Million Altcoins Are Ruining Crypto’s Future

Animoca Brands Valuation Tanks 75% In Two Years, Here’s Why

Crypto exchange BingX hacked for $43 million

Are The Big Players Losing Interest?

Hong Kong’s Securities Association Tips Authorities On Crypto Self-Regulation

Coinbase cbBTC Set to go Live on Solana
2.52 Million Altcoins Are Ruining Crypto’s Future
Animoca Brands Valuation Tanks 75% In Two Years, Here’s Why
Crypto exchange BingX hacked for $43 million
Are The Big Players Losing Interest?
Hong Kong’s Securities Association Tips Authorities On Crypto Self-Regulation
Coinbase cbBTC Set to go Live on Solana
-

 Market22 hours ago
Binance Futures Causes a Brief Crash For Story (IP) and ACT
-

 Ethereum24 hours ago
Ethereum Price Threatened With Sharp Drop To $1,400, Here’s Why
-

 Market23 hours ago
XRP Jumps 22% in 7 Days as Bullish Momentum Builds
-
 Market20 hours ago
Is The XRP Price Mirroring Bitcoin’s Macro Action? Analyst Maps Out How It Could Get To $71
-
 Market21 hours ago
Ondo Finance (ONDO) Rises 3.5% Following MANTRA Crash
-

 Market17 hours ago
Bitcoin Price Eyes Bullish Continuation—Is $90K Within Reach?
-

 Market10 hours ago
Can Pi Network Avoid a Similar Fate?
-
 Altcoin17 hours ago
Expert Urges Pi Network To Learn From The OM Crash Ahead Of Open Mainnet Transition
