
Market
FARTCOIN Is Overbought After 250% Rally – Is the Bull Run Over?

The Solana-based meme coin FARTCOIN has emerged as an unlikely outperformer over the past month. The altcoin has defied the broader market troubles and surged by nearly 250% in the past 30 days.
However, buyer exhaustion could soon set in, potentially triggering a wave of profit-taking among FARTCOIN holders eager to lock in gains.
FARTCOIN Enters Overbought Zone
FARTCOIN’s triple-digit rally has pushed its price above the upper band of its Bollinger Bands (BB) indicator, a sign that the meme coin is overbought.
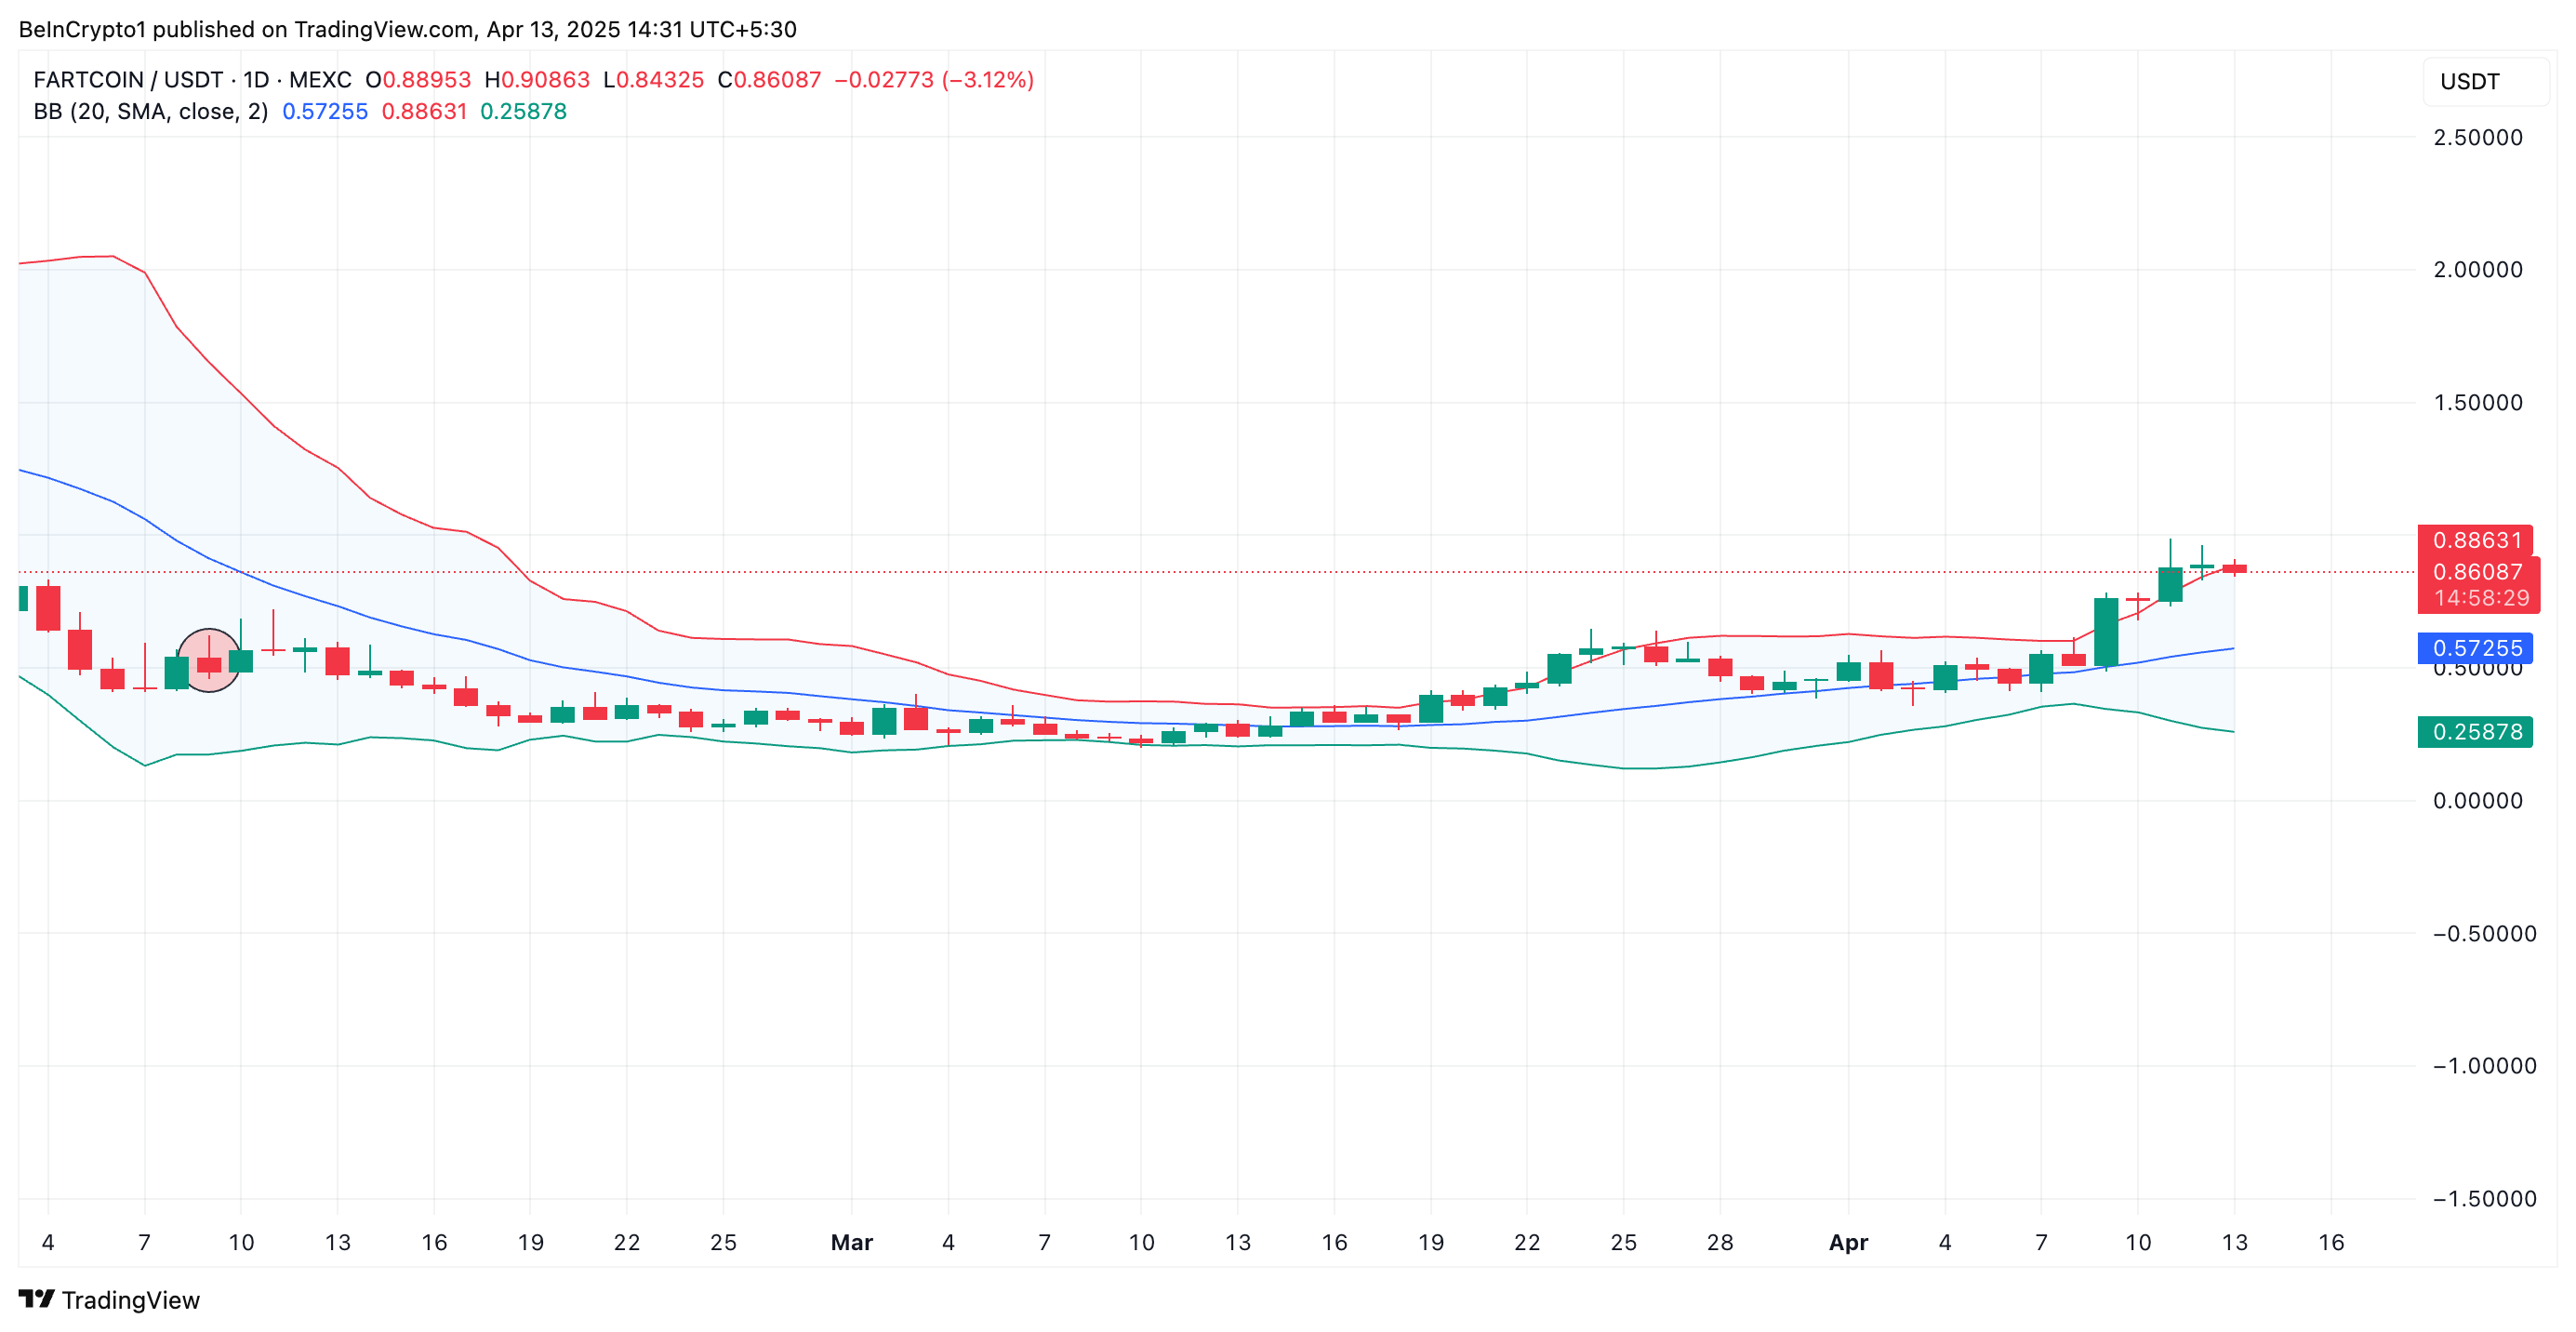
The BB indicator identifies overbought or oversold conditions and measures an asset’s price volatility. It consists of three lines: a simple moving average (middle band) and two bands (upper and lower) representing standard deviations above and below the moving average.
When the price breaks above the upper band, it means the asset’s current value is moving significantly away from its average, making it overbought and due for a price correction.
This pattern suggests that FARTCOIN’s current price level may not be sustainable, increasing the likelihood of a near-term pullback.
Moreover, readings from the token’s Relative Strength Index (RSI) confirm its nearly overbought status. At press time, this momentum indicator rests at 69.09.
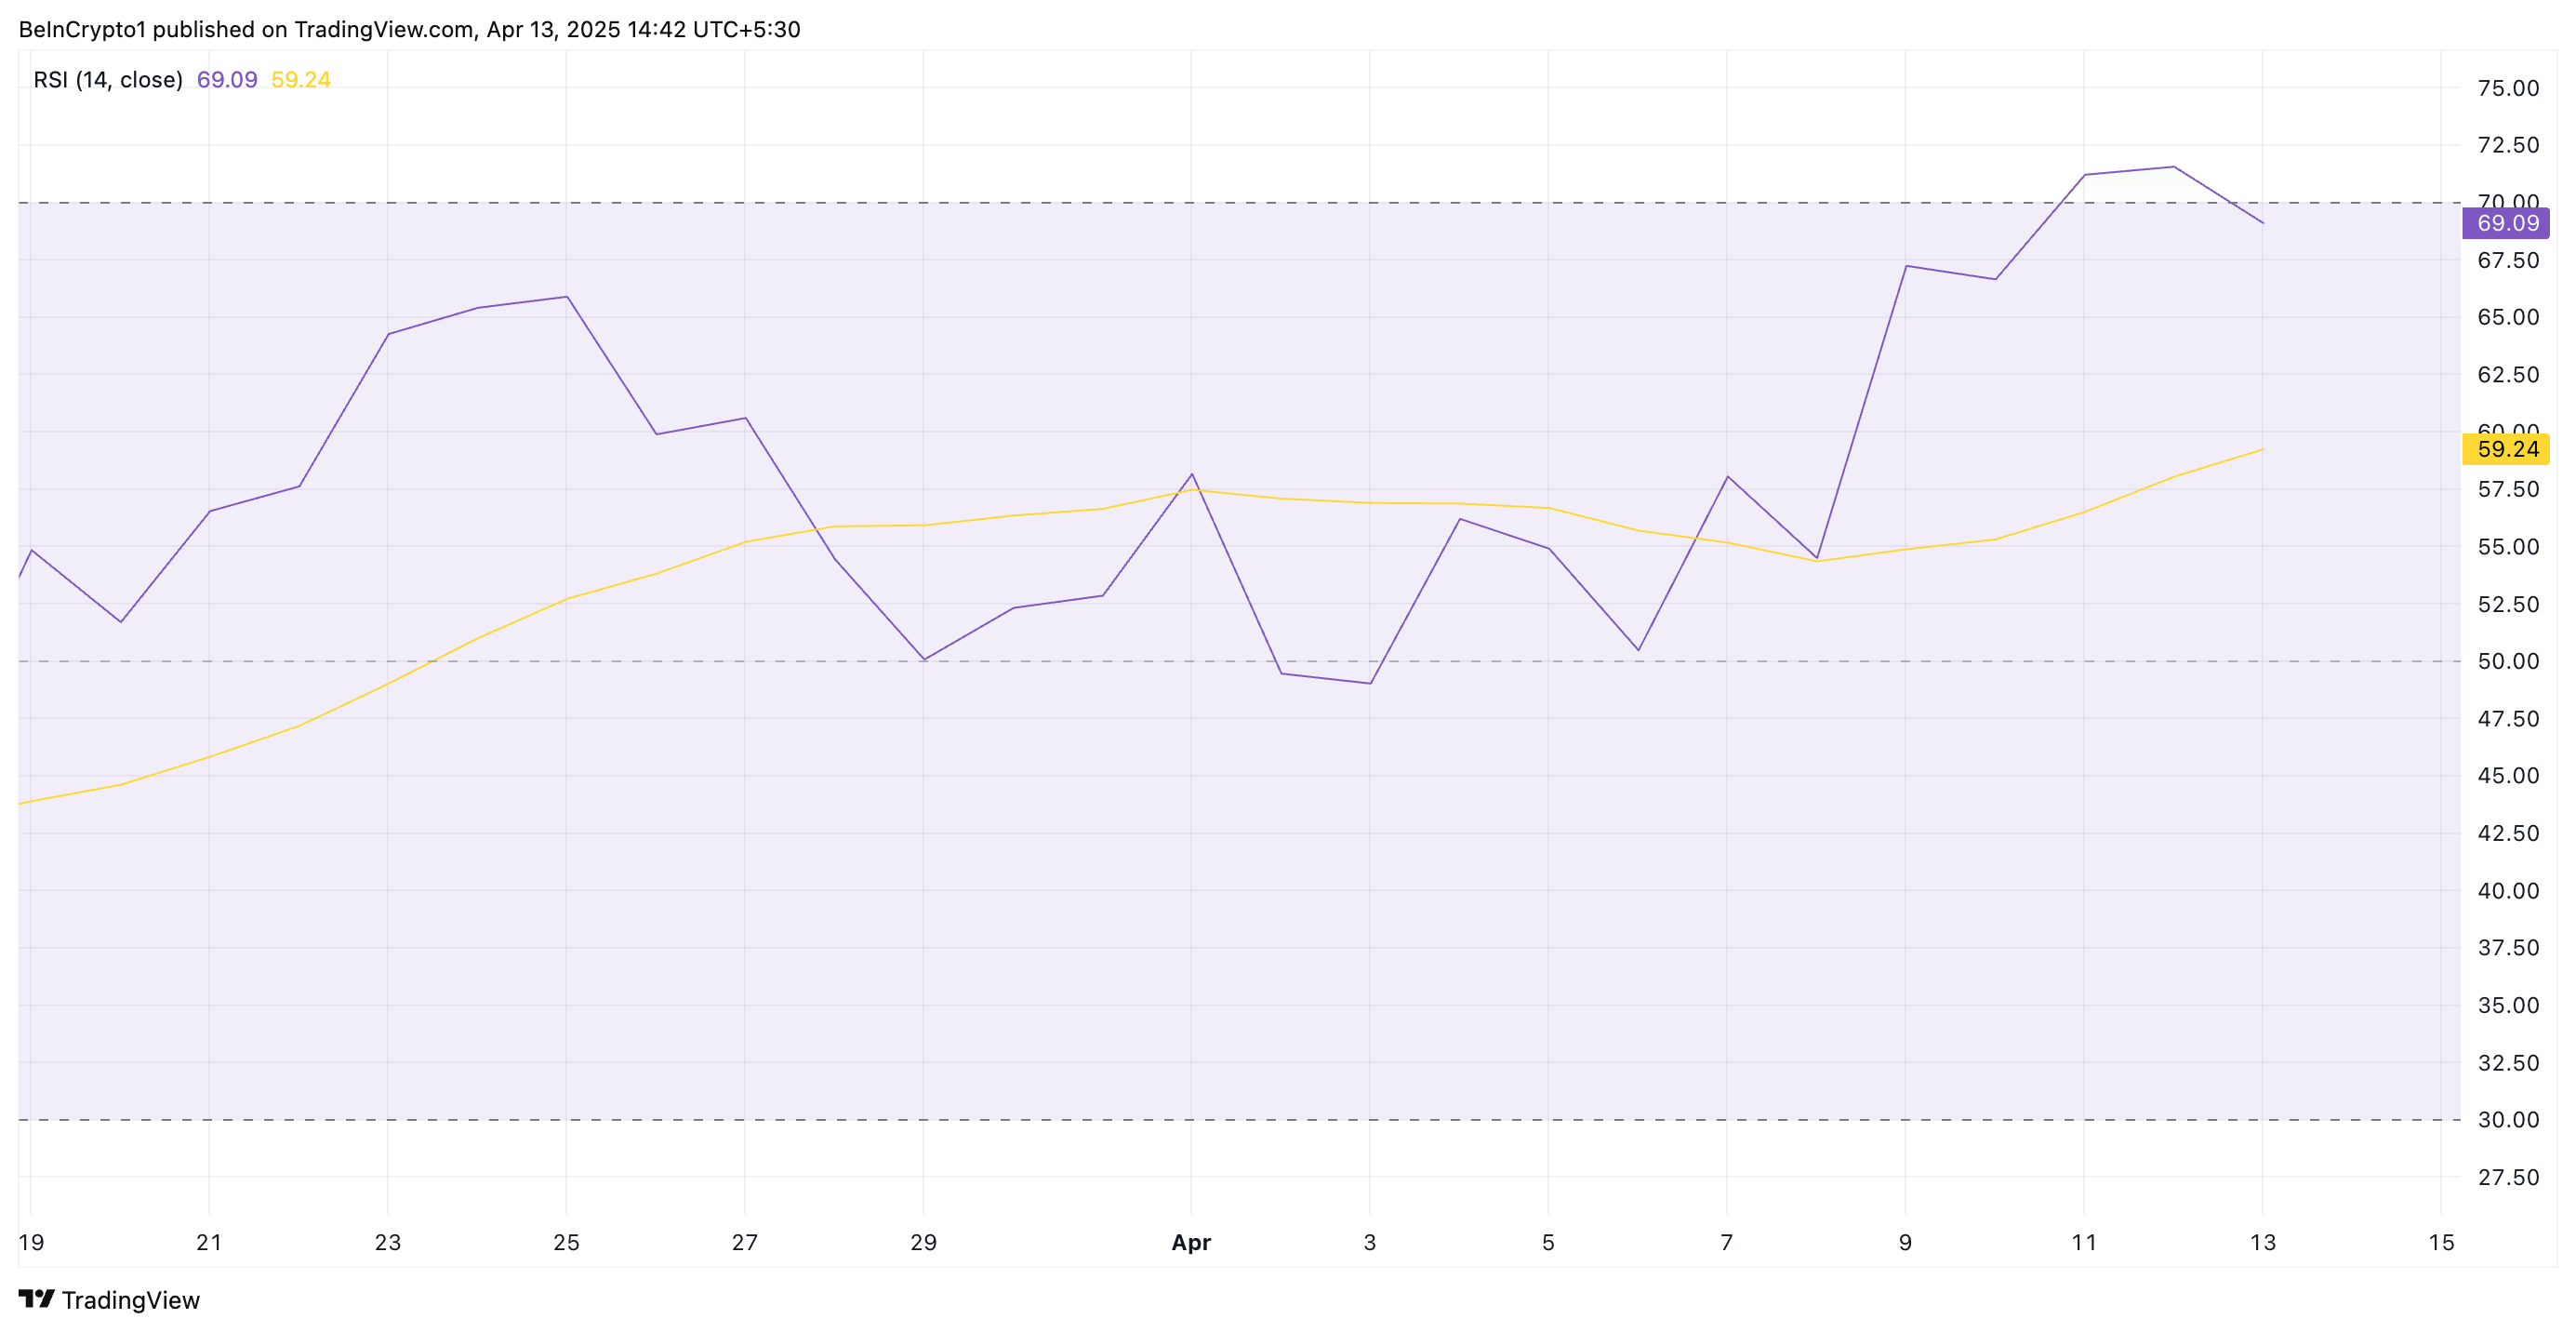
The RSI indicator measures an asset’s overbought and oversold market conditions. It ranges between 0 and 100. Values above 70 suggest that the asset is overbought and due for a price decline, while values under 30 indicate that the asset is oversold and may witness a rebound.
At 69.09, FARTCOIN’s RSI signals that the meme coin is nearly overbought. Its upward momentum may be weakening, and a price correction could be near.
Will It Hit $1.16 or Slip Back to $0.37?
If the current momentum fades, FARTCOIN could face a short-term correction that causes it to shed some recent gains. In that scenario, the Solana-based asset could retest support at $0.74.
Should it fail to hold, the downtrend strengthens and could continue toward $0.37.
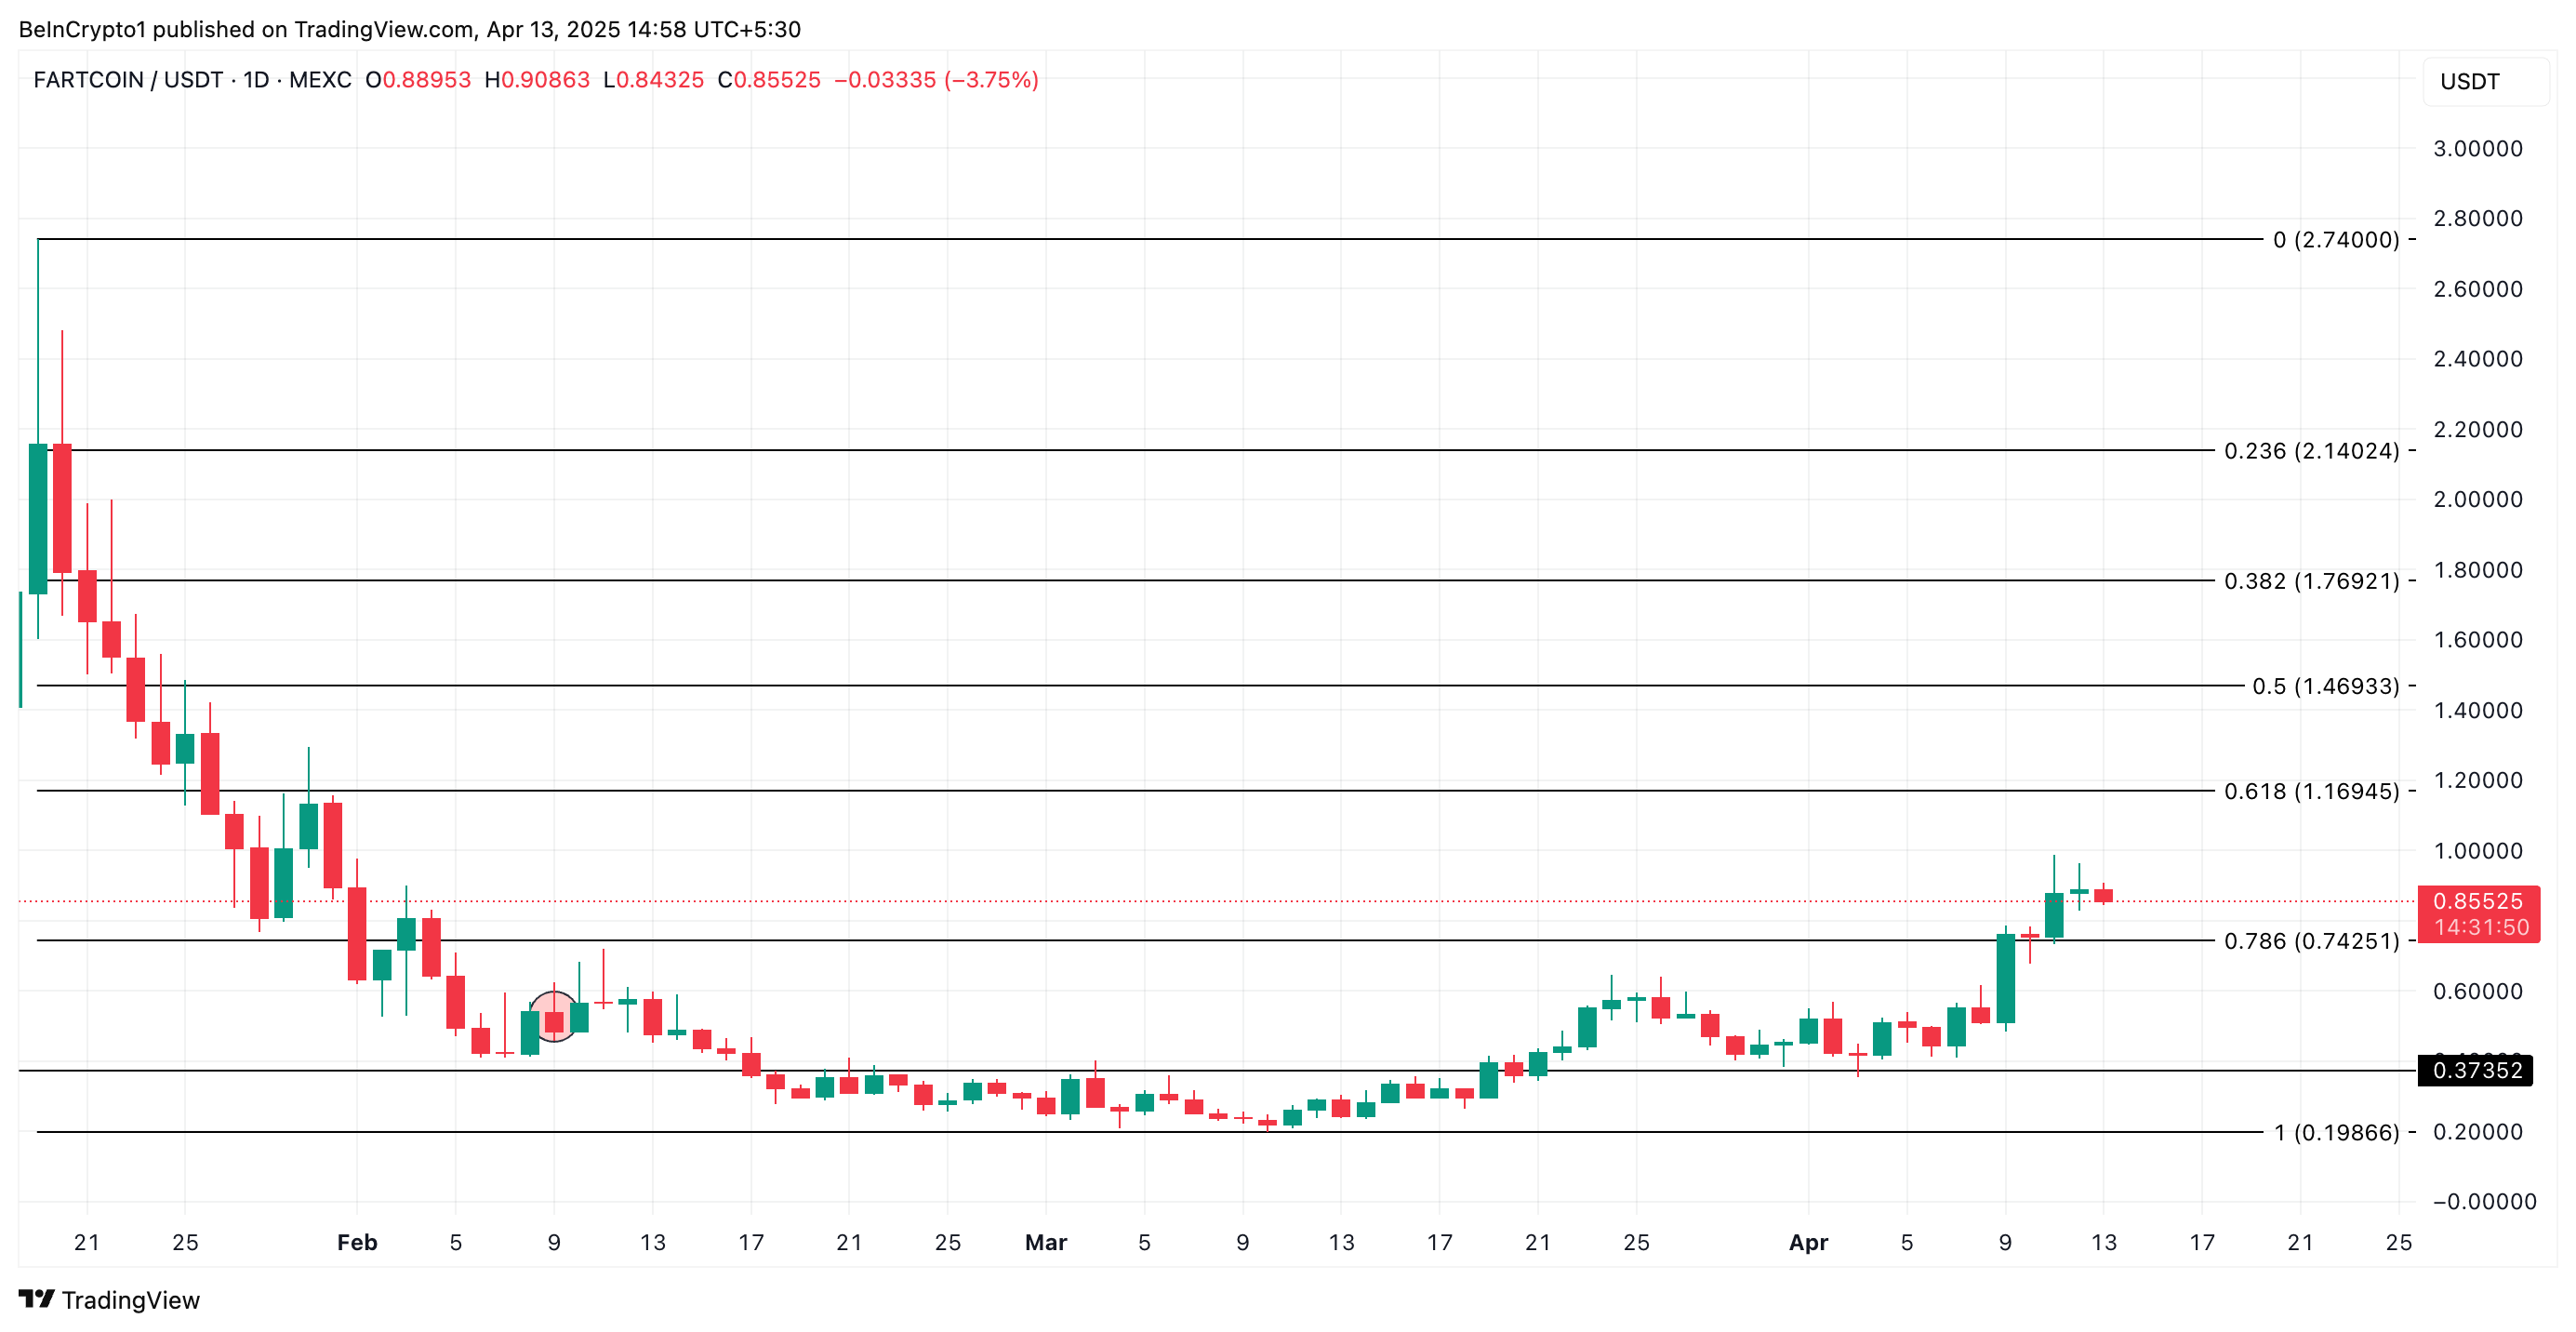
However, if FARTCOIN maintains its uptrend, it could rally to $1.16.
Disclaimer
In line with the Trust Project guidelines, this price analysis article is for informational purposes only and should not be considered financial or investment advice. BeInCrypto is committed to accurate, unbiased reporting, but market conditions are subject to change without notice. Always conduct your own research and consult with a professional before making any financial decisions. Please note that our Terms and Conditions, Privacy Policy, and Disclaimers have been updated.


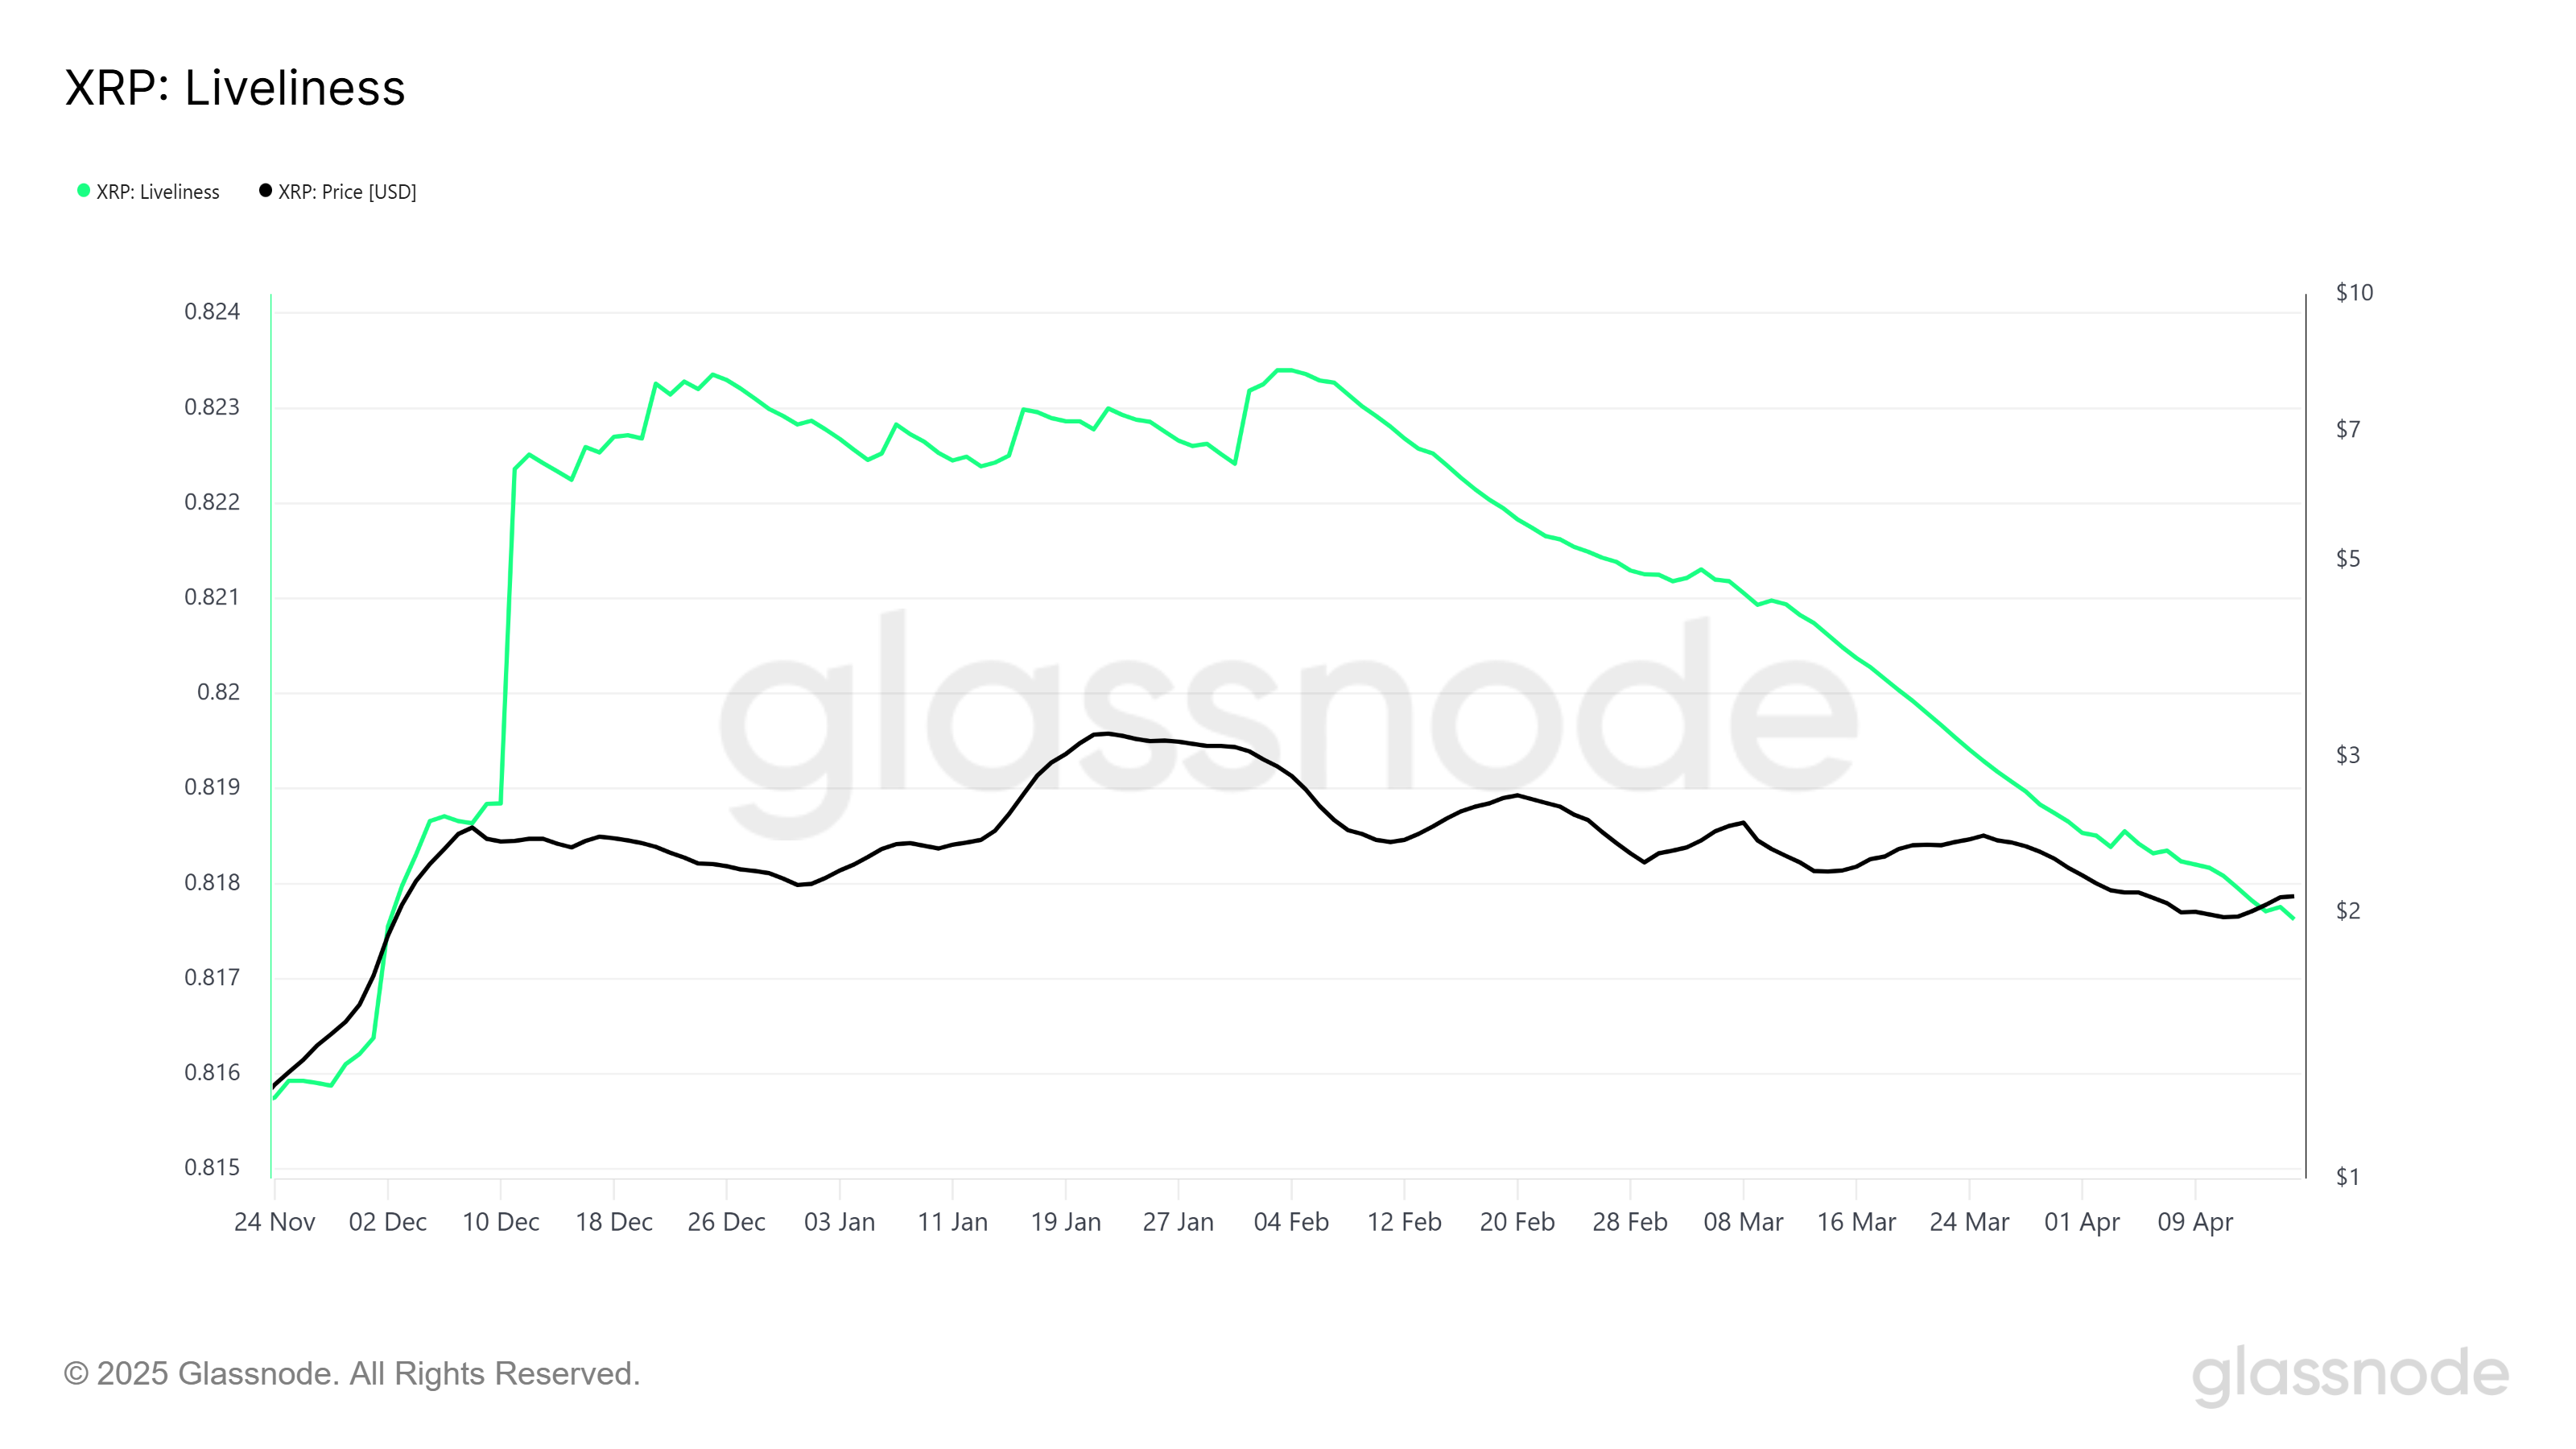
XRP’s price has faced a struggle to recover in recent weeks, with broader market conditions remaining bearish. Despite these challenges, XRP has managed to hold steady above the $2 mark.
This stability is largely driven by long-term holders (LTHs), who are working to prevent the price from falling below this key level.
XRP Investors Capitalize On Low Prices
The Liveliness metric, which tracks the frequency of transactions, has been on a steady decline since February. This suggests that fewer tokens are changing hands, a sign that long-term holders are accumulating more XRP at lower prices.
This trend could be a positive indicator, showing that these investors believe in the future potential of XRP and are positioning themselves for long-term gains. Despite the accumulation of LTHs, market sentiment remains mixed due to the broader bearish environment.
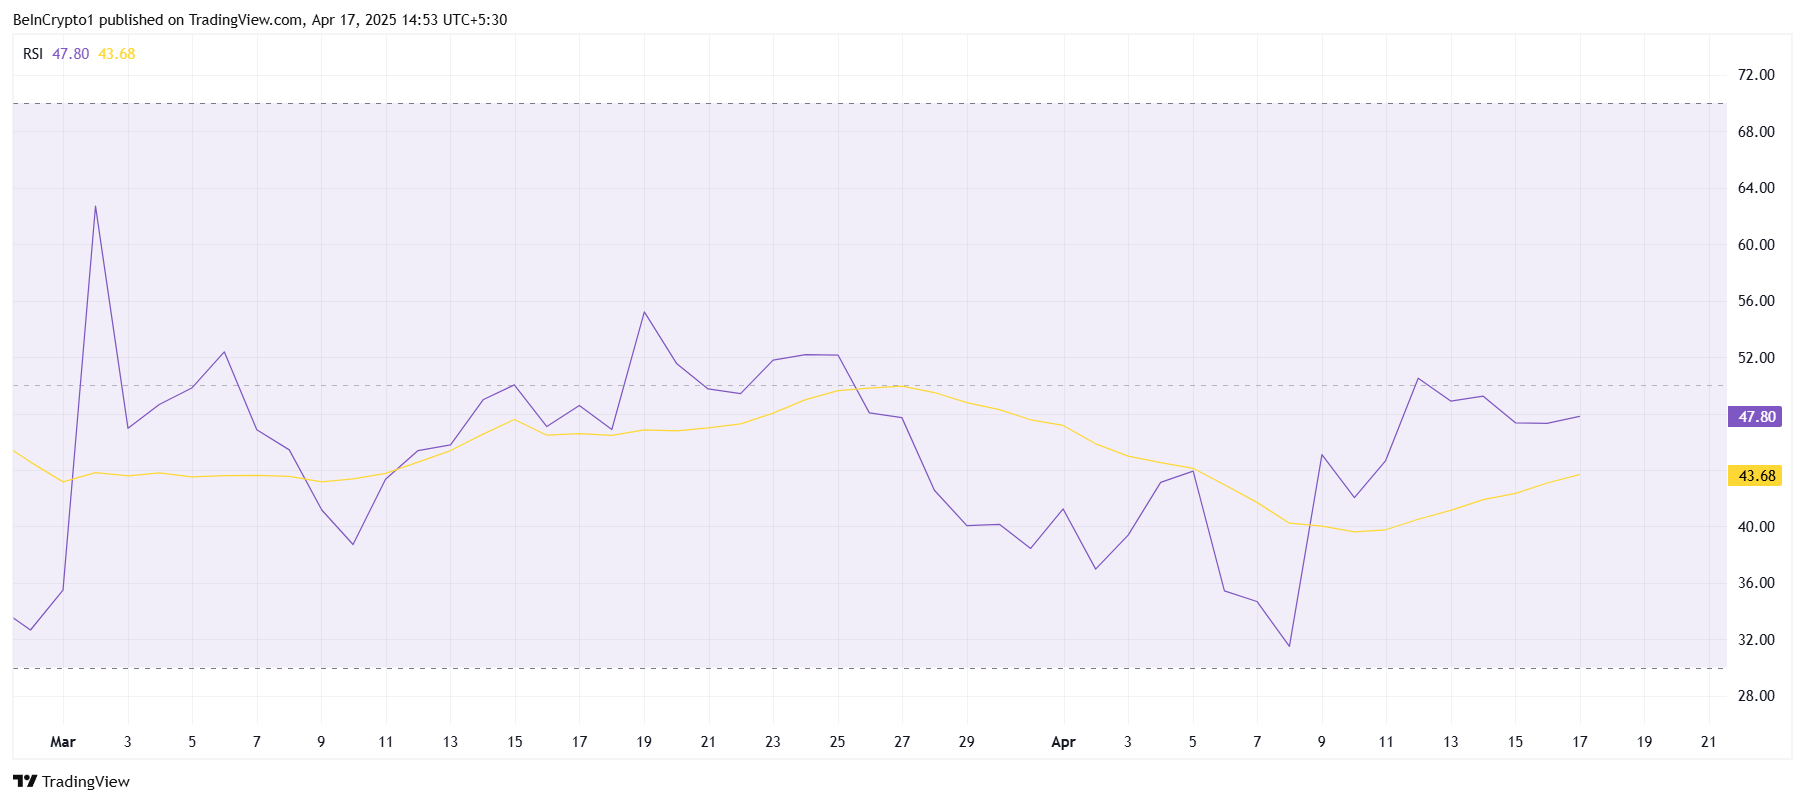
From a technical perspective, the Relative Strength Index (RSI) for XRP has been stuck in the bearish zone for the past two months. While it has occasionally spiked above the neutral line at 50, it has largely remained below, signaling a lack of bullish momentum. This persistent bearish trend has countered the efforts of long-term holders to push the price up.
The RSI’s failure to maintain upward momentum suggests that XRP is still struggling to gain traction. This is exacerbated by the overall bearish market conditions, which have kept investor sentiment subdued.
XRP Price Is Holding
At the time of writing, XRP is trading at $2.08, holding above the support level of $2.02. This indicates that the altcoin is stabilizing despite the recent dip. The support from long-term holders appears to be keeping the price afloat, preventing a further decline.
However, the mixed signals from both technical indicators and market sentiment suggest that XRP is likely to hover under the $2.16 resistance until stronger bullish cues emerge. This range-bound price action could persist, leaving investors uncertain about the next major move.
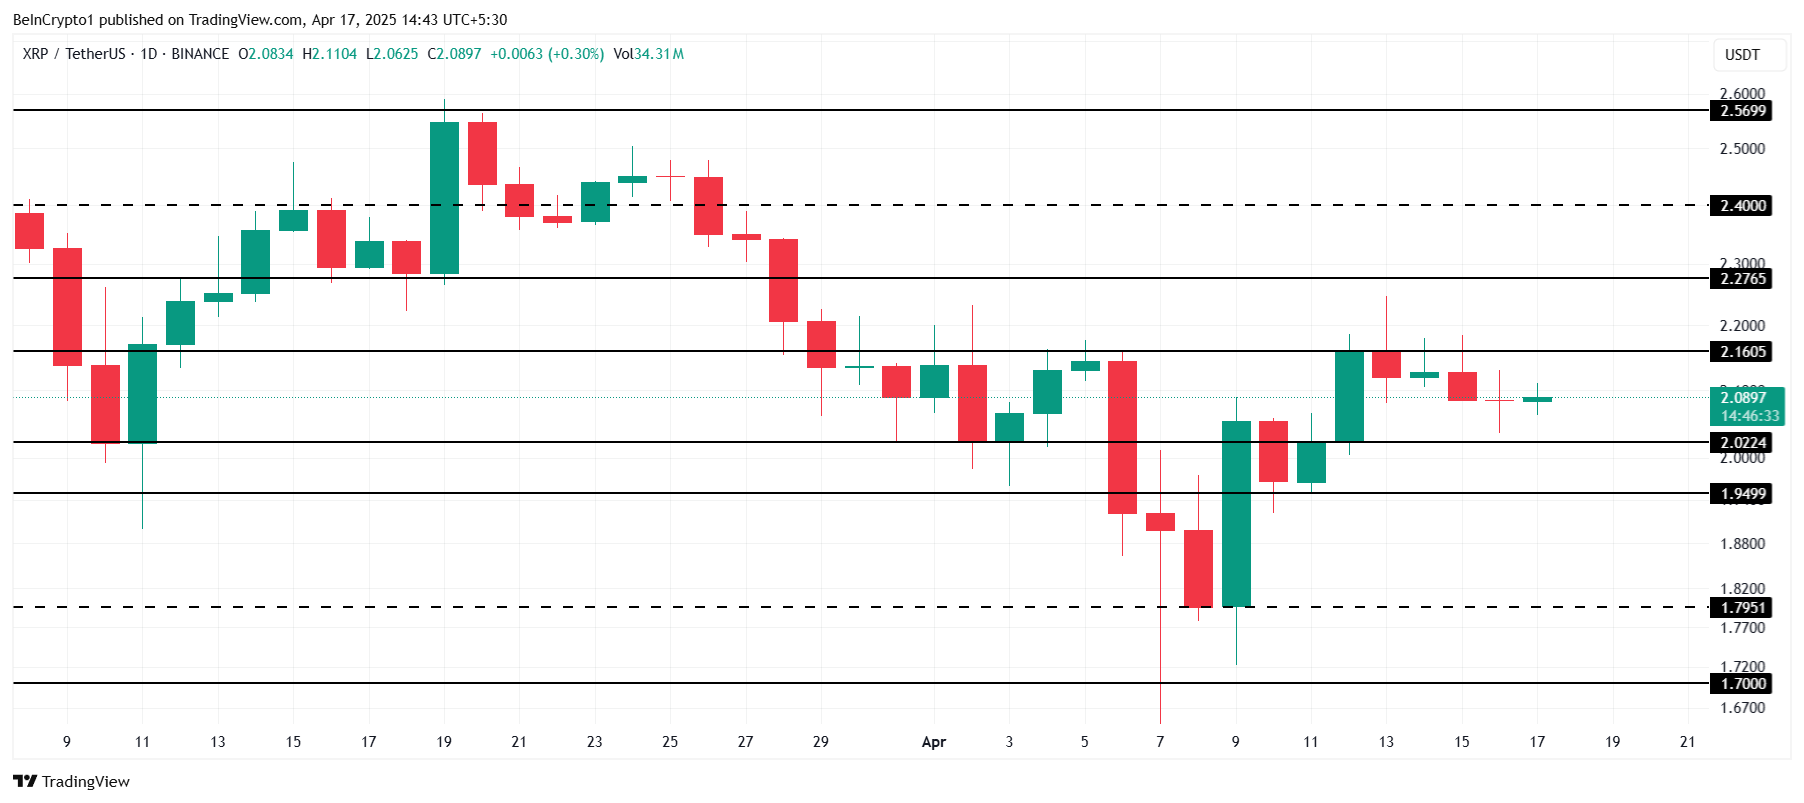
If XRP fails to hold the $2.02 support, the altcoin could fall to $1.94, or potentially even as low as $1.79. A drop below these levels would invalidate the current bullish outlook and could extend the losses for investors, signaling further market weakness.
Disclaimer
In line with the Trust Project guidelines, this price analysis article is for informational purposes only and should not be considered financial or investment advice. BeInCrypto is committed to accurate, unbiased reporting, but market conditions are subject to change without notice. Always conduct your own research and consult with a professional before making any financial decisions. Please note that our Terms and Conditions, Privacy Policy, and Disclaimers have been updated.

The crypto market is going nowhere at the moment, stabilizing instead of rallying or crashing. However, this is not stopping meme coins from noting extravagant rallies as displayed by MANEKI.
BeInCrypto has analyzed two other meme coins that, while not experiencing explosive growth, are still generating enough market movement to make them important assets to watch.
MAGIC•INTERNET•MONEY (Bitcoin) (MIM)
- Launch Date – February 2025
- Total Circulating Supply – 21 Billion MIM
- Maximum Supply – 21 Billion MIM
- Fully Diluted Valuation (FDV) – $65.54 Million
MIM experienced an eventful week with sharp rallies early on, followed by slight declines in the past few days. Currently trading at $0.003026, this meme coin has garnered attention due to its performance as a Bitcoin-based token.
Despite recent declines, MIM has surged by 64% over the past week. The token’s unique positioning as a meme coin on Bitcoin adds to its intrigue, especially as meme coins expand into different blockchain ecosystems. This trend indicates growing investor interest and speculation in such assets.
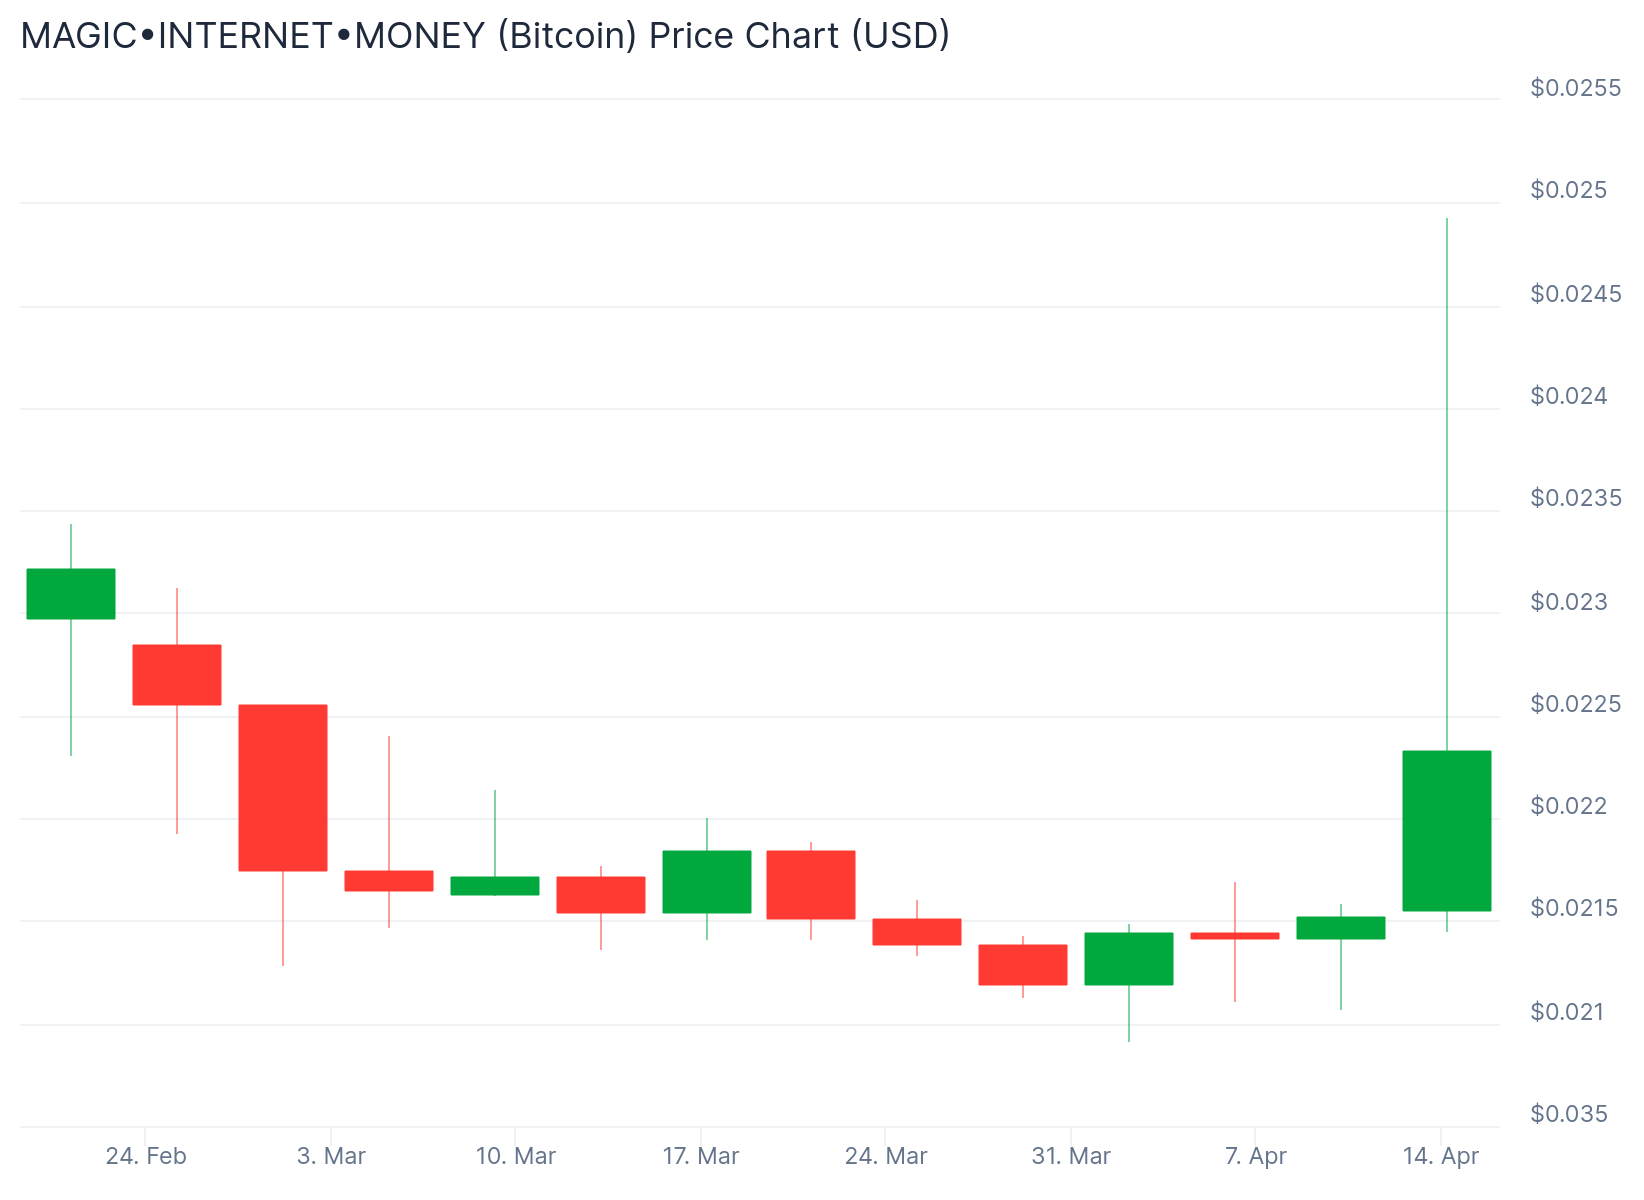
MIM remains primed for further gains, potentially reaching $0.004000 or higher. However, if investors decide to sell, the price could fall back to $0.00200, reflecting the volatility of meme coins. Traders should carefully monitor market sentiment and any signs of selling pressure.
Shiba Inu (SHIB)
- Launch Date – August 2020
- Total Circulating Supply – 589.2 Trillion SHIB
- Maximum Supply – 589.5 Trillion SHIB
- Fully Diluted Valuation (FDV) – $7.01 Billion
Shiba Inu’s price is currently at $0.00001189, continuing its downtrend since the start of the year. While the meme coin shows signs of potential recovery, the reduced burn rate has contributed to limiting upward momentum. A continuation of this trend could hinder any substantial gains for SHIB.
The burn rate for Shiba Inu has dropped significantly, falling by 98% over the last 24 hours. A high burn rate usually helps reduce inflation and supports price growth. The current decline in burn rate presents challenges, as it reduces demand and further limits SHIB’s ability to recover in the short term.
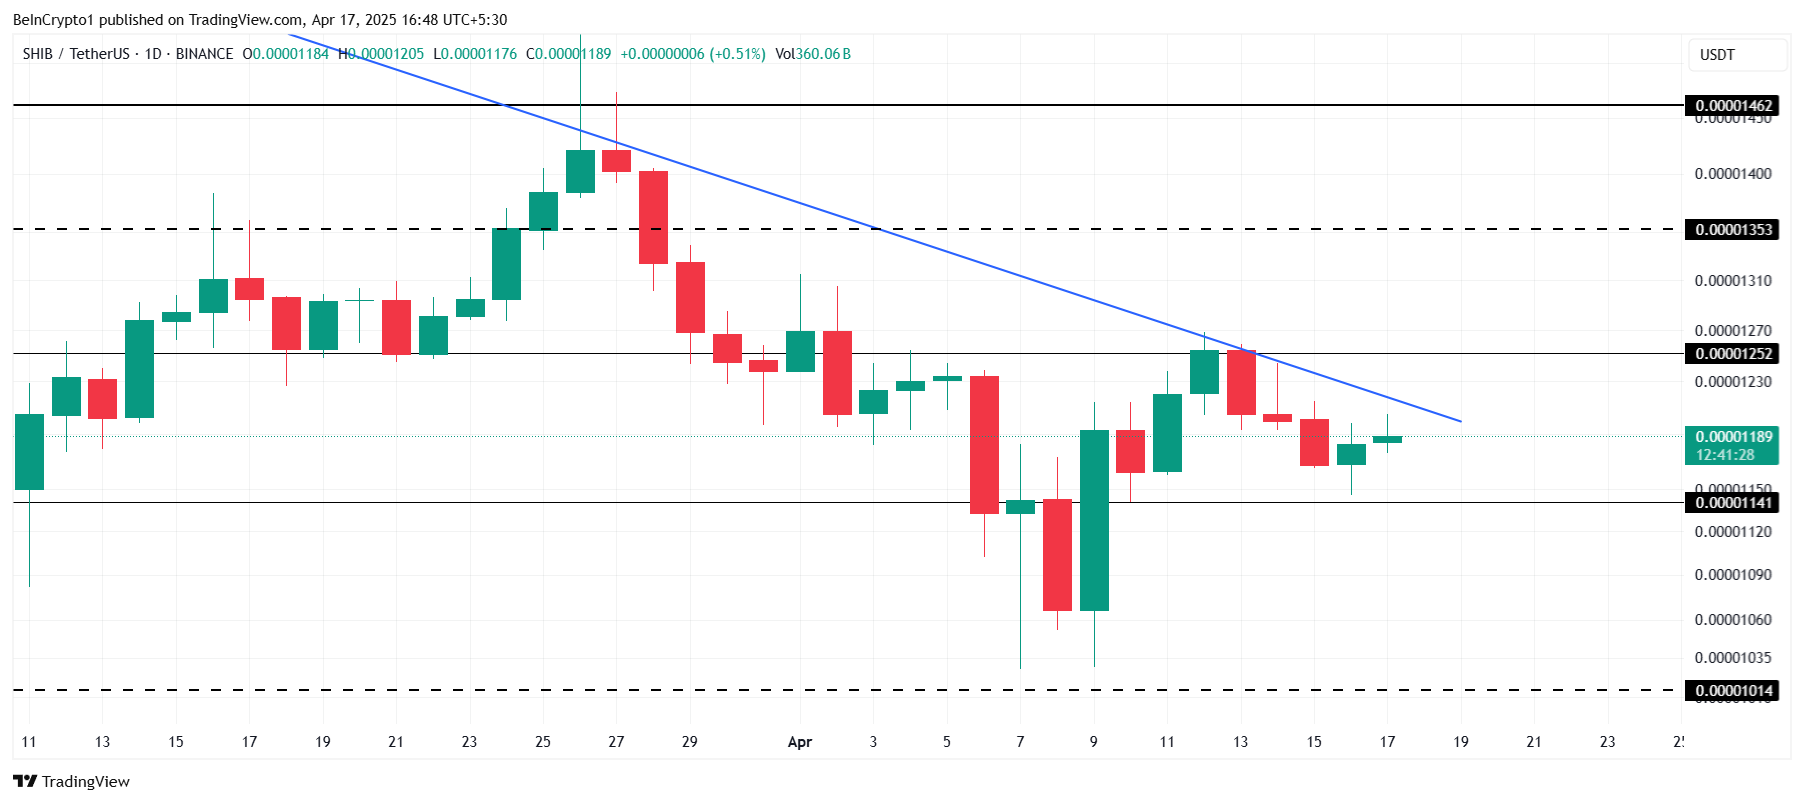
SHIB is holding above the support level of $0.00001141 and may continue to consolidate around this price point. However, if it breaches the $0.00001252 resistance, it could invalidate the bearish-neutral outlook.
Small Cap Corner : MANEKI (MANEKI)
- Launch Date – April 2024
- Total Circulating Supply – 8.85 Billion MANEKI
- Maximum Supply – 8.88 Billion MANEKI
- Fully Diluted Valuation (FDV) – $38.45 Million
MANEKI has emerged as one of the top-performing tokens this month, gaining 33% over the past week. In the last 24 hours alone, the meme coin surged by more than 30%, showing strong potential for further upward movement. The growth in the cat-themed token market is fueling this momentum.
Despite being a small-cap token, MANEKI has caught the attention of investors. The growing interest in cat-themed tokens has added to its appeal. Currently trading at $0.0043, the coin is on the verge of breaching the $0.0047 resistance. A successful breakthrough could push the price to $0.0055.

However, if the price fails to breach $0.0047, the coin could fall back to $0.0036. Losing this support would invalidate the bullish thesis, causing a drop to $0.0022. Investors need to monitor the price closely to determine the next potential move for MANEKI.
Disclaimer
In line with the Trust Project guidelines, this price analysis article is for informational purposes only and should not be considered financial or investment advice. BeInCrypto is committed to accurate, unbiased reporting, but market conditions are subject to change without notice. Always conduct your own research and consult with a professional before making any financial decisions. Please note that our Terms and Conditions, Privacy Policy, and Disclaimers have been updated.

Welcome to the US Morning Crypto News Briefing—your essential rundown of the most important developments in crypto for the day ahead.
Grab a coffee to see what experts have to say about Bitcoin’s (BTC) price outlook. Key investment strategies are driving the next directional bias for the pioneer crypto.
Is a $90,000 Breakout Imminent for Bitcoin?
Crypto markets continue to reel from Trump-infused volatility, which weighs heavily on investor sentiment. Traders and investors are bracing for macroeconomic headwinds that continue to temper modest gains.
Among them is Trump’s tariff chaos, which provoked China’s retaliatory stance. Adding another layer of complexity to the US crypto news, Federal Reserve (Fed) chair Jerome Powell ruled out a near-term rate cut, citing economic uncertainty and risks from trade policy.
Reports also indicate that China is liquidating seized cryptocurrencies through private firms to support local government finances amid economic struggles.
The macro context also includes Jerome Powell’s hawkish Federal Reserve (Fed) stance, which ruled out a near-term rate cut.
Amidst this uncertainty, investors may delay allocating capital to high-volatility assets until the macroeconomic outlook stabilizes.
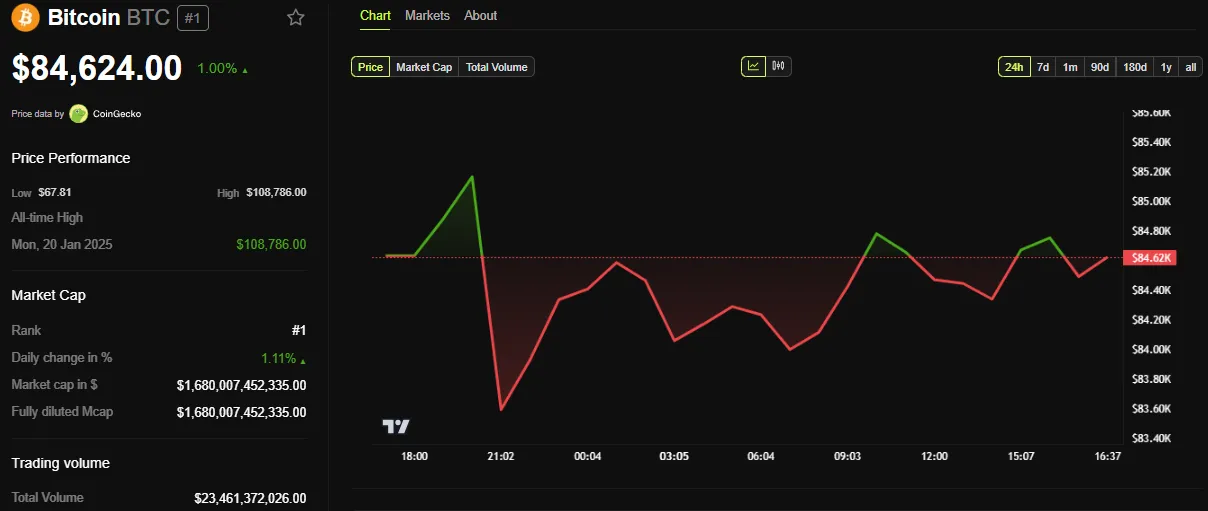
This likely explains Bitcoin’s stunted outlook, oscillating between the $80,000 and $90,000 psychological levels.
However, despite the concerns, analysts are still optimistic, citing key investment or trading strategies. BeInCrypto contacted Blockhead Research Network (BRN) analyst Valentin Fournier, who alluded to the Wyckoff price cycle.
“Our base case remains an accumulation phase, with occasional dips likely before Bitcoin can make a clean break above the $89,000–$90,000 resistance,” Fournier told BeInCrypto.
The Wyckoff Price Cycle, developed by Richard Wyckoff, is a technical analysis framework to identify market trends and trading opportunities. It consists of four phases:
- Accumulation: Where smart money buys at low prices, often marked by a “spring” (a false breakdown).
- Markup: A bullish phase with rising prices.
- Distribution: Where smart money sells at highs, also featuring a “spring” (false breakout).
- Markdown: A bearish phase with declining prices.
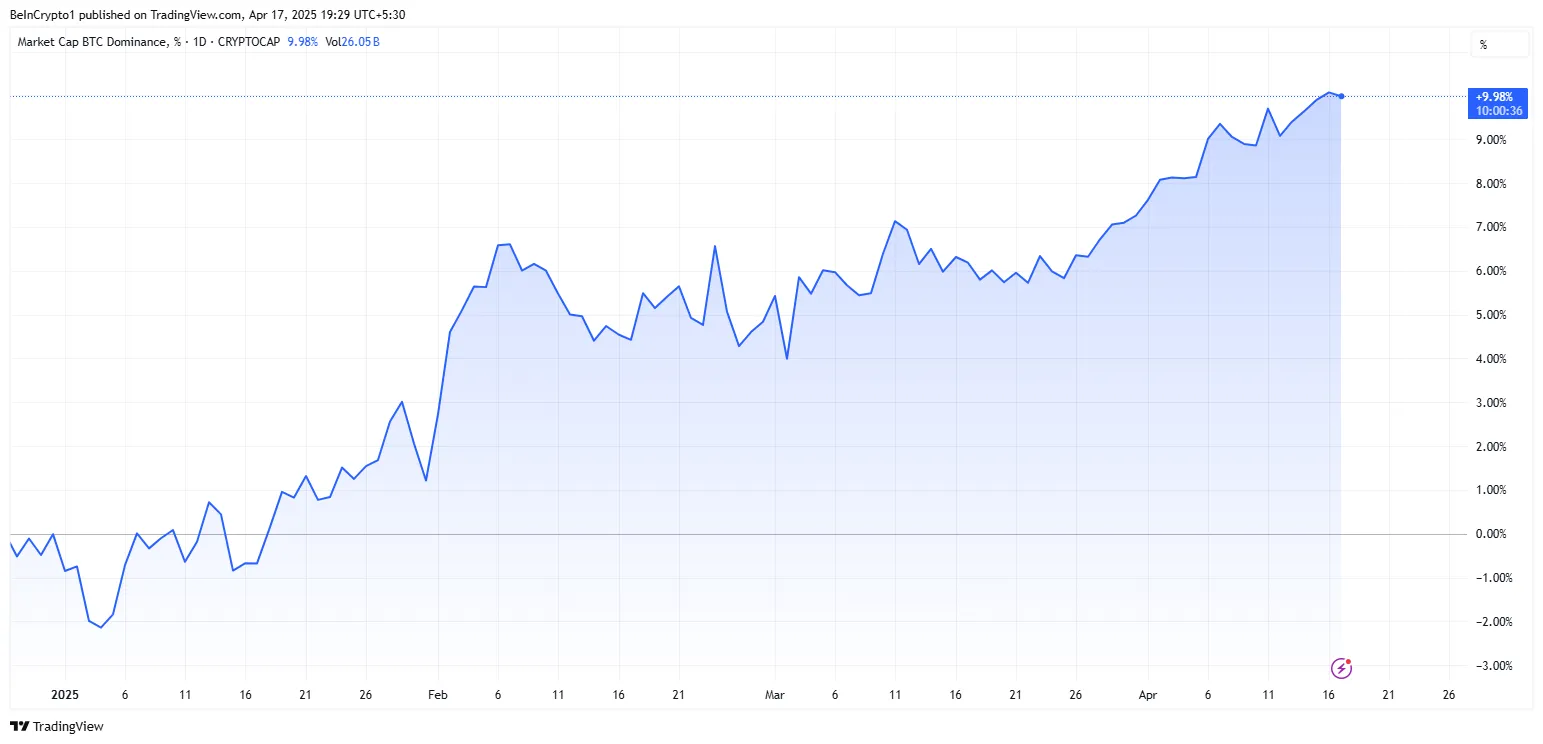
Fournier added that because Bitcoin dominance continues to rise, this suggests altcoins could continue underperforming in the short term.
He also noted that, in contrast to Bitcoin’s strength, trade tensions have affected traditional markets more.
“This is highlighted by Nvidia’s decline following new export restrictions on chips to China,” he said.
What Does Options Data Say?
If the accumulation phase thesis is true, it aligns with a recent analysis by Deribit’s Tony Stewart, highlighting trader sentiment favoring the upside.
The bullish cohort is buying $90,000 to $100,000 Calls, suggesting bets on a price rise for Bitcoin. However, others are bearish, buying $80,000 Puts and selling $100,000+ Calls, indicating they expect a decline or hedging.
Likewise, funding strategies reveal bullish traders are rolling up positions from $84,000 to $90,000 Calls and selling lower Puts ($75,000) to finance their bets. This indicates confidence in a near-term rally.
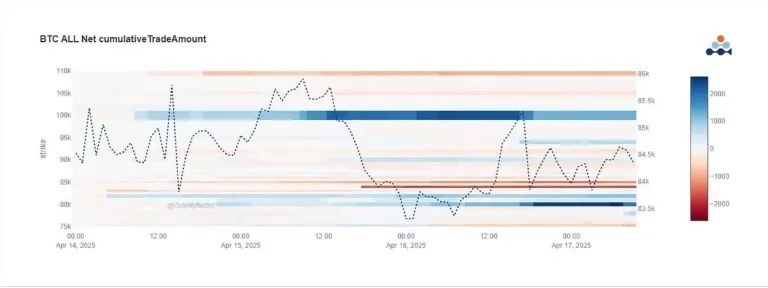
Chart of the Day
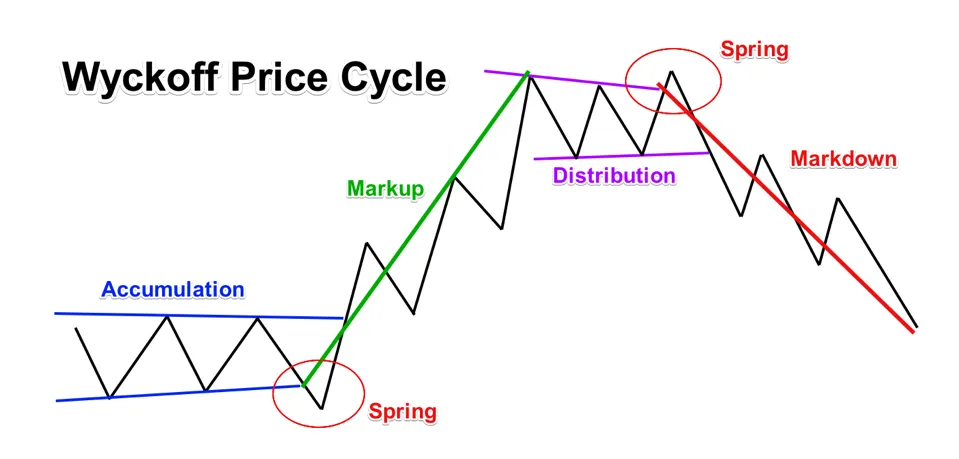
Traders analyze these repeating phases’ price action, volume, and market structure. Based on that, they can spot reversals and time entries or exits while understanding institutional behavior.
Byte-Sized Alpha
- Bitcoin whales withdrew over $280 million from exchanges in one day, signaling a bullish move toward cold storage amid market volatility.
- Gary Gensler warns that many altcoins lack solid fundamentals, and their value is driven more by sentiment, making them unsustainable.
- CEO Richard Teng confirms that Binance advises global governments on crypto policy and helps countries establish crypto reserves.
- Coinbase forecasts short-term crypto volatility through mid-May 2025, citing economic pressures and trade policy uncertainties.
- Ethereum’s dominance has dropped to 7.3%, hitting a 5-year low, which analysts view as a rare long-term buying opportunity.
- A16z urges the SEC to modernize crypto custody rules, advocating for RIAs to self-custody digital assets under clear safeguards.
- Bitcoin struggles below $85,000, and open interest remains stagnant below $36 billion, indicating indecision among traders. Positive funding rates hint at renewed optimism.
- Base reveals ambitious Q2 roadmap only hours after a meme coin, allegedly promoted by insiders, triggered a trading frenzy and abrupt collapse.
Crypto Equities Pre-Market Overview
| Company | At Close April 16 | Pre-Market Overview |
| Strategy (MSTR) | $311.66 | $315.50 (+1.31%) |
| Coinbase Global (COIN) | $172.21 | $174.10 (+1.10%) |
| Galaxy Digital Holdings (GLXY.TO) | $15.58 | $15.15 (-2.69%) |
| MARA Holdings (MARA) | $12.32 | $12.40 (+0.65%) |
| Riot Platforms (RIOT) | $6.36 | $6.41 (+0.79%) |
| Core Scientific (CORZ) | $6.59 | $6.68 (+1.37) |
Disclaimer
In adherence to the Trust Project guidelines, BeInCrypto is committed to unbiased, transparent reporting. This news article aims to provide accurate, timely information. However, readers are advised to verify facts independently and consult with a professional before making any decisions based on this content. Please note that our Terms and Conditions, Privacy Policy, and Disclaimers have been updated.

Coinbase Reveals Efforts To Make Its Solana Infrastructure Faster, Here’s All

XRP Price Finds Stability Above $2 As Opposing Forces Collide
Analyst Claims Pi Network’s Momentum Is Building Fast As Pi Coin Looks To Reclaim $1

MANEKI Leads With 333% Rally

XRP Continues To Outpace ETH For 5 Months; What Lies Ahead?
Bitcoin Price Poised for $90,000 Surge

2.52 Million Altcoins Are Ruining Crypto’s Future

Animoca Brands Valuation Tanks 75% In Two Years, Here’s Why

Crypto exchange BingX hacked for $43 million

Are The Big Players Losing Interest?

Hong Kong’s Securities Association Tips Authorities On Crypto Self-Regulation

Coinbase cbBTC Set to go Live on Solana
2.52 Million Altcoins Are Ruining Crypto’s Future
Animoca Brands Valuation Tanks 75% In Two Years, Here’s Why
Crypto exchange BingX hacked for $43 million
Are The Big Players Losing Interest?
Hong Kong’s Securities Association Tips Authorities On Crypto Self-Regulation
Coinbase cbBTC Set to go Live on Solana
-

 Market22 hours ago
Pi Network Drops10% as Outflows Surge, Death Cross Looms
-
 Altcoin22 hours ago
DOGE Whale Moves 478M Coins As Analyst Predicts Dogecoin Price Breakout “Within Hours”
-

 Market23 hours ago
Raydium’s New Token Launchpad Competes with Pump.fun
-

 Market20 hours ago
Bitcoin and Ethereum Now Accepted by Panama City Government
-
 Ethereum20 hours ago
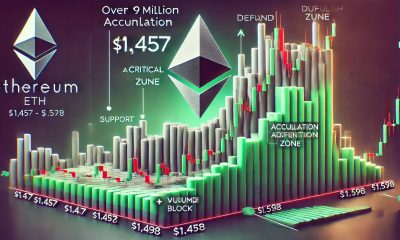
Over 1.9M Ethereum Positioned Between $1,457 And $1,598 – Can Bulls Hold Support?
-
 Bitcoin19 hours ago
ETF Issuers Bring Stability to Bitcoin Despite Tariff Chaos
-

 Market18 hours ago
Base Meme Coin Wipes $15 Million After Official Promotion
-

 Market17 hours ago
Crypto Market Lost $633 Billion in Q1 2025, CoinGecko Finds
