
Market
Ethereum (ETH) Tanks to March 2023 Levels as ETH/BTC Ratio Plummets to 5-Year Low

The value of the leading altcoin, Ethereum, has plunged to its lowest point since March 2023, signaling a steep decline in market confidence. This has happened amid the broader market’s downturn, which was exacerbated by Donald Trump’s Liberation Day.
Compounding the bearish sentiment, the ETH/BTC ratio has now dropped to a five-year low, indicating that Bitcoin is gaining relative strength against Ethereum.
ETH/BTC Ratio Hits 5-Year Low as Traders Flee
ETH’s price decline has pushed the ETH/BTC ratio to a five-year low of 0.019. This ratio measures ETH’s relative value compared to BTC. When it rises, it indicates that ETH is outperforming BTC, either because the altcoin’s price is growing faster or the king coin’s price is falling.
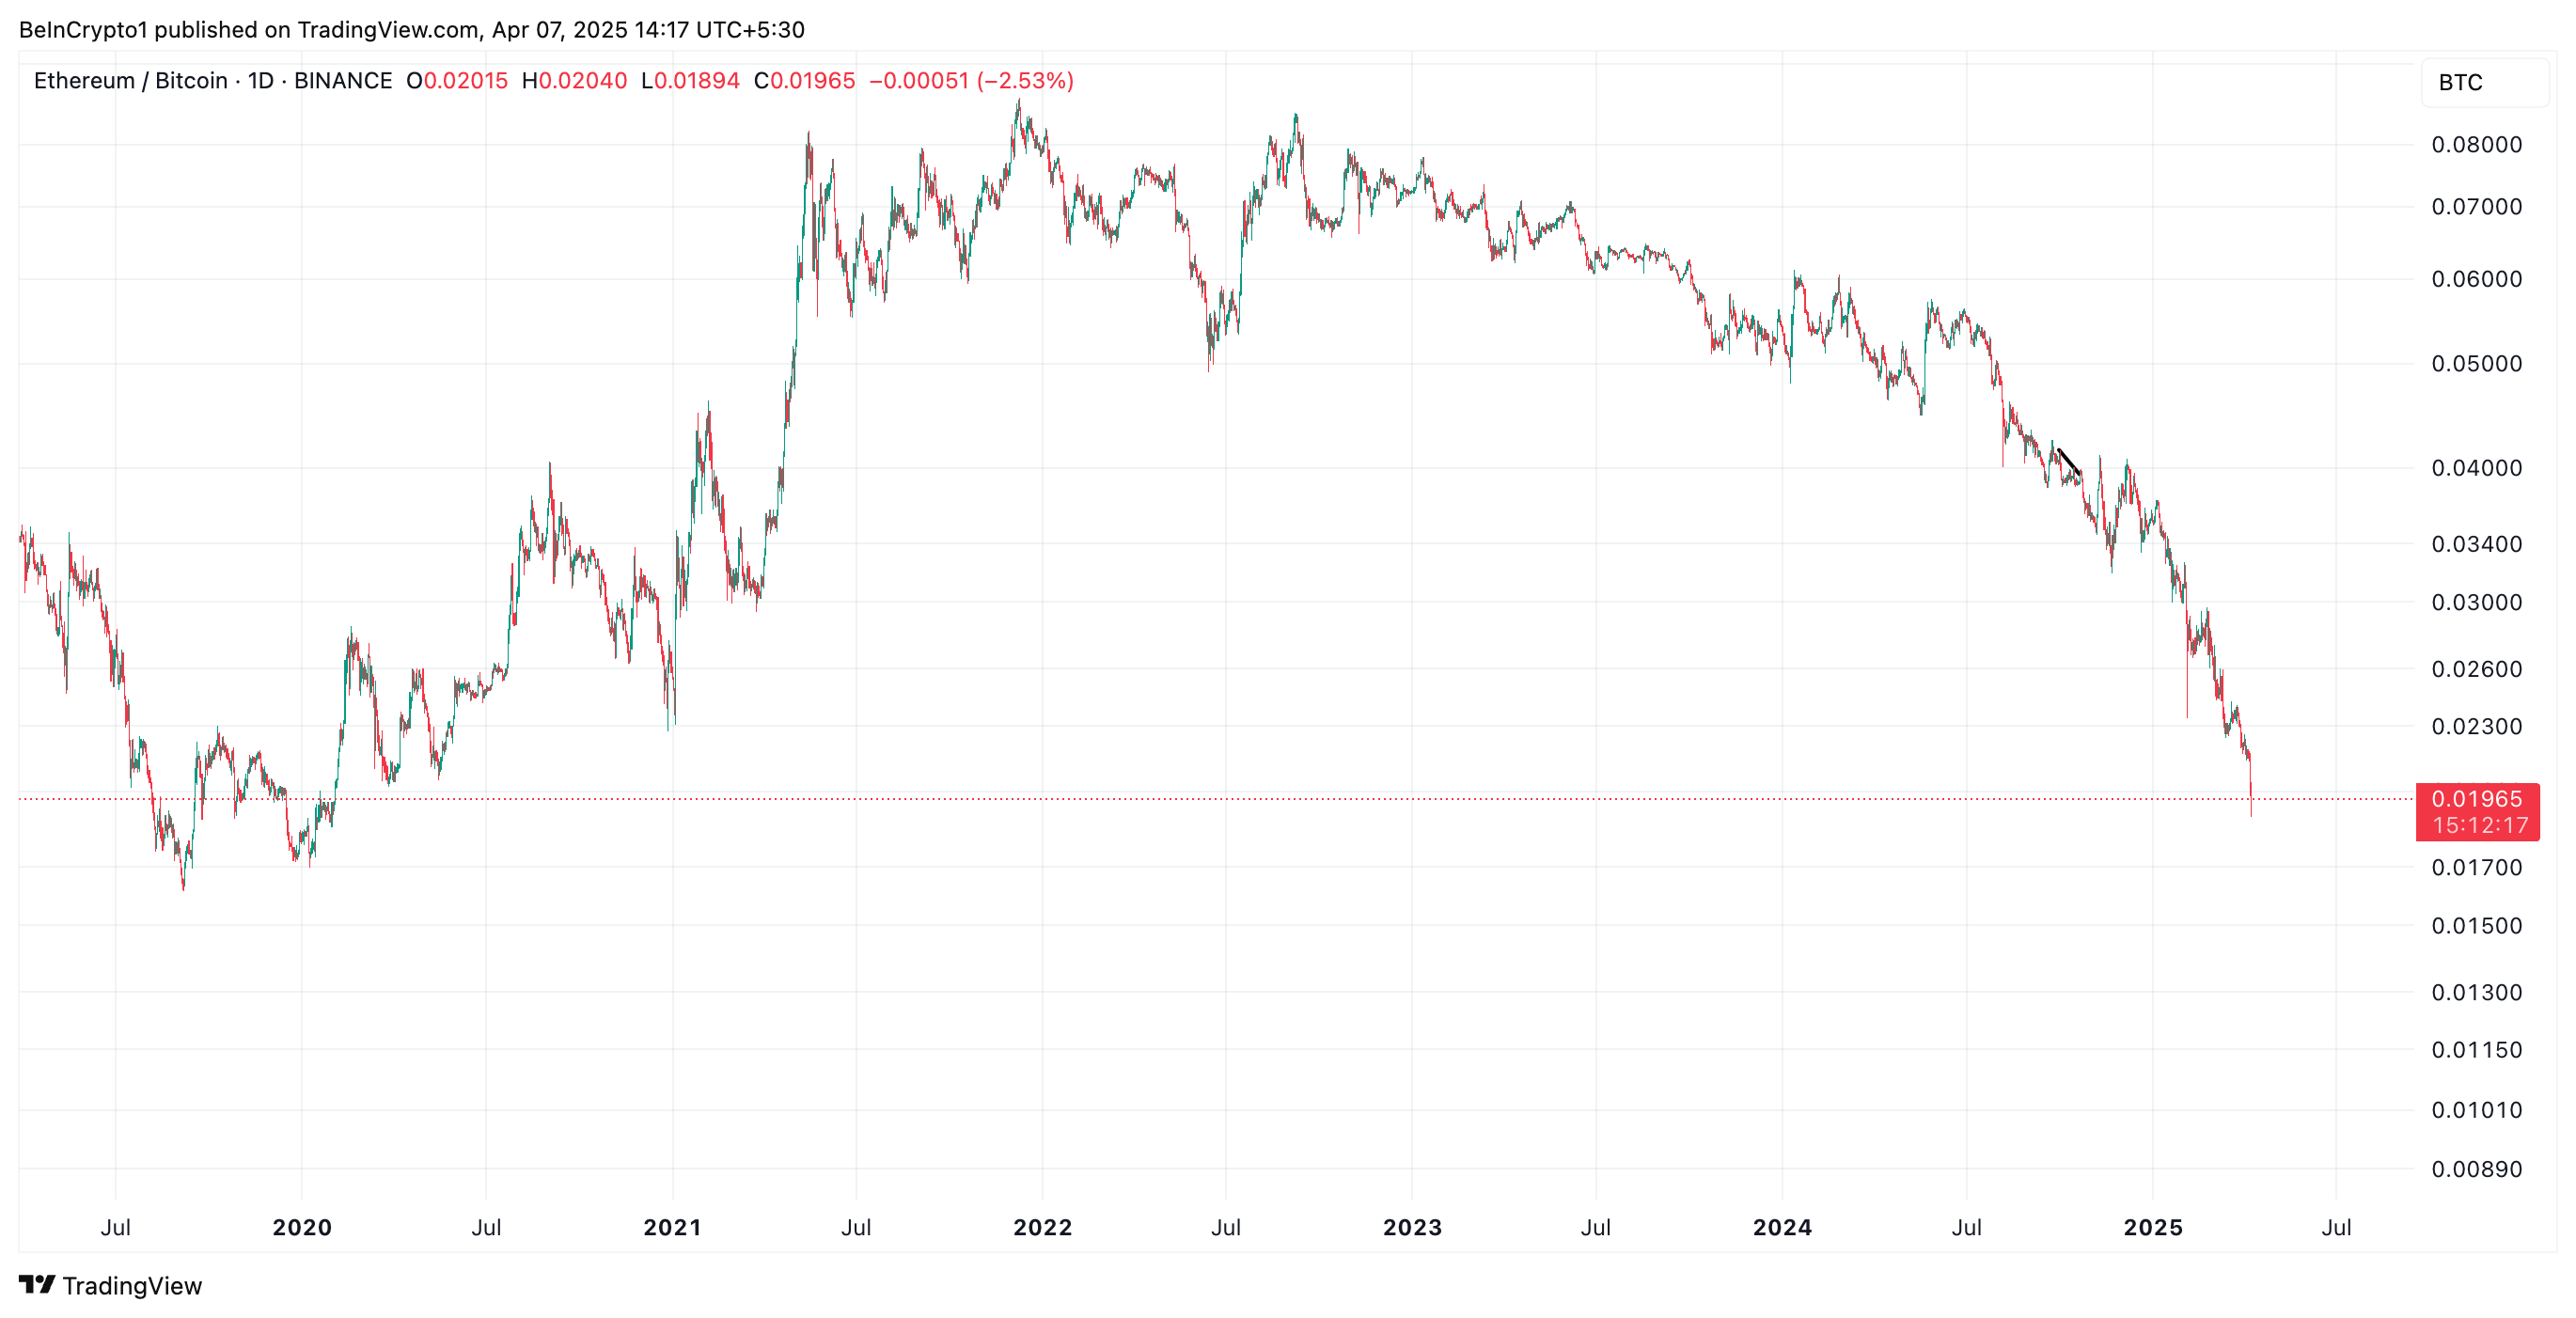
Conversely, a decline like this suggests that the leading coin, BTC, is gaining strength relative to the top altcoin, ETH. It suggests that traders are moving capital into BTC, seeing it as a safer or more profitable investment at the moment despite its own price troubles.
Further, on the daily chart, ETH’s negative Chaikin Money Flow (CMF) confirms the coin’s plummeting demand. At press time, it is at -0.07.
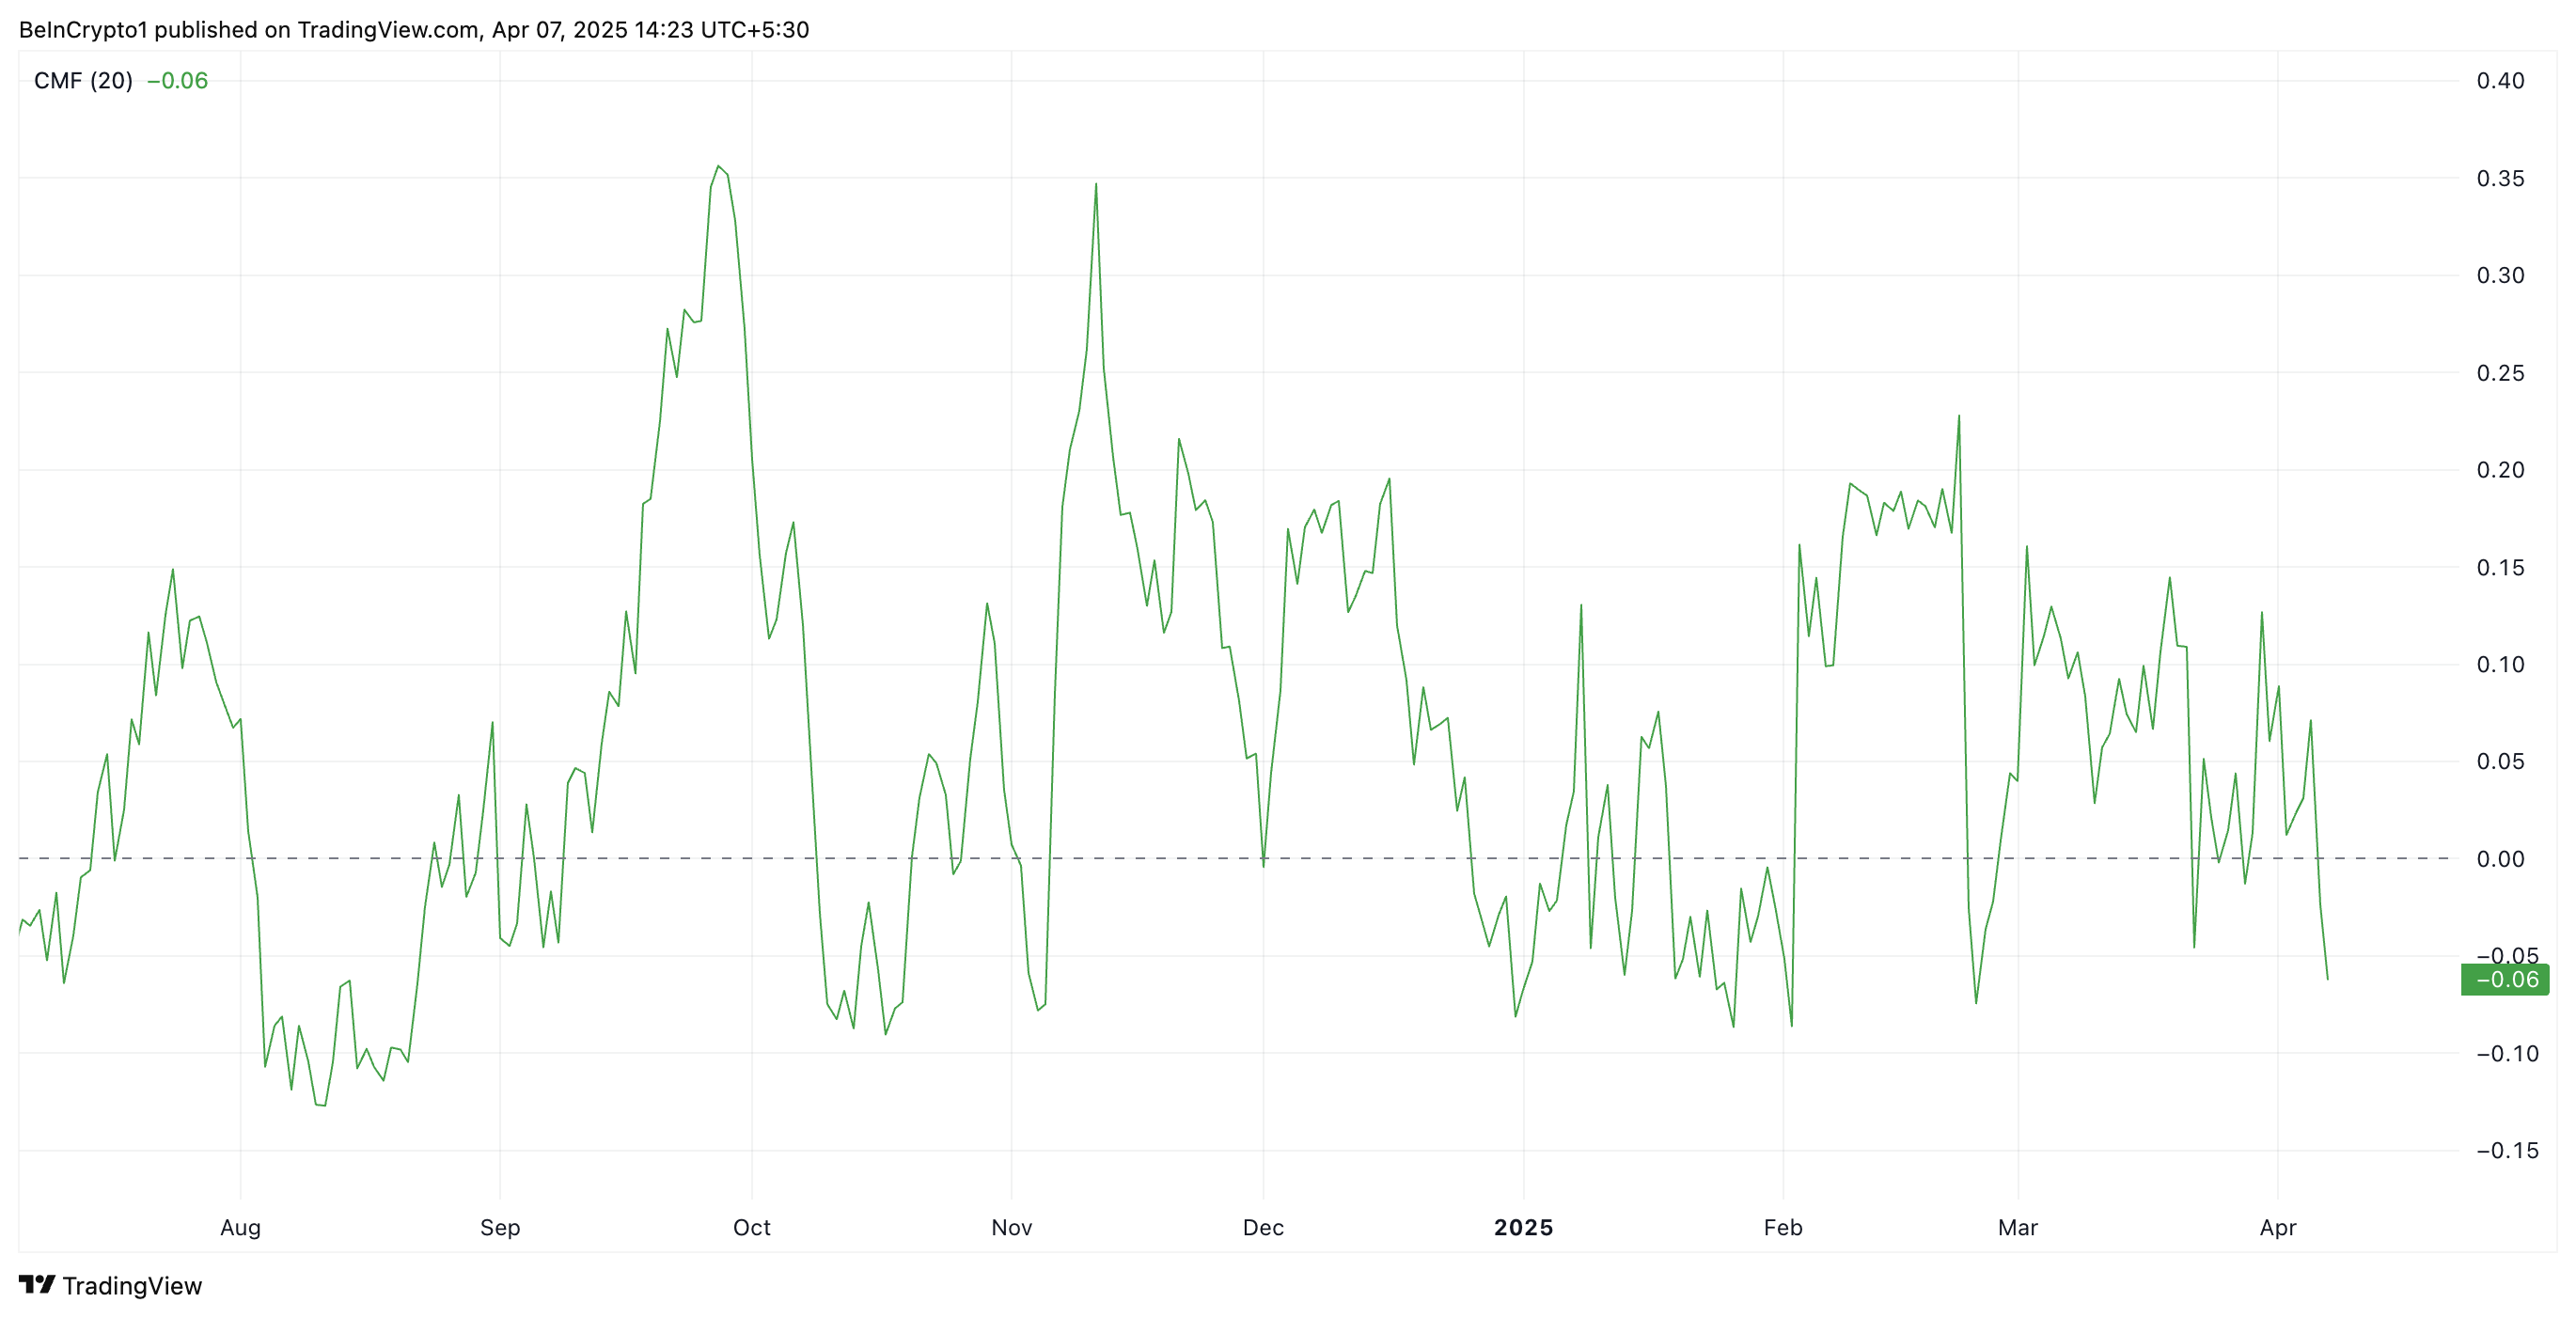
The CMF indicator measures the volume-weighted accumulation and distribution of an asset over a set period, helping gauge buying and selling pressure. When its value falls below zero like this, it indicates that selling pressure is dominating.
ETH’s CMF readings suggest that more traders are distributing (selling) the coin than accumulating it. This reflects weakening demand and is a bearish signal for the asset’s price momentum.
ETH Flashes Oversold Signal: Is a Bounce Back on the Horizon?
ETH’s Relative Strength Index (RSI), observed on a one-day chart, shows that the altcoin is currently oversold. At press time, the momentum indicator is in a downtrend at 25.62.
The RSI indicator measures an asset’s overbought and oversold market conditions. It ranges between 0 and 100. Values above 70 suggest that the asset is overbought and due for a price decline, while values under 30 indicate that the asset is oversold and may witness a rebound.
At 25.62, ETH’s RSI signals that the coin is deeply oversold. This presents a buying opportunity, as such lows are usually followed by a price rebound.
If this happens, ETH’s price could regain and climb back above $1,589. If this support level strengthens, it could propel ETH’s value to $1,904.
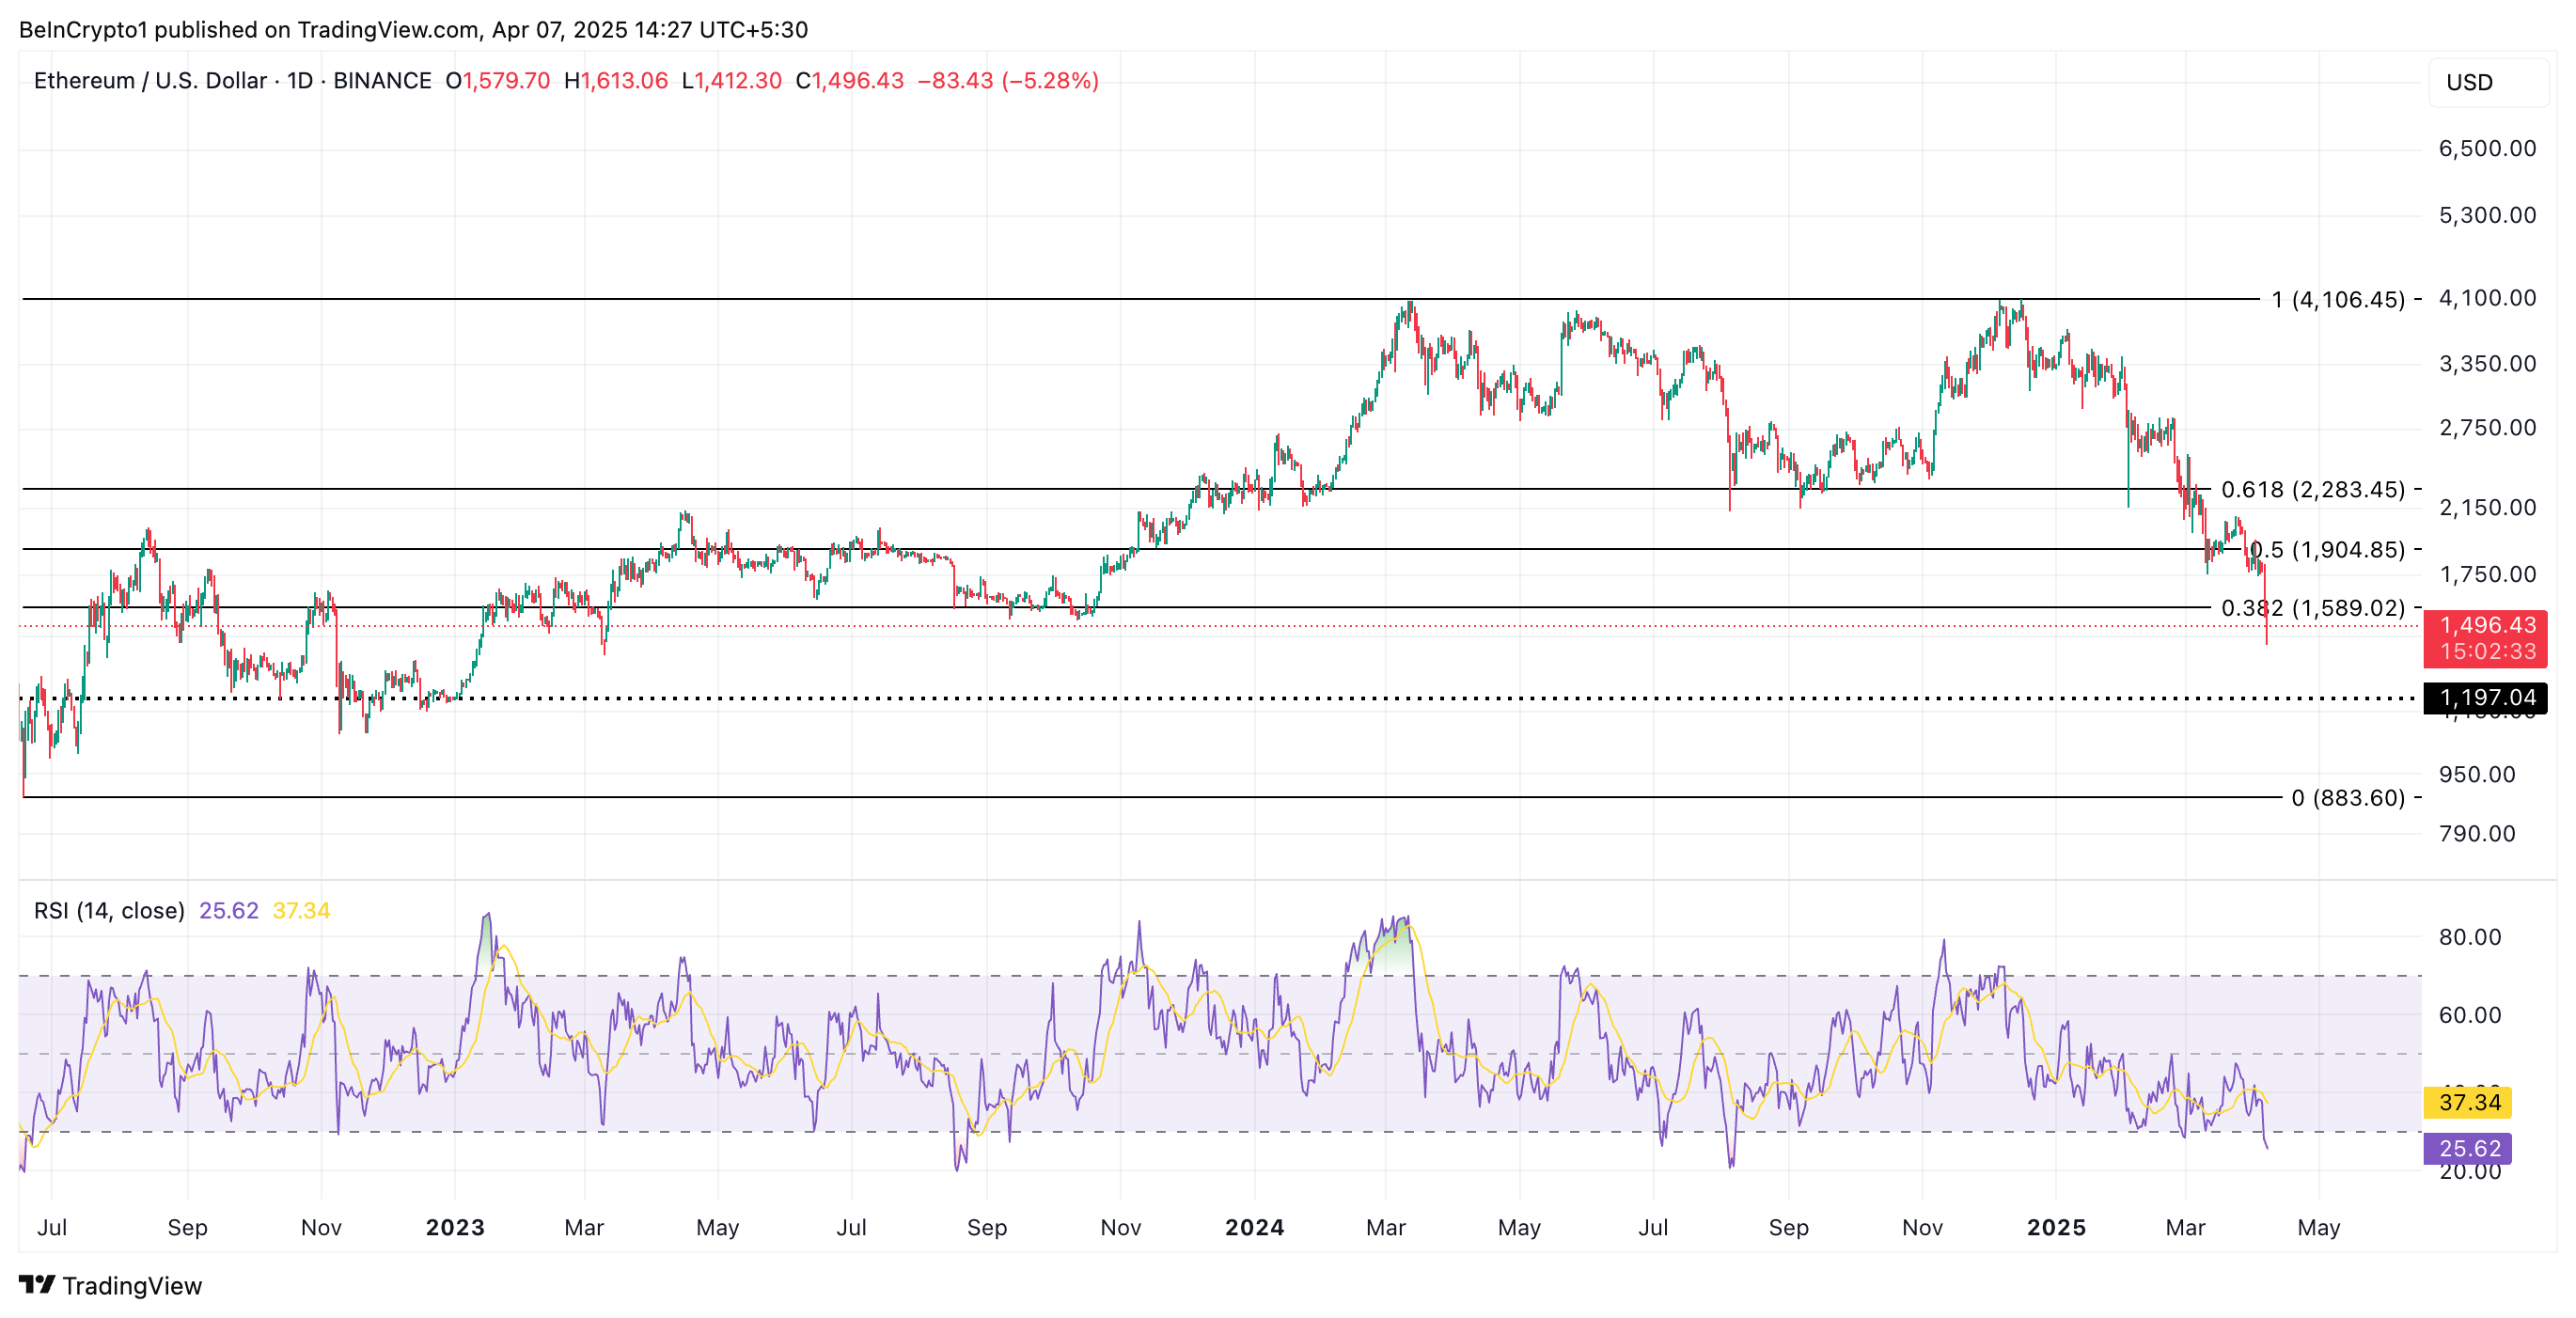
However, this rebound is not guaranteed. If ETH bears maintain dominance and selloffs continue, the coin could extend its decline and fall toward $1,197.
The post Ethereum (ETH) Tanks to March 2023 Levels as ETH/BTC Ratio Plummets to 5-Year Low appeared first on BeInCrypto.


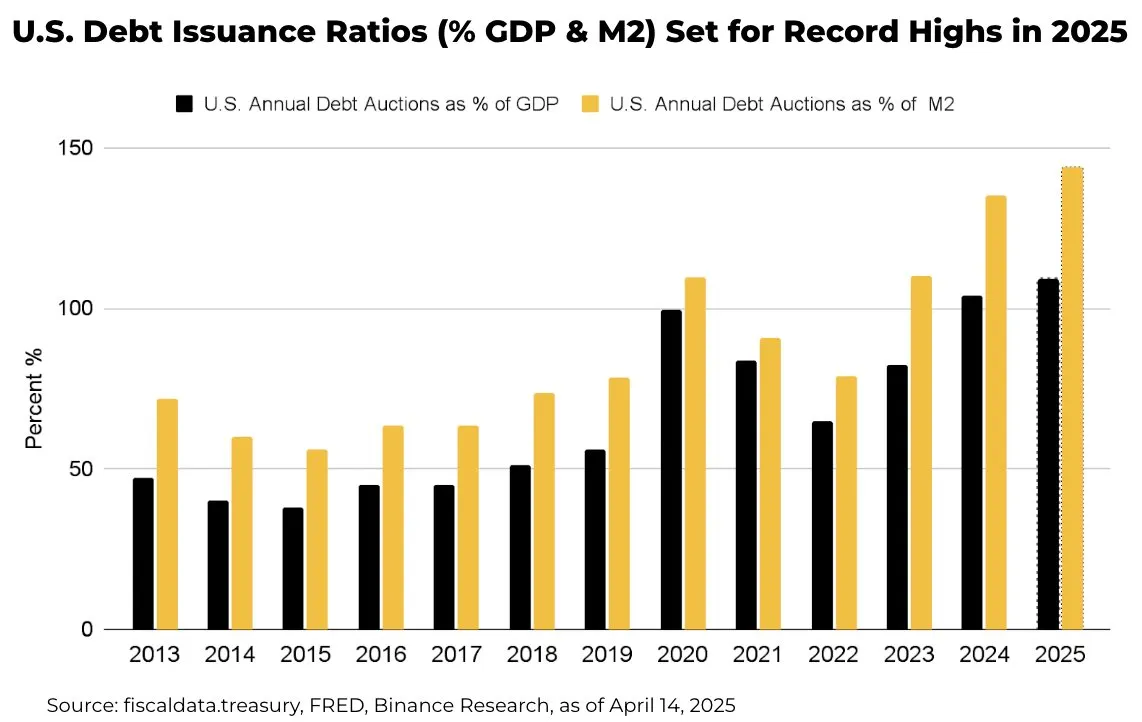
US Treasury plans to issue over $31 trillion in bonds this year—around 109% of GDP and 144% of M2. This would be the highest recorded level of bond issuance in history. How will it impact the crypto market?
Heavy supply may push yields higher, as Treasury financing needs outstrip demand. Higher yields increase the opportunity cost of holding non‑yielding assets like Bitcoin and Ethereum, potentially drawing capital away from crypto.
US Bonds Might Add to the Crypto Market’s Volatility
The whole narrative potentially boils down to foreign demand for US bonds. Overseas investors hold roughly one‑third of US debt.
Any reduction in appetite—whether due to tariffs or portfolio rebalances—could force the Treasury to offer even steeper yields. Rising yields tend to tighten global liquidity, making risk assets like cryptocurrencies less attractive.
When yields climb, equities and crypto can face selling pressure. For example, during the 2022 bond sell‑off, Bitcoin fell more than 50% alongside Treasury yields spiking. A repeat scenario could test crypto’s appeal.
Meanwhile, the US dollar’s strength could compound headwinds. As yields rise, the dollar typically gains. A stronger dollar makes Bitcoin’s USD‑denominated price more expensive for overseas buyers, dampening demand.
Yet crypto offers unique attributes. In periods of extreme monetary expansion, such as post‑pandemic, investors turned to Bitcoin as an inflation hedge.
Even if higher yields curb speculative flows, crypto’s finite supply and decentralized nature may sustain a baseline of buyer interest.
Technically, Bitcoin’s correlation to yields may weaken if Treasury issuance triggers broader macro volatility. When bond markets are hit by trade or fiscal policy shocks, traders may turn to digital assets to diversify since they don’t move in step.
However, that thesis hinges on continued institutional adoption and favorable regulation.
Crypto’s liquidity profile also matters. Large bond sales often drain bank reserves—tightening funding markets.
In theory, tighter liquidity could boost demand for DeFi protocols offering higher yields than traditional money markets.
Overall, record US debt supply points to higher yields and a stronger dollar—volatility for crypto as a risk asset.
Yet crypto’s inflation‑hedge narrative and evolving technical role in diversified portfolios could temper volatility. Market participants should watch foreign demand trends and liquidity conditions as key indicators for crypto’s next moves.
Disclaimer
In adherence to the Trust Project guidelines, BeInCrypto is committed to unbiased, transparent reporting. This news article aims to provide accurate, timely information. However, readers are advised to verify facts independently and consult with a professional before making any decisions based on this content. Please note that our Terms and Conditions, Privacy Policy, and Disclaimers have been updated.

Ethereum (ETH) continues to struggle below the $2,000 mark, a level it hasn’t reclaimed since March 28, as bearish momentum lingers across both technical and on-chain indicators. Despite attempts to stabilize, recent data reveals rising concentration of ETH among whale wallets, alongside persistent weakness in trend indicators like EMA lines.
At the same time, retail and mid-sized holders are gradually losing share, further skewing ownership toward large players. This combination of declining retail participation and heavy whale dominance may leave ETH increasingly vulnerable to sharp corrections if sentiment turns.
ETH Whale Holdings Hit 9-Year High, Raising Centralization Concerns
The amount of ETH held by whale addresses—wallets controlling more than 1% of the total circulating supply—has reached its highest level since 2015, sitting at 46%.
This marks a significant shift in Ethereum’s ownership data, as whales surpassed the holdings of retail investors back on March 10 and have continued to grow their share since. In comparison, investor-level addresses, which hold between 0.1% and 1% of supply, and retail wallets, which hold less than 0.1%, have both seen declines in their share of ETH.
The jump from 43% to 46% in just a few months reflects a sharp accumulation trend among the largest holders, suggesting a growing concentration of ETH in fewer hands.

Whales typically represent institutional investors, funds, or early adopters, and their behavior can significantly impact price due to the volume they control. Investor-level addresses often reflect high-net-worth individuals or smaller institutions, while retail addresses include everyday traders and holders.
While some might see the rise in whale holdings as a vote of confidence, it also increases the risk of sudden volatility if large holders begin offloading.
With retail and investor participation shrinking, the market may become more fragile and vulnerable to sharp, unexpected price movements driven by a few dominant players.
Whales Holding 1,000 to 100,000 ETH Now Control $59 Billion
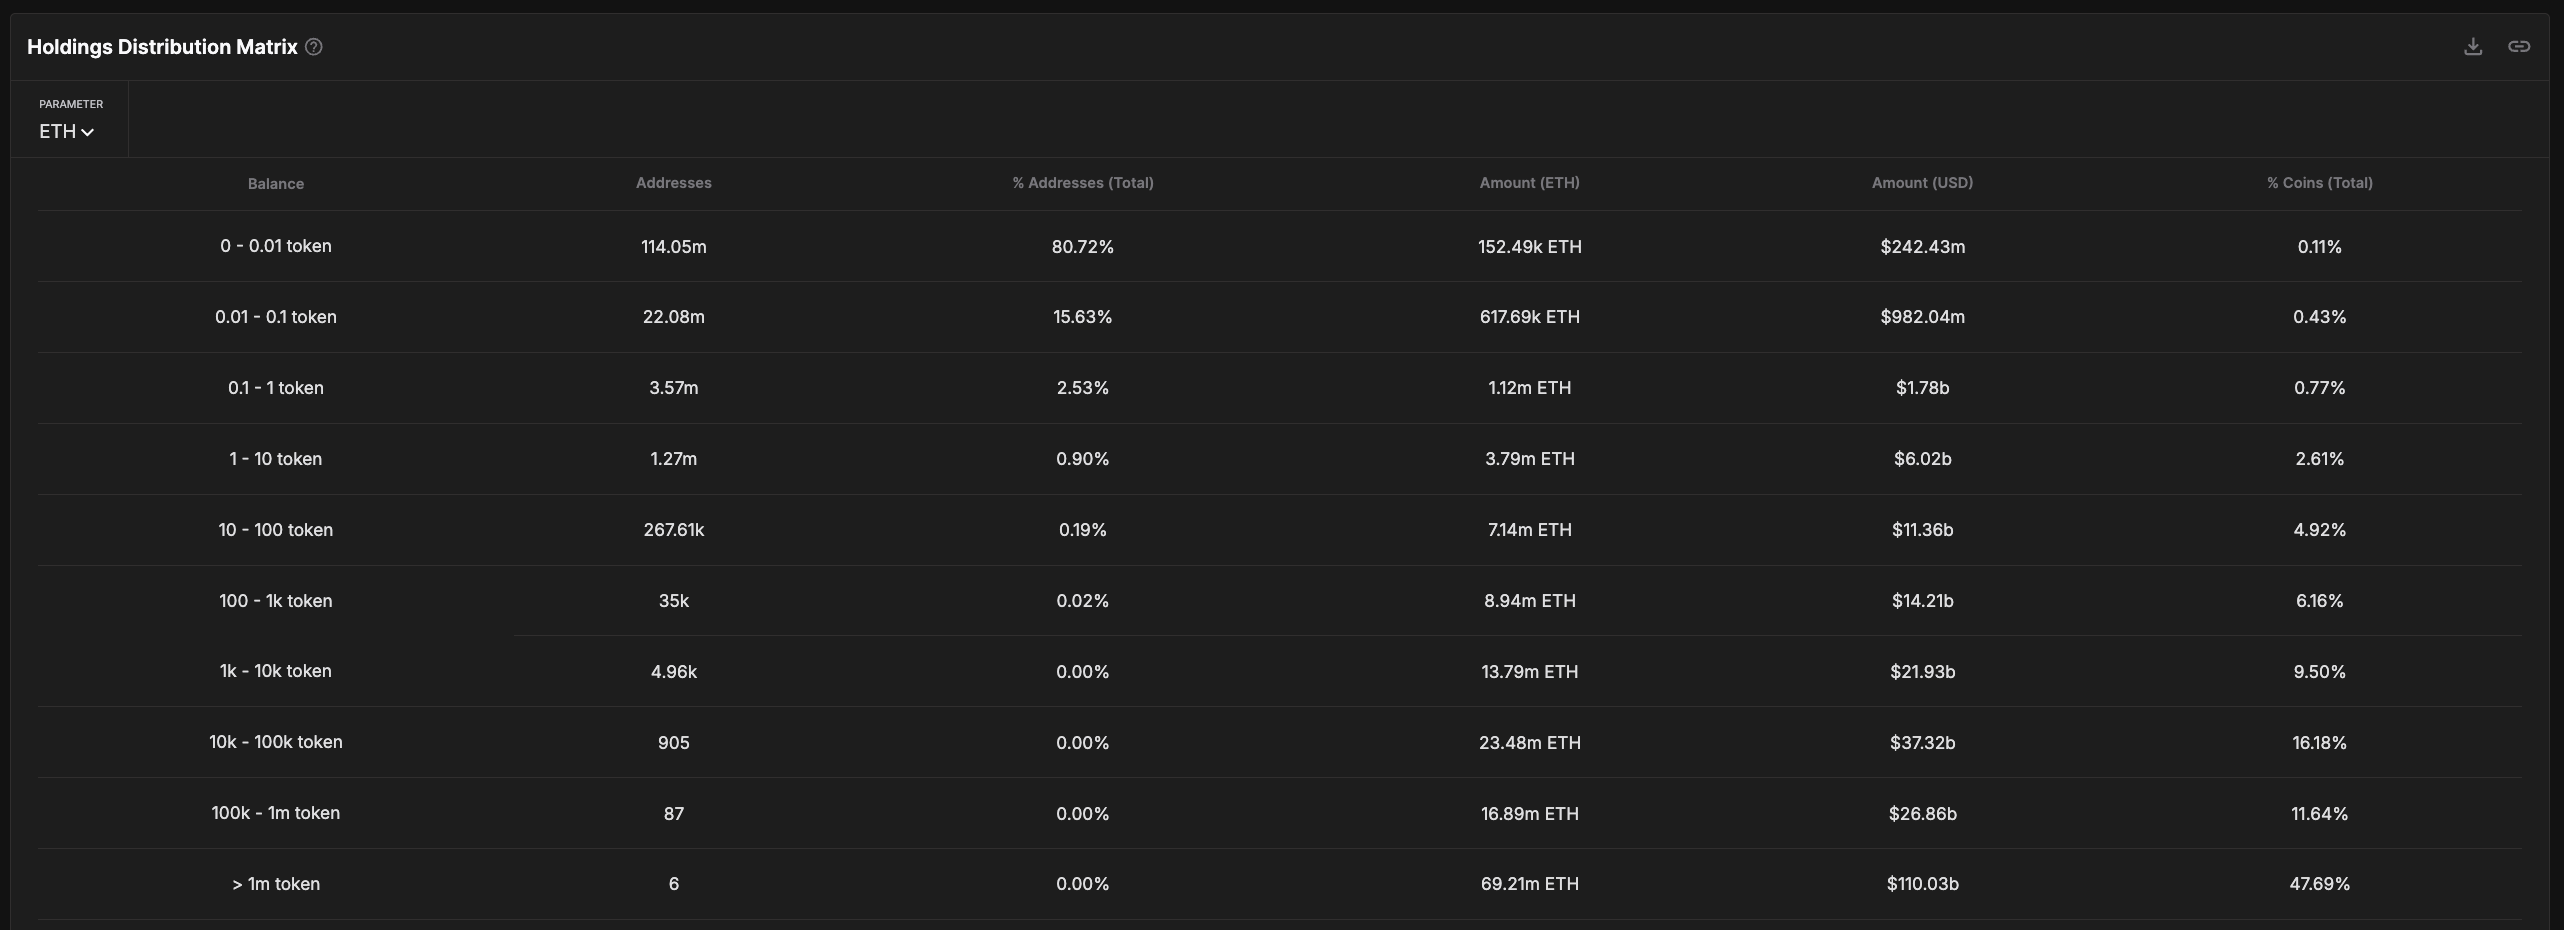
Analyzing the ETH Holdings Distribution Matrix reveals concerning signs of deepening concentration.
When excluding addresses with over 100,000 ETH—typically linked to centralized exchanges—whale addresses holding between 1,000 and 100,000 ETH now control roughly $59 billion in ETH, representing around 25.5% of the circulating supply.
This group has steadily accumulated more of the network’s supply, reinforcing a power shift toward large entities operating outside of exchanges but still commanding immense influence over the market. Recently, Galaxy Digital moved $100 million in Ethereum, raising questions about whether it was a strategic shift or a sell-off signal.
While some might interpret this trend as strategic positioning by confident holders, it also exposes Ethereum to significant downside risk.
With over a quarter of supply concentrated in the hands of these whales, any coordinated or panic-driven selling could trigger sharp price drops, especially in an environment with weakening retail participation.
Rather than a sign of long-term stability, this level of concentration may make the ETH market increasingly fragile and prone to volatility if these holders start to rotate their capital to other assets.
Bearish EMA Structure Keeps ETH Under Pressure
Ethereum’s EMA lines continue to flash bearish signals, with short-term averages still positioned below the long-term ones—indicating downward momentum remains in play.
If a new correction happens, Ethereum could first test support at $1,535. A breakdown below that level opens the door to deeper declines toward $1,412 or even $1,385.
Should these supports also fail to hold, Ethereum would edge dangerously close to the $1,000 mark, a level some analysts have flagged as a potential downside target in the event of an extended market correction.
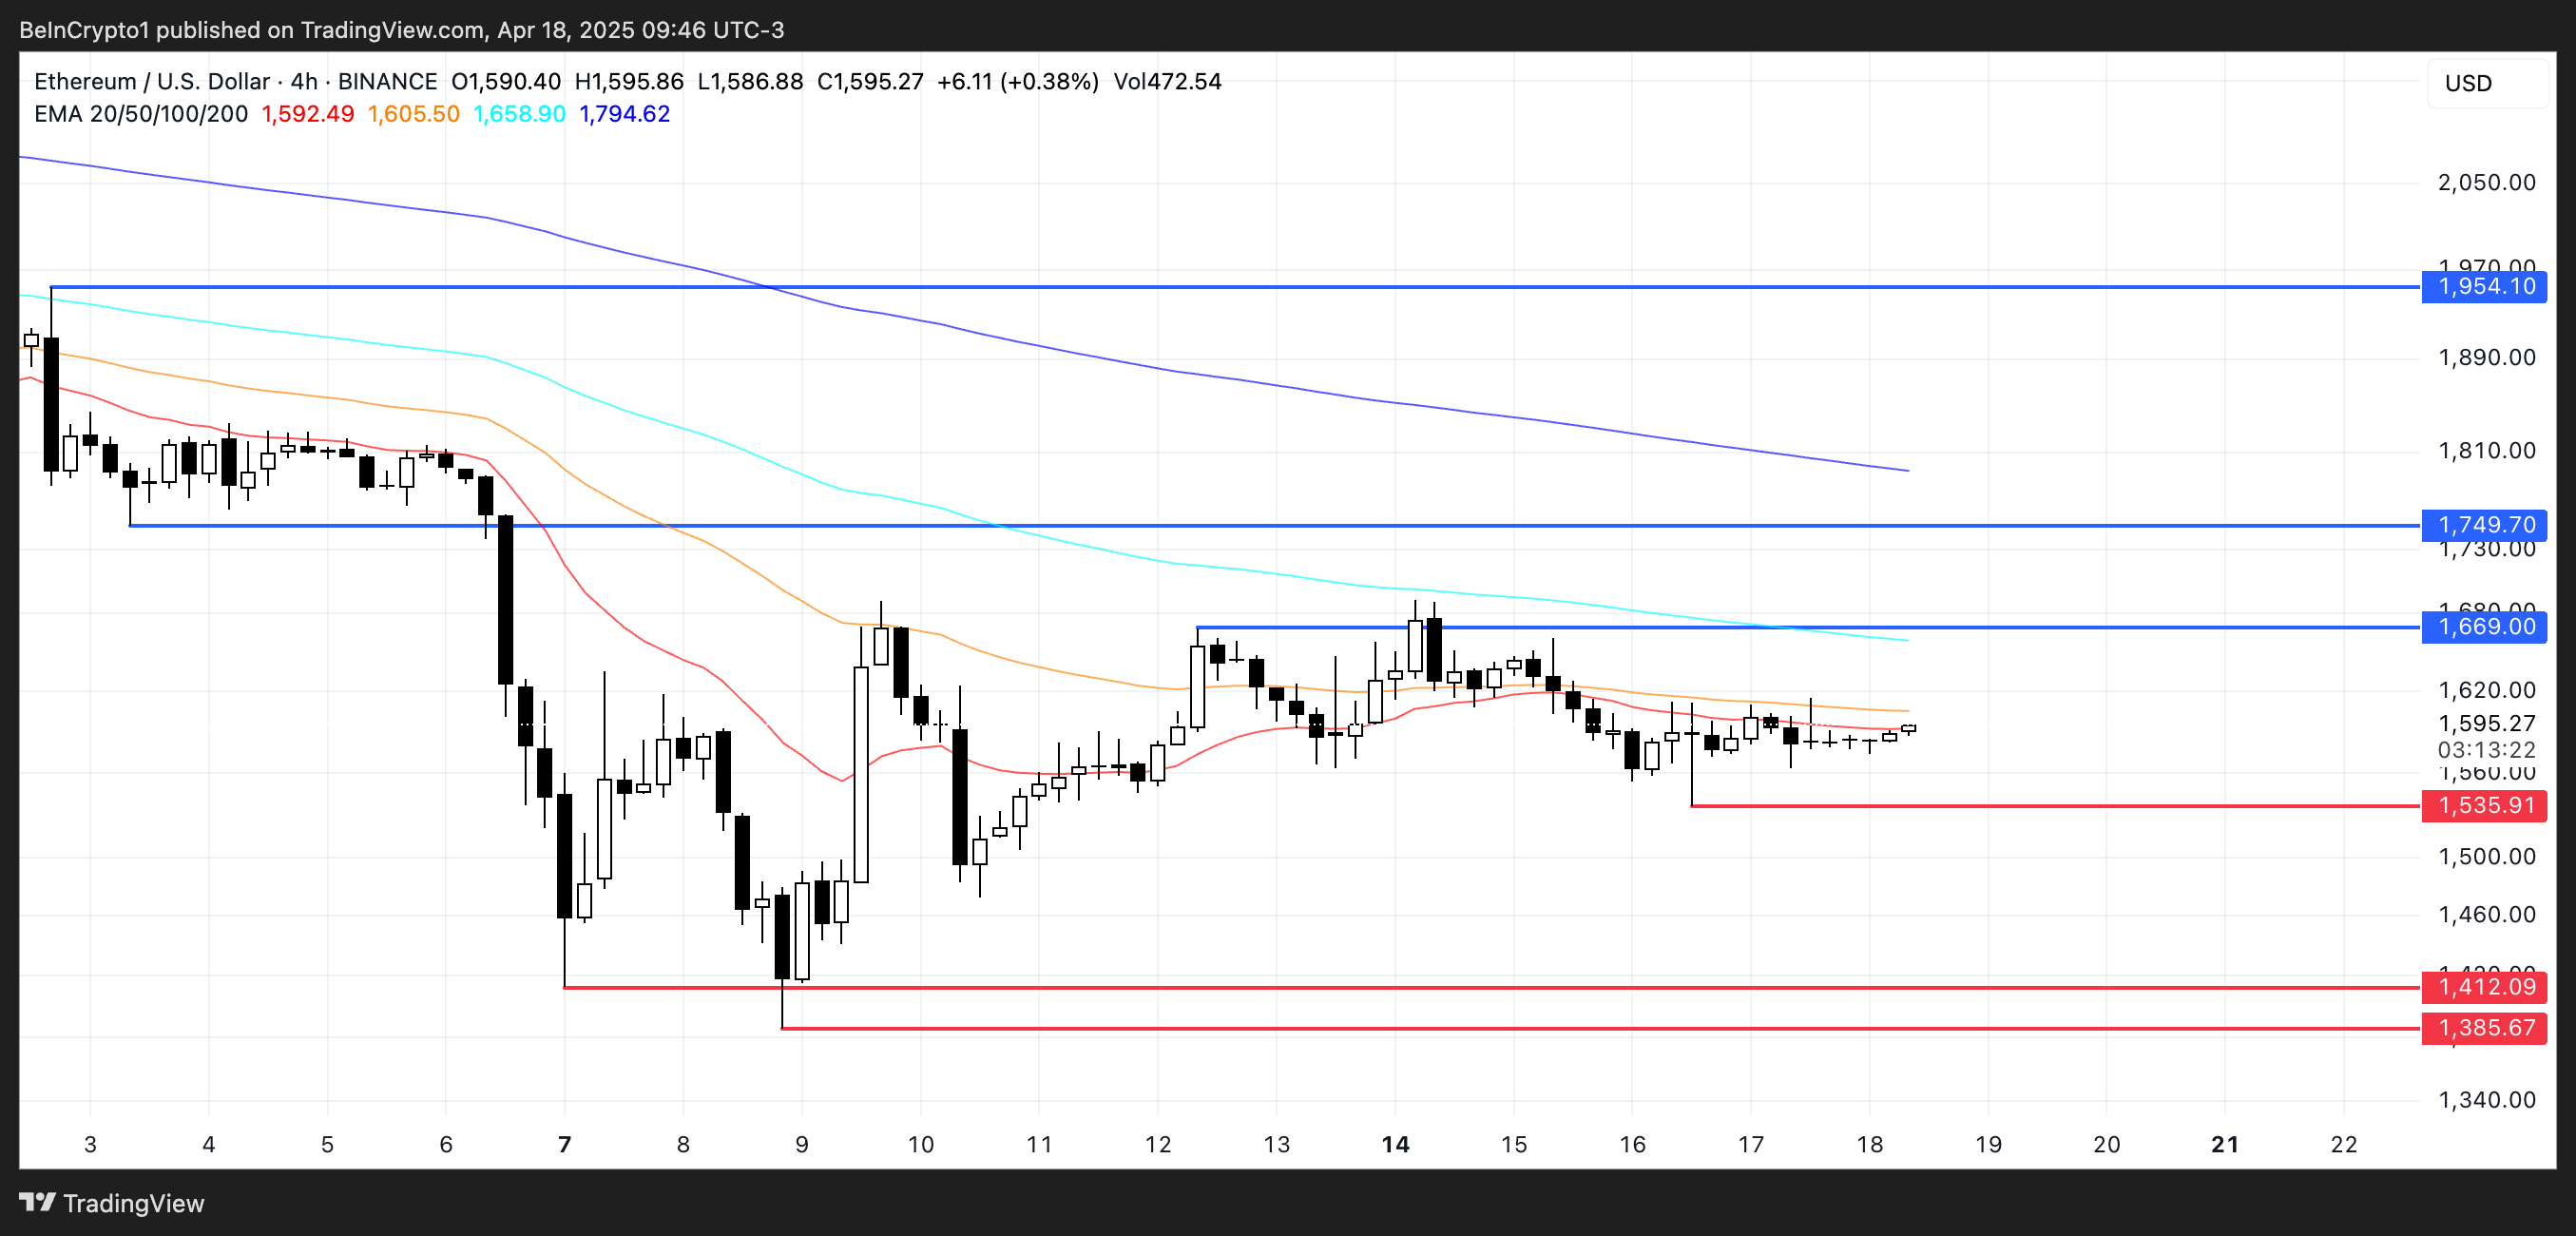
Still, a bullish reversal is not entirely out of the question. If buying pressure returns and Ethereum reclaims short-term momentum, it could test the resistance level at $1,669.
A breakout above that would be a significant technical signal, potentially pushing Ethereum price toward $1,749 and even $1,954.
However, with EMAs still tilted to the downside, the burden remains on bulls to prove that momentum has shifted decisively in their favor.
Disclaimer
In line with the Trust Project guidelines, this price analysis article is for informational purposes only and should not be considered financial or investment advice. BeInCrypto is committed to accurate, unbiased reporting, but market conditions are subject to change without notice. Always conduct your own research and consult with a professional before making any financial decisions. Please note that our Terms and Conditions, Privacy Policy, and Disclaimers have been updated.

On Friday, Changpeng Zhao (CZ) sparked fresh momentum toward simplifying the BNB staking ecosystem.
The Binance founder proposed the unification of multiple liquid staking tokens into a single, streamlined structure.
CZ’s Bold Plan to Unify BNB’s Staking Maze
Changpeng Zhao’s comments come amid rising concerns over the fragmentation of BNB staking products. Their impact on user adoption and capital efficiency within the decentralized finance (DeFi) space has also been questioned.
“There are so many different versions of BNB rewards. asBNB, slisBNB, clisBNB… combine them?” CZ wrote on X (Twitter).
These tokens, each tied to a different platform or crypto staking strategy, represent staked BNB assets while allowing users to remain liquid.
However, the proliferation of variant tokens like asBNB, slisBNB, and clisBNB has created operational barriers for users, particularly newcomers. Each derivative often carries reward structures, lock-up conditions, and platform-specific limitations, making it harder to maneuver the ecosystem.
This highlights the growing problem in BNB’s liquid staking ecosystem. However, as more derivatives emerge, confusion has mounted. The call for consolidation follows recent activity in the BNB DeFi ecosystem. This week, Aster DEX (decentralized exchange) announced “back-to-back rewards” for asBNB holders.
While this added to the mix of incentives, it also highlighted the complexity of managing multiple tokens.
“INIT rewards are loading now and will be available for holders with previous rewards soon,” Aster posted.
The post demonstrates how derivative-specific reward systems may confuse users who are unfamiliar with each staking product’s nuances.
CZ shared a follow-up post, urging users to support projects in the ecosystem. The call to action reflects his commitment to nurturing BNB’s DeFi growth, albeit with a more coherent strategy.
As Binance aims to maintain its leadership in Web3 usability, Zhao’s suggestion to unify these staking derivatives could be a pivotal move to streamline BNB’s functionality across DeFi platforms.
BNB remains one of the most utilized assets in the DeFi ecosystem. The network underpins a wide array of liquidity pools, staking protocols, and yield-generating strategies.
CZ’s unification proposal aligns with a broader trend across DeFi to improve composability and standardization. Industry leaders increasingly recognize that overly complex or siloed token designs can deter participation and limit interoperability.
A standardized BNB staking token could help reduce fragmentation and boost liquidity. It could also encourage deeper integration across platforms using BNB Chain infrastructure.
While Binance has not yet issued an official roadmap for staking token consolidation, CZ’s comments may hint at a coming initiative to build a unified liquid staking standard.
Such a move could further solidify BNB’s position as a core DeFi asset, simplify staking for everyday users, and drive broader adoption of Binance’s on-chain ecosystem.
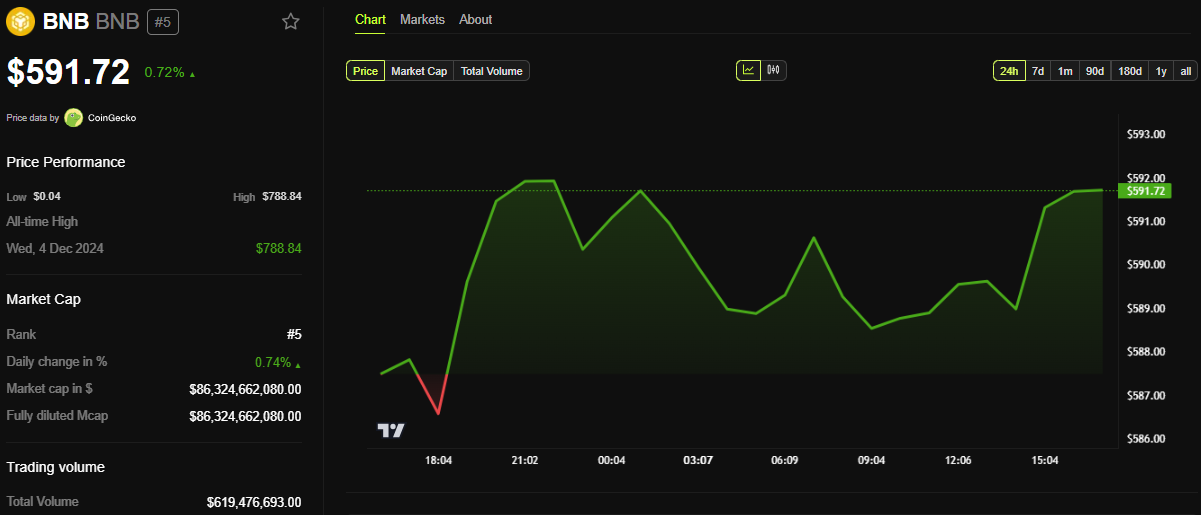
BeInCrypto data shows BNB was trading for $591.72 as of this writing, up by a modest 0.72% in the last 24 hours.
Disclaimer
In adherence to the Trust Project guidelines, BeInCrypto is committed to unbiased, transparent reporting. This news article aims to provide accurate, timely information. However, readers are advised to verify facts independently and consult with a professional before making any decisions based on this content. Please note that our Terms and Conditions, Privacy Policy, and Disclaimers have been updated.

What Does This Mean for Altcoins?
How $31 Trillion in US Bonds Could Impact Crypto Markets in 2025

Ethereum Price Stalls In Tight Range – Big Price Move Incoming?

Are Ethereum Whales Threatening ETH Price Stability?

Ethereum ETFs Record $32M Weekly Outflow; ETH Price Crash To $1.1K Imminent?

CZ’s Plan to Streamline BNB Staking Could Boost DeFi

2.52 Million Altcoins Are Ruining Crypto’s Future

Animoca Brands Valuation Tanks 75% In Two Years, Here’s Why

Crypto exchange BingX hacked for $43 million

Are The Big Players Losing Interest?

Hong Kong’s Securities Association Tips Authorities On Crypto Self-Regulation

Coinbase cbBTC Set to go Live on Solana
2.52 Million Altcoins Are Ruining Crypto’s Future
Animoca Brands Valuation Tanks 75% In Two Years, Here’s Why
Crypto exchange BingX hacked for $43 million
Are The Big Players Losing Interest?
Hong Kong’s Securities Association Tips Authorities On Crypto Self-Regulation
Coinbase cbBTC Set to go Live on Solana
-

 Market23 hours ago
Over $700 Million In XRP Moved In April, What Are Crypto Whales Up To?
-

 Altcoin23 hours ago
CZ Honors Nearly $1 Billion Token Burn Promise
-
 Market22 hours ago
Crypto Casino Founder Charged With Fraud in New York
-

 Ethereum21 hours ago
Ethereum Whales Offload 143,000 ETH In One Week – More Selling Ahead?
-

 Market13 hours ago
Ethereum Price Fights for Momentum—Traders Watch Key Resistance
-

 Market19 hours ago
Crypto Ignores ECB Rate Cuts, Highlighting EU’s Fading Influence
-
 Altcoin13 hours ago
Expert Predicts Pi Network Price Volatility After Shady Activity On Banxa
-

 Market18 hours ago
Binance Leads One-Third of the CEX Market in Q1 2025