Market
Ethereum (ETH) Breaks Support, Eyeing $3,500 as Key Level

The behavior of Ethereum (ETH) holders provides crucial insights into market sentiment and potential future price movements.
This analysis delves into the recent trends among Ethereum addresses holding 1,000 ETH or more, alongside the actions of the largest whales holding 10,000 ETH or more.
Ethereum Price Analysis: Bearish Momentum as Key Supports Break
The price of Ethereum (ETH) continues to fall, influenced by recent market dynamics and a notable Bitcoin price prediction from BeInCrypto, which saw Bitcoin reaching $67,500.
After hitting the 100 EMA on the 4-hour chart as a mid-term resistance level, ETH dropped to a low of $3,500.
ETH broke through the EMA 200 on the 4-hour chart. The crucial support level was $3,577, which was marked by a significant baseline plateau, as shown by the black lines on the chart.
Read More: Who Is Vitalik Buterin? An In-Depth Look at Ethereum’s Co-Founder

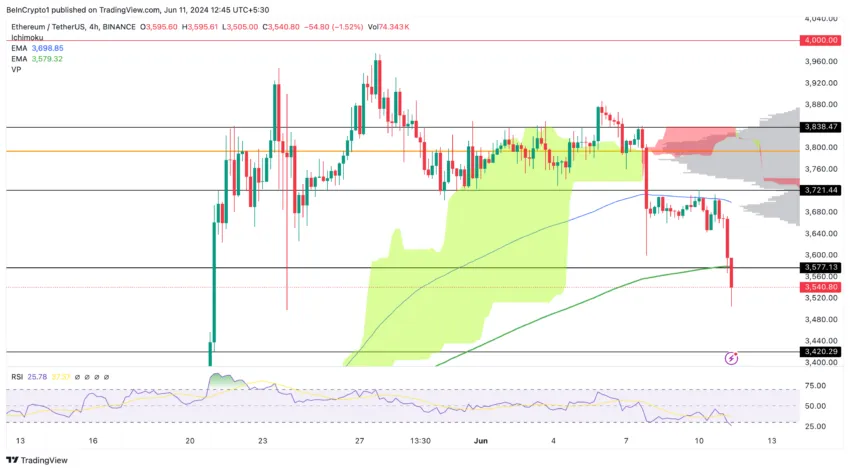
Additionally, ETH has moved out of the important volume profile range between $3,640 and $3,880. Suggesting potential for high volatility and further declines.
The chart outlook is currently bearish, with the only possible bullish scenario being a move back above the EMA 200 and finding support at that level.
Read More: Ethereum (ETH) Set for Growth: Key Technical Indicators and On-Chain Insights
Ethereum: Large Holder Activity and Market Sentiment
The chart from Glassnode illustrates the number of Ethereum addresses holding a balance of 10,000 ETH or more (blue line).
This indicator is crucial for understanding the behavior of large holders, often referred to as “whales,” who can significantly influence ETH market dynamics.

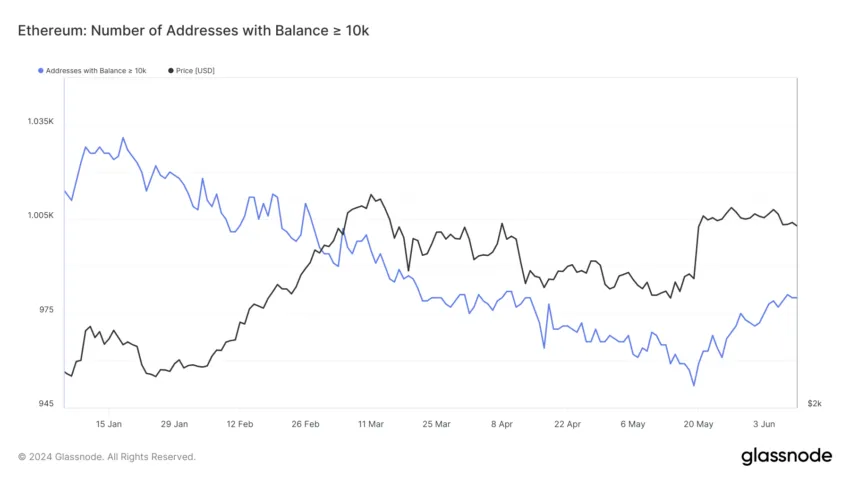
From January to June, we observe a declining trend in the number of addresses with balances exceeding 10,000 ETH. This suggests that some large holders might distribute their holdings, potentially signaling a bearish sentiment or profit-taking.
Analysis of Ethereum Addresses with 10,000+ ETH (May 1 – June 10)
The mean number of addresses during this period was approximately 967.73, with a standard deviation of 7.17, indicating moderate variability. The minimum number of addresses recorded was 952 (on May 19), and the maximum was 981 (on June 8).
The increase in the number of large holder addresses during the price correction to $3,500 suggests that these holders have strong conviction, as they maintain balances of over 10,000 ETH in their wallets at actual prices.
Ethereum: Mid-Level Holder Activity and Market Sentiment
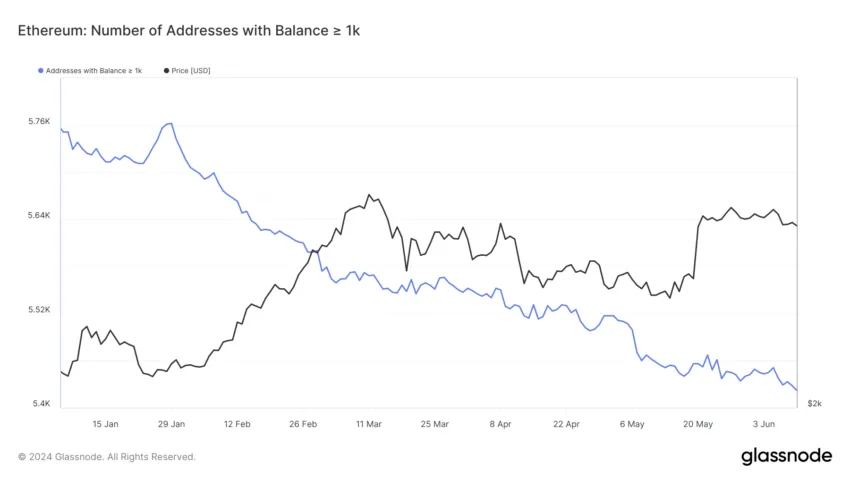
The chart from Glassnode illustrates the number of Ethereum addresses holding a balance of 1,000 ETH. This indicator provides insights into the behavior of mid-level holders.
Analysis of Ethereum Addresses With 1,000+ ETH (May 1 – June 10)
The mean number of addresses during this period was approximately 5,456.78.
With a standard deviation of 24.85, indicating moderate variability. The minimum number of addresses recorded was 5,422 (on June 10), and the maximum was 5,517 (on May 1 and May 2).
The number of large Ethereum addresses clearly dropped, hitting a low point on June 10. This trend might suggest that mid-level holders were taking profits or feeling less confident in the market.
There was a clear drop in the number of large Ethereum addresses, hitting a low point on June 10.
This trend might suggest that mid-level holders were taking profits or feeling less confident in the market. This low level was last observed in September 2016.
Strategic Recommendations:
Key Bearish Indicators
Break of EMA 200 on the 4H Chart: ETH has broken below the EMA 200 on the 4-hour chart, a significant dynamic support line. This suggests a potential for further downside.
Decline in Mid-Level Addresses: The number of ETH addresses holding balances of 1,000 or more has steadily decreased, hitting a low point last seen in September 2016. This indicates that mid-level holders are likely taking profits and showing reduced market confidence.
Read More: Ethereum (ETH) Price Prediction 2024/2025/2030
Exit from Key Volume Profile Range: ETH has exited the important volume profile range between $3,640 and $3,880. This exit could lead to increased volatility and further declines.
Key Support Levels to Watch
$3,577: Recently broken, this level was an important baseline plateau and indicates a bearish outlook.
$3,500: A psychological support level where ETH found some stability.
$3,420: Another critical support level to monitor for potential bearish continuation.
As noted in a previous analysis by BeInCrypto, set buy orders near key support levels at $3,575 and $3,400. Consider taking profits at resistance levels around $4,134 and $4,390, or opt to HODL.
Disclaimer
In line with the Trust Project guidelines, this price analysis article is for informational purposes only and should not be considered financial or investment advice. BeInCrypto is committed to accurate, unbiased reporting, but market conditions are subject to change without notice. Always conduct your own research and consult with a professional before making any financial decisions. Please note that our Terms and Conditions, Privacy Policy, and Disclaimers have been updated.