Market
Ethereum (ETH) Breaks Support, Eyeing $3,500 as Key Level
The behavior of Ethereum (ETH) holders provides crucial insights into market sentiment and potential future price movements.
This analysis delves into the recent trends among Ethereum addresses holding 1,000 ETH or more, alongside the actions of the largest whales holding 10,000 ETH or more.
Ethereum Price Analysis: Bearish Momentum as Key Supports Break
The price of Ethereum (ETH) continues to fall, influenced by recent market dynamics and a notable Bitcoin price prediction from BeInCrypto, which saw Bitcoin reaching $67,500.
After hitting the 100 EMA on the 4-hour chart as a mid-term resistance level, ETH dropped to a low of $3,500.
ETH broke through the EMA 200 on the 4-hour chart. The crucial support level was $3,577, which was marked by a significant baseline plateau, as shown by the black lines on the chart.
Read More: Who Is Vitalik Buterin? An In-Depth Look at Ethereum’s Co-Founder
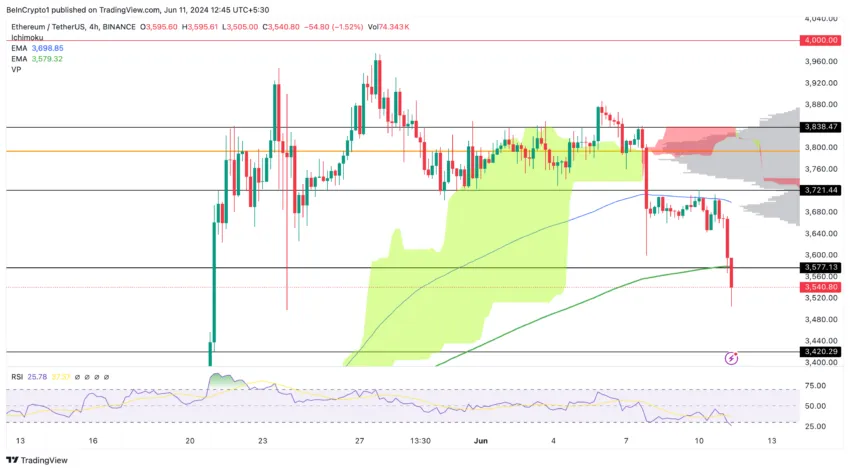
Additionally, ETH has moved out of the important volume profile range between $3,640 and $3,880. Suggesting potential for high volatility and further declines.
The chart outlook is currently bearish, with the only possible bullish scenario being a move back above the EMA 200 and finding support at that level.
Read More: Ethereum (ETH) Set for Growth: Key Technical Indicators and On-Chain Insights
Ethereum: Large Holder Activity and Market Sentiment
The chart from Glassnode illustrates the number of Ethereum addresses holding a balance of 10,000 ETH or more (blue line).
This indicator is crucial for understanding the behavior of large holders, often referred to as “whales,” who can significantly influence ETH market dynamics.
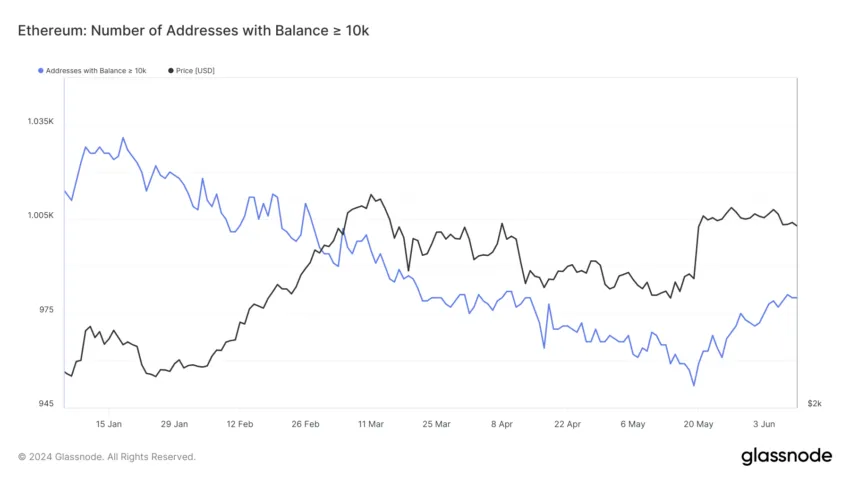
From January to June, we observe a declining trend in the number of addresses with balances exceeding 10,000 ETH. This suggests that some large holders might distribute their holdings, potentially signaling a bearish sentiment or profit-taking.
Analysis of Ethereum Addresses with 10,000+ ETH (May 1 – June 10)
The mean number of addresses during this period was approximately 967.73, with a standard deviation of 7.17, indicating moderate variability. The minimum number of addresses recorded was 952 (on May 19), and the maximum was 981 (on June 8).
The increase in the number of large holder addresses during the price correction to $3,500 suggests that these holders have strong conviction, as they maintain balances of over 10,000 ETH in their wallets at actual prices.
Ethereum: Mid-Level Holder Activity and Market Sentiment
The chart from Glassnode illustrates the number of Ethereum addresses holding a balance of 1,000 ETH. This indicator provides insights into the behavior of mid-level holders.
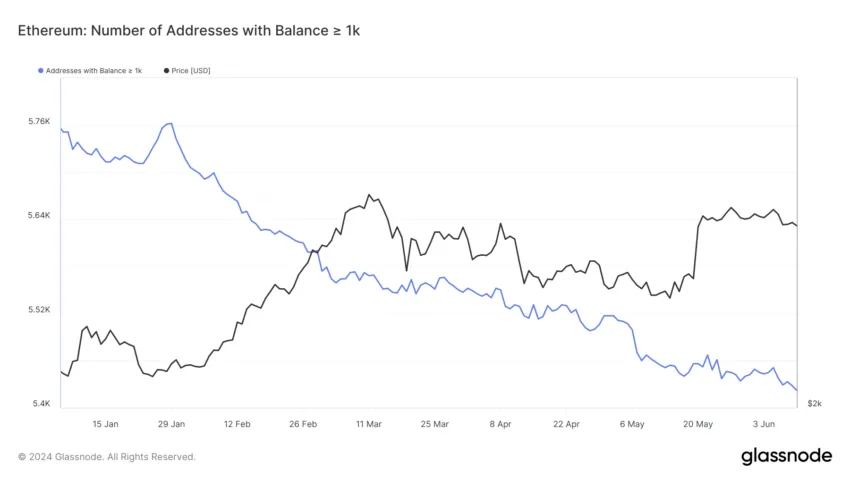
Analysis of Ethereum Addresses With 1,000+ ETH (May 1 – June 10)
The mean number of addresses during this period was approximately 5,456.78.
With a standard deviation of 24.85, indicating moderate variability. The minimum number of addresses recorded was 5,422 (on June 10), and the maximum was 5,517 (on May 1 and May 2).
The number of large Ethereum addresses clearly dropped, hitting a low point on June 10. This trend might suggest that mid-level holders were taking profits or feeling less confident in the market.
There was a clear drop in the number of large Ethereum addresses, hitting a low point on June 10.
This trend might suggest that mid-level holders were taking profits or feeling less confident in the market. This low level was last observed in September 2016.
Strategic Recommendations:
Key Bearish Indicators
Break of EMA 200 on the 4H Chart: ETH has broken below the EMA 200 on the 4-hour chart, a significant dynamic support line. This suggests a potential for further downside.
Decline in Mid-Level Addresses: The number of ETH addresses holding balances of 1,000 or more has steadily decreased, hitting a low point last seen in September 2016. This indicates that mid-level holders are likely taking profits and showing reduced market confidence.
Read More: Ethereum (ETH) Price Prediction 2024/2025/2030
Exit from Key Volume Profile Range: ETH has exited the important volume profile range between $3,640 and $3,880. This exit could lead to increased volatility and further declines.
Key Support Levels to Watch
$3,577: Recently broken, this level was an important baseline plateau and indicates a bearish outlook.
$3,500: A psychological support level where ETH found some stability.
$3,420: Another critical support level to monitor for potential bearish continuation.
As noted in a previous analysis by BeInCrypto, set buy orders near key support levels at $3,575 and $3,400. Consider taking profits at resistance levels around $4,134 and $4,390, or opt to HODL.
Disclaimer
In line with the Trust Project guidelines, this price analysis article is for informational purposes only and should not be considered financial or investment advice. BeInCrypto is committed to accurate, unbiased reporting, but market conditions are subject to change without notice. Always conduct your own research and consult with a professional before making any financial decisions. Please note that our Terms and Conditions, Privacy Policy, and Disclaimers have been updated.
Market
Will Bittensor Surpass Bitcoin as a Store of Value? Expert Predicts
Barry Silbert, CEO of Digital Currency Group, has stated that Bittensor (TAO) has the potential to outperform Bitcoin (BTC) as a global store of value.
His comments come amid notable growth in the Bittensor network, with its subnet ecosystem market capitalization and the TAO token’s price on the rise.
Will Bittensor’s Decentralized AI Model Outperform Bitcoin’s Legacy?
In a recent interview with Raoul Pal, Silbert highlighted the growing influence of artificial intelligence (AI) in the crypto sector. According to him, Bittensor is at the forefront of this revolution, representing the “next big era for crypto.”
“You had the Bitcoin and the Ethereum and the NFTs, and you had the layer 2s and DeFi. I think this is the next big investment theme for crypto,” Silbert stated.
He went on to explain that Bittensor shares the same pioneering spirit as early Bitcoin. Still, its purpose extends beyond financial sovereignty.
“The boldest prediction that I could make for Bittensor is it could be a better version of Bitcoin as a global store of value,” he claimed.
He argued that instead of the $10 to $12 billion spent annually to secure the Bitcoin network, that same amount could be redirected toward incentivizing a global network of individuals working to solve major world problems. He envisions this money fostering innovation on a massive scale, with the potential to grow into a multi-billion-dollar ecosystem.
While acknowledging the value of securing the Bitcoin network, Silbert emphasized that Bittensor’s potential lies in its ability to harness this vast financial backing to address real-world challenges.
He noted that Bittensor operates on a similar economic model to Bitcoin, with halving mechanisms and decentralization, positioning it as a powerful contender in the quest for a more impactful and value-driven global network.
Silbert also noted that while plenty of decentralized AI projects have emerged, Bittensor has set itself apart. He referred to it as having reached “escape velocity.” This term is used to convey a project’s rapid growth and increasing market influence.
“99.9% of crypto tokens that are out there have no reason to exist and are worthless,” he added.
Market data reflects the growing enthusiasm for Bittensor. Notably, amid the ongoing volatility, TAO has fared well in comparison to the broader market, rising 32.1% in the last week. At press time, the altcoin was trading at $328, up 7.2% over the past day.

Additionally, TAO is currently the top trending cryptocurrency on CoinGecko, underlining its rising popularity among investors. Google Trends data further proves the growing interest in Bittensor. The search volume peaked at 100 at the time of writing.
Meanwhile, the Bittensor ecosystem is also seeing notable progress. The latest data indicated that the market capitalization of Bittensor’s subnet tokens more than doubled in April 2025.

It increased by 166%, rising from $181 million at the beginning of April to $481 million at press time. As reported by BeInCrypto, this growth follows a tripling of active subnets over the past year.
Disclaimer
In adherence to the Trust Project guidelines, BeInCrypto is committed to unbiased, transparent reporting. This news article aims to provide accurate, timely information. However, readers are advised to verify facts independently and consult with a professional before making any decisions based on this content. Please note that our Terms and Conditions, Privacy Policy, and Disclaimers have been updated.
Market
XRP Bulls Defend $2.00—Is a Fresh Price Surge Loading?

Aayush Jindal, a luminary in the world of financial markets, whose expertise spans over 15 illustrious years in the realms of Forex and cryptocurrency trading. Renowned for his unparalleled proficiency in providing technical analysis, Aayush is a trusted advisor and senior market expert to investors worldwide, guiding them through the intricate landscapes of modern finance with his keen insights and astute chart analysis.
From a young age, Aayush exhibited a natural aptitude for deciphering complex systems and unraveling patterns. Fueled by an insatiable curiosity for understanding market dynamics, he embarked on a journey that would lead him to become one of the foremost authorities in the fields of Forex and crypto trading. With a meticulous eye for detail and an unwavering commitment to excellence, Aayush honed his craft over the years, mastering the art of technical analysis and chart interpretation.
As a software engineer, Aayush harnesses the power of technology to optimize trading strategies and develop innovative solutions for navigating the volatile waters of financial markets. His background in software engineering has equipped him with a unique skill set, enabling him to leverage cutting-edge tools and algorithms to gain a competitive edge in an ever-evolving landscape.
In addition to his roles in finance and technology, Aayush serves as the director of a prestigious IT company, where he spearheads initiatives aimed at driving digital innovation and transformation. Under his visionary leadership, the company has flourished, cementing its position as a leader in the tech industry and paving the way for groundbreaking advancements in software development and IT solutions.
Despite his demanding professional commitments, Aayush is a firm believer in the importance of work-life balance. An avid traveler and adventurer, he finds solace in exploring new destinations, immersing himself in different cultures, and forging lasting memories along the way. Whether he’s trekking through the Himalayas, diving in the azure waters of the Maldives, or experiencing the vibrant energy of bustling metropolises, Aayush embraces every opportunity to broaden his horizons and create unforgettable experiences.
Aayush’s journey to success is marked by a relentless pursuit of excellence and a steadfast commitment to continuous learning and growth. His academic achievements are a testament to his dedication and passion for excellence, having completed his software engineering with honors and excelling in every department.
At his core, Aayush is driven by a profound passion for analyzing markets and uncovering profitable opportunities amidst volatility. Whether he’s poring over price charts, identifying key support and resistance levels, or providing insightful analysis to his clients and followers, Aayush’s unwavering dedication to his craft sets him apart as a true industry leader and a beacon of inspiration to aspiring traders around the globe.
In a world where uncertainty reigns supreme, Aayush Jindal stands as a guiding light, illuminating the path to financial success with his unparalleled expertise, unwavering integrity, and boundless enthusiasm for the markets.
Market
Vitalik Buterin Proposes to Replace EVM with RISC-V

Ethereum (ETH) co-founder Vitalik Buterin has proposed overhauling the blockchain’s smart contract infrastructure by replacing the Ethereum Virtual Machine (EVM) with RISC-V, a widely adopted open-source instruction set architecture.
This shift aims to address one of Ethereum’s key scaling bottlenecks by dramatically improving the efficiency and simplicity of smart contract execution.
Buterin Proposes Ditching EVM for RISC-V
The proposal was detailed in a post on the Ethereum Magicians forum. In it, Buterin suggested that smart contracts could eventually be compiled to RISC-V rather than EVM bytecode.
According to Buterin, this shift addresses long-term scalability challenges. This particularly includes keeping block production competitive and improving zero-knowledge (ZK) EVM-proof efficiency.
“It aims to greatly improve the efficiency of the Ethereum execution layer, resolving one of the primary scaling bottlenecks, and can also greatly improve the execution layer’s simplicity – in fact, it is perhaps the only way to do so,” he wrote.
Current ZK-EVM implementations spend around half of their proving cycles on EVM execution. By switching to a native RISC-V VM, Ethereum could potentially achieve up to 100x efficiency gains.
Importantly, many fundamental aspects of Ethereum’s architecture would remain unchanged, preserving continuity for developers and users. Core abstractions such as accounts, smart contract storage, ETH balances, and cross-contract calls would function exactly as they do today.
Developers would still write contracts in familiar languages like Solidity or Vyper. These would simply be compiled to RISC-V rather than EVM bytecode. Tooling and workflows would remain largely intact, ensuring a smooth transition.
Crucially, the proposal ensures backward compatibility. Existing EVM contracts will remain fully operational and interoperable with new RISC-V contracts.
Buterin outlines several potential implementation paths forward. The first would support both EVM and RISC-V smart contracts natively. The second suggests wrapping EVM contracts to run via an interpreter written in RISC-V. Thus, it would enable a full transition without breaking compatibility.
The third, more modular approach, builds on the second by formally enshrining interpreters as part of the Ethereum protocol. This would allow the EVM and the future virtual machines to be supported in a standardized way.
Buterin stated that the idea is “equally as ambitious as the beam chain effort.”
“The beam chain effort holds great promise for greatly simplifying the consensus layer of Ethereum. But for the execution layer to see similar gains, this kind of radical change may be the only viable path,” Buterin added.
For context, the Ethereum Beam Chain is a redesign of Ethereum’s consensus layer (Beacon Chain). It focuses on faster block times, faster finality, chain snarkification, and quantum resistance. The development will likely begin in 2026.
This proposal fits into Ethereum’s broader vision of modularity, simplicity, and long-term scalability. Previously, BeInCrypto reported on Buterin’s privacy-centric plans for the blockchain.
The proposal focused on integrating privacy-preserving technologies. Moreover, the Pectra upgrade is also nearing, with the launch expected on May 7.
Meanwhile, ETH continues to face market headwinds, trading at March 2023 lows. This year has been quite hard for the altcoin, as it saw a decline of 50.8%. In fact, Ethereum dominance hit a 5-year low last week.

Nonetheless, BeInCrypto data showed a slight recovery over the last 14 days. ETH rose by 6.1%. Over the past day alone, it saw modest gains of 1.7%. At the time of writing, ETH was trading at $1,639.
Disclaimer
In adherence to the Trust Project guidelines, BeInCrypto is committed to unbiased, transparent reporting. This news article aims to provide accurate, timely information. However, readers are advised to verify facts independently and consult with a professional before making any decisions based on this content. Please note that our Terms and Conditions, Privacy Policy, and Disclaimers have been updated.
-

 Ethereum24 hours ago
Ethereum Consolidates In Symmetrical Triangle: Expert Predicts 17% Price Move
-

 Market17 hours ago
1 Year After Bitcoin Halving: What’s Different This Time?
-

 Market23 hours ago
Today’s $1K XRP Bag May Become Tomorrow’s Jackpot, Crypto Founder Says
-

 Market21 hours ago
MELANIA Crashes to All-Time Low Amid Insiders Continued Sales
-

 Market18 hours ago
VOXEL Climbs 200% After Suspected Bitget Bot Glitch
-

 Market22 hours ago
Charles Schwab Plans Spot Crypto Trading Rollout in 2026
-

 Market16 hours ago
Tokens Big Players Are Buying
-

 Ethereum23 hours ago
Ethereum Enters Historic Buy Zone As Price Dips Below Key Level – Insights


