Market
Ethereum ETF, US CPI, and More

This week, major news has captured the attention of crypto investors and enthusiasts alike. A potential spot Ethereum exchange-traded fund (ETF) approval, the upcoming US CPI data release, and other significant events are set to shape the crypto market.
These developments could have far-reaching implications, prompting market participants to stay vigilant and informed.
Major Crypto Legislation Faces Key Vote in Congress
This week, US lawmakers will vote on H.J. Res. 109, aiming to overturn the controversial SEC Staff Accounting Bulletin 121 (SAB 121). House Majority Leader Steve Scalise’s weekly schedule suggests that the resolution could be considered on Tuesday or Wednesday.
This bulletin requires financial institutions to list their customers’ digital assets on their balance sheets. Critics argue that this rule keeps digital assets outside the US financial system.
Both the House and Senate approved the repeal of SAB 121 in May. Still, President Joe Biden vetoed the bill, emphasizing his administration’s commitment to not supporting “measures that jeopardize the well-being of consumers and investors.” Many industry experts and investors believe this will be a crucial vote for the broader crypto industry.
Spot Ethereum ETF Approval on the Horizon
Market watchers are abuzz with expectations surrounding the potential approval of spot Ethereum (ETH) exchange-traded funds (ETFs). After several asset managers updated their S-1 forms, experts predict these ETFs could launch soon.
Bloomberg Intelligence’s ETF analysts, James Seyffart and Eric Balchunas, suggest that these ETFs “could potentially list later next week or the week of July 15.” Nate Geraci, president of ETF Store, echoes this sentiment.
“Will be shocked if spot ETH ETFs are not trading within the next 2 weeks. Later next week is a possibility, but I think the week of July 15 is more likely,” he noted.
The SEC’s approval process remains critical for these ETFs to commence trading. While the SEC has approved the 19b-4 forms, issuers still need their S-1 forms approved to proceed.
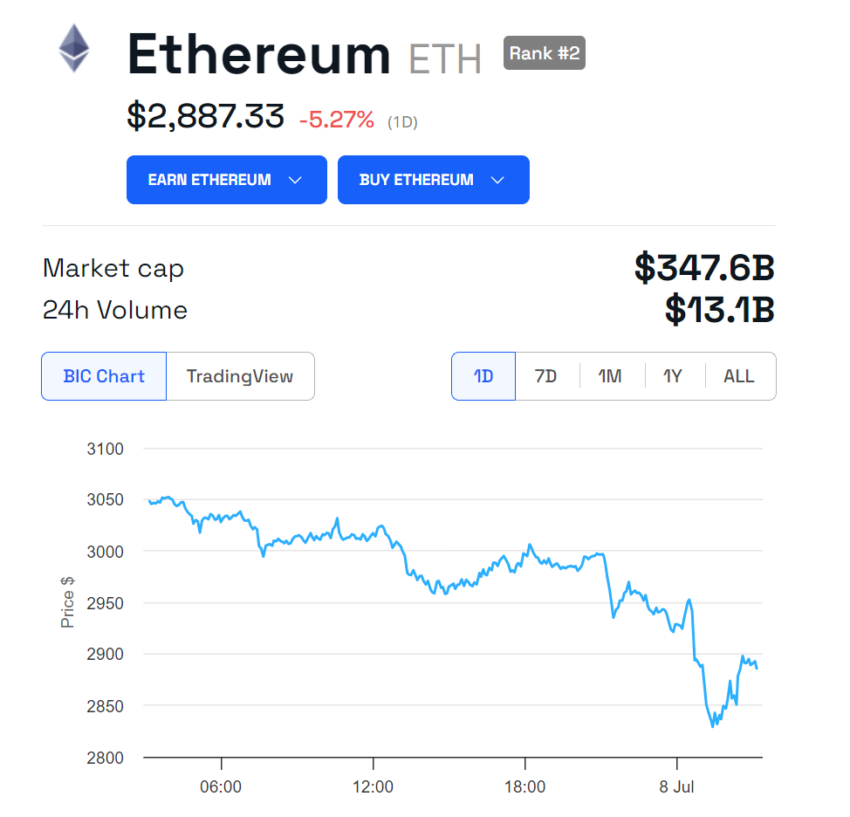
Despite the optimism surrounding the final approval of these ETFs, the price of ETH has decreased significantly since the approval of the 19b-4 forms in late May. According to BeInCrypto data, ETH is now trading at $2,887, marking a roughly 26% decrease since the preliminary approval date.
Read more: Ethereum ETF Explained: What It Is and How It Works
US CPI Data Release and Its Market Implications
Another critical event this week is the US Consumer Price Index (CPI) data, scheduled for release on July 11. The previous CPI data for May showed no month-to-month increase, which offers some respite to inflation concerns.
Projections from the Federal Reserve Bank of Cleveland suggest that the monthly increase in headline CPI inflation for June will be 0.08%, with core CPI inflation, excluding food and energy, at 0.28%. Although these estimates are not always precise, they are generally accurate in indicating where monthly inflation figures might land.
Nonetheless, the Federal Reserve will closely monitor the upcoming figures to gauge inflation trends and make informed policy decisions. This data will be considered at the central bank’s next policy meeting on July 30-31.
Lower inflation figures could indicate economic stability, potentially boosting investor confidence and driving capital into riskier assets like cryptocurrencies. Conversely, if inflation exceeds expectations, the Federal Reserve may opt to hold or raise interest rates, injecting uncertainty into the markets.
Due to their volatile nature, cryptocurrencies could undergo significant price changes in reaction to these economic indicators. Thus, investors should actively monitor CPI data and the Fed’s decisions to navigate the market.
Jupiter’s Supply Reduction Proposal
Jupiter, a Solana-based decentralized exchange (DEX), is set to implement a significant change in its tokenomics with a proposal to reduce the total supply of its native token, JUP, by 30%. This proposal, shared by the pseudonymous co-founder Meow, includes a voluntary team cut of 30% from their allocated tokens and a corresponding reduction in Jupuary emissions. The governance vote on this proposal will occur somewhere in July.
Meow emphasized that these changes are possible because Jupiter does not have direct investors, allowing the team to make bold moves to optimize the platform’s tokenomics. The proposed changes aim to address high emissions levels, streamline the platform’s financial structure, and engage the community more deeply in Jupiter’s long-term vision.
Read more: Top 7 Projects on Solana With Massive Potential
Vela V2 Launch and Upgrades
Vela, an Arbitrum-native perpetual DEX, will launch its Vela V2 on July 8. This version brings upgraded tokenomics, a new trading competition, and enhanced features to the platform.
Vela V2 includes flexible vesting options, governance voting, and a simplified staking page. Additionally, to incentivize participation and reward active users, Vela V2 will introduce a 500,000 ARB prize pool in Grand Prix Season 3.
Xai and Other Major Token Unlocks This Week
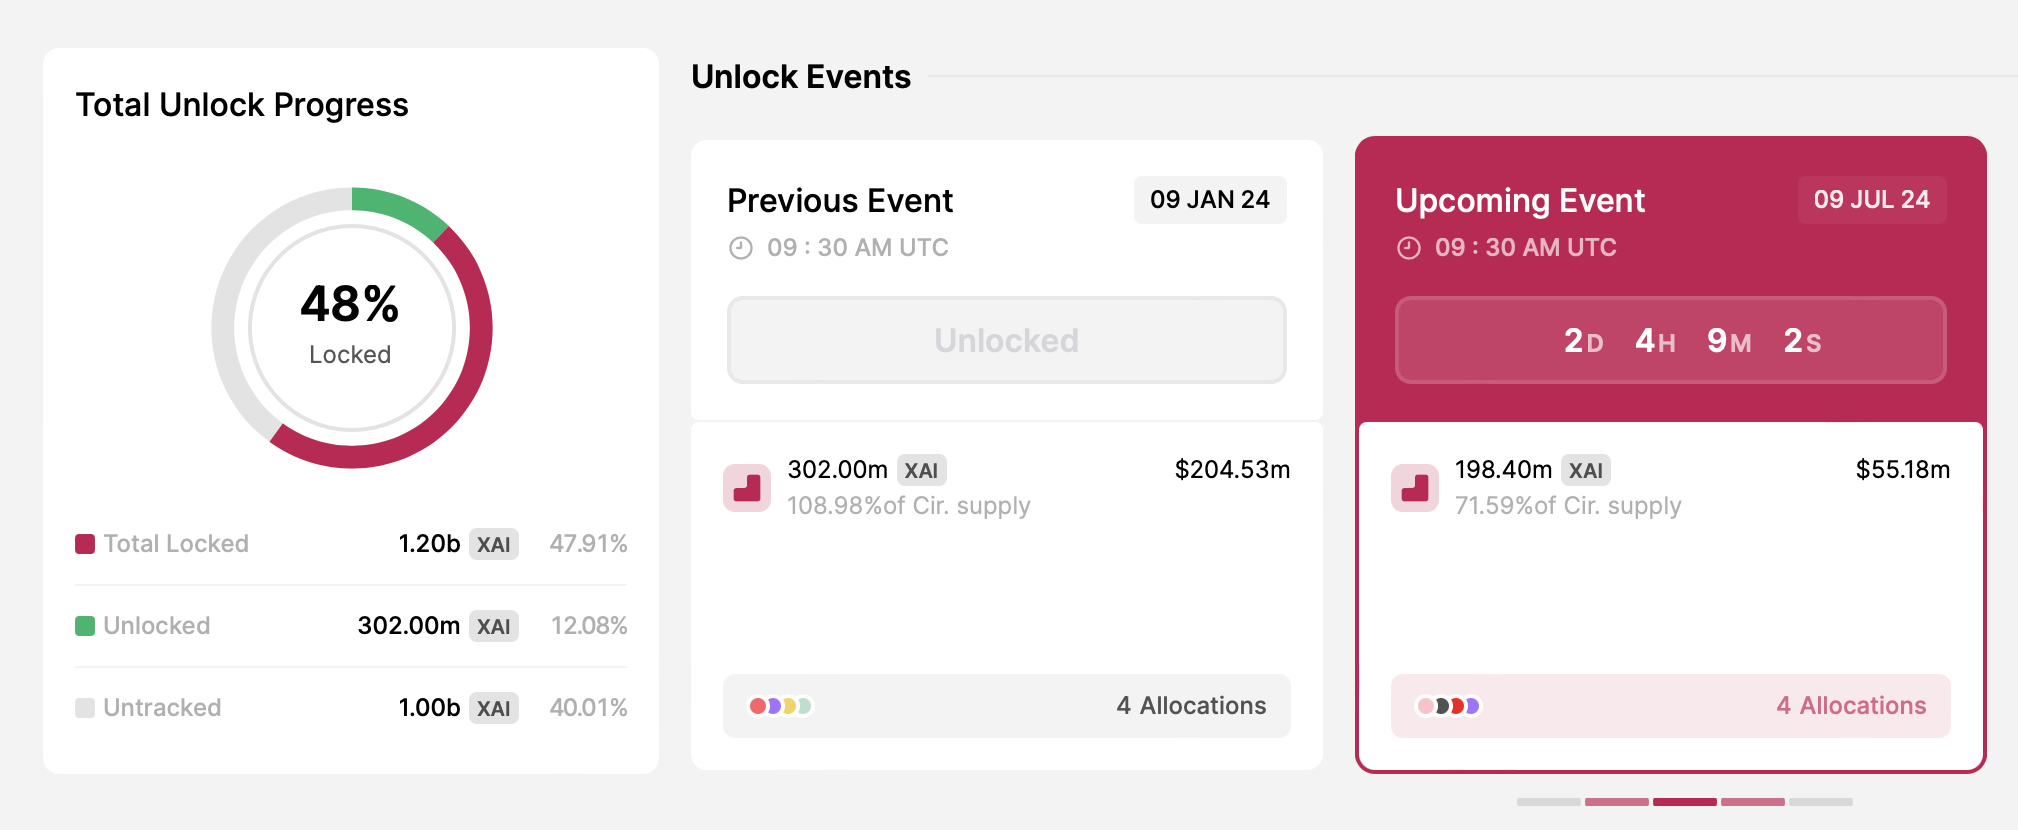
Xai, a layer-3 (L3) solution designed for AAA gaming, will unlock nearly 200 million XAI tokens on July 9. The amount, worth around $55.18 million, accounts for 71.59% of its circulating supply. Therefore, this token unlock has sparked discussions among the crypto community about its potential impact on XAI’s price.
Additionally, Aptos will unlock a significant amount of its native token, APT. TokenUnlocks data shows that the layer-1 (L1) blockchain will distribute 11.3 million APT among community members, core contributors, and investors on July 12. This figure represents 2.49% of its circulating supply, valued at approximately $62.88 million based on the current market price.
Other projects like Immutable (IMX) will also hold token unlocks over the same period. Read this article for further detailed information on major crypto token unlocks this week.
Disclaimer
In adherence to the Trust Project guidelines, BeInCrypto is committed to unbiased, transparent reporting. This news article aims to provide accurate, timely information. However, readers are advised to verify facts independently and consult with a professional before making any decisions based on this content. Please note that our Terms and Conditions, Privacy Policy, and Disclaimers have been updated.
Market
Bitcoin & Ethereum Options Expiry: Can Prices Stay Stable?

The crypto market is set to see $2.58 billion in Bitcoin and Ethereum options expire today, a development that could trigger short-term price volatility and impact traders’ profitability.
Of this total, Bitcoin (BTC) options account for $2.18 billion, while Ethereum (ETH) options represent $396.16 million.
Bitcoin and Ethereum Holders Brace For Volatility
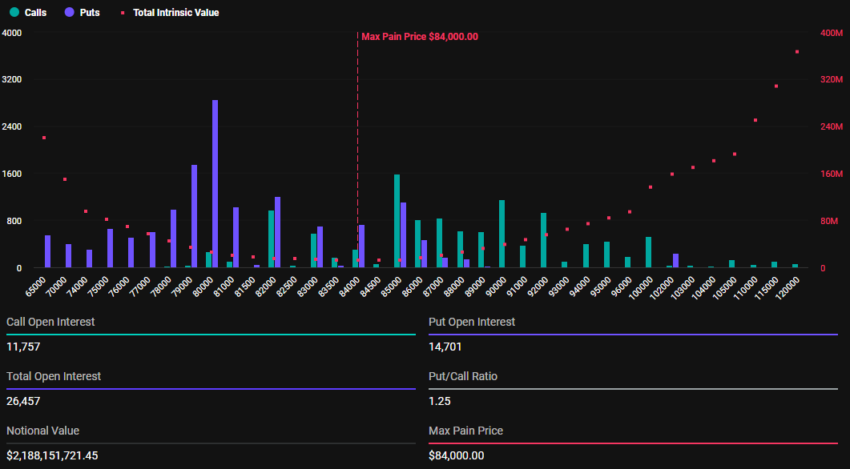
According to data on Deribit, 26,457 Bitcoin options will expire today, significantly lower than the first quarter (Q1) closer, where 139,260 BTC contracts went bust last week. The options contracts due for expiry today have a put-to-call ratio 1.25 and a maximum pain point of $84,000.
The put-to-call ratio indicates a higher volume of puts (sales) relative to calls (purchases), indicating a bearish sentiment. More traders or investors are betting on or protecting against a potential market drop.
On the other hand, 221,303 Ethereum options will also expire today, down from 1,068,519 on the last Friday of March. With a put-to-call ratio of 1.41 and a max pain point of $1,850, the expirations could influence ETH’s short-term price movement.
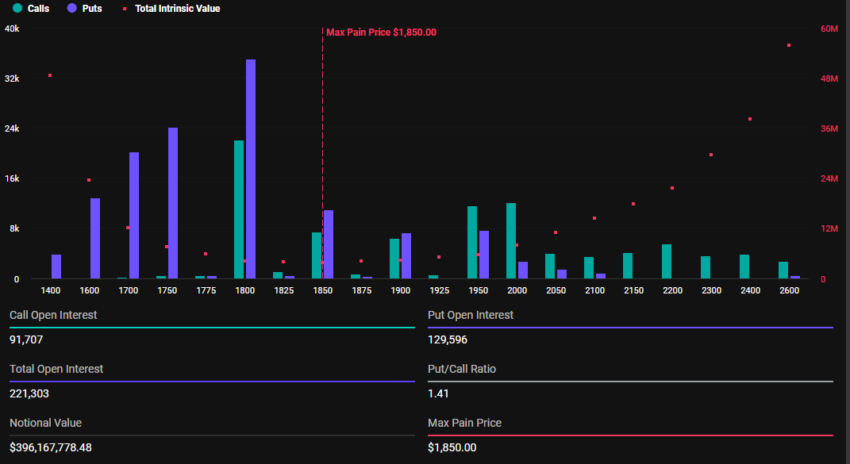
As the options contracts near expiration at 8:00 UTC today, Bitcoin and Ethereum prices are expected to approach their respective maximum pain points. According to BeInCrypto data, BTC was trading at $82,895 as of this writing, whereas ETH was exchanging hands for $1,790.
This suggests that prices might rise as smart money aims to move them toward the “max pain” level. Based on the Max Pain theory, options prices tend to gravitate toward strike prices where the highest number of contracts, both calls and puts, expire worthless.
Nevertheless, price pressure on BTC and ETH will likely ease after 08:00 UTC on Friday when Deribit settles the contracts. However, the sheer scale of these expirations could still fuel heightened volatility in the crypto markets.
“Where do you see the market going next? Deribit posed.
Elsewhere, analysts at Greeks.live explain the current market sentiment, highlighting a bearish outlook. This adds credence to why more traders are betting on or protecting against a potential market drop.
Bearish Sentiment Grips Markets
In a post on X (Twitter), Greeks.live reported a predominantly bearish sentiment in the options market. This follows US President Donald Trump’s tariff announcement.
BeInCrypto reported that the new tariffs constituted a 10% blanket rate and 25% on autos. While this fell short of market expectations, it was still perceived as a negative development, sparking widespread concern among traders.
According to the analysts, options flow reflected this pessimism, with heavy put buying dominating trades.
“Trump’s tariffs are viewed as severe trade disruption… The market’s initial positive reaction with a price spike to $88 was seen as gambling/short covering, followed by a sharp reversal as reality set in about economic impacts. Options flow remains heavily bearish, with traders noting significant put buying, including “700 79k puts for end of April,” wrote Greeks.live analysts.
Traders snapping up 700 $79,000 puts for the end of April signals expectations of a sustained downturn. According to the analysts, the consensus among traders points to continued volatility, with a potential “bad close” below $83,000 today, Friday, April 4. Such an action would erase the earlier pump entirely.
Meanwhile, many traders are adopting bearish strategies, favoring short calls or put calendars. Shorting calls is reportedly deemed the most effective approach in the current climate.
Therefore, while the market’s initial reaction to Trump’s tariffs was a mix of hope and reality, the reversal reflects the broader economic fallout from Trump’s policies. As traders brace for choppy conditions, the bearish outlook in options trading paints a cautious picture for the days ahead.
Global supply chain disruptions and economic uncertainty remain at the forefront of market concerns.
Disclaimer
In adherence to the Trust Project guidelines, BeInCrypto is committed to unbiased, transparent reporting. This news article aims to provide accurate, timely information. However, readers are advised to verify facts independently and consult with a professional before making any decisions based on this content. Please note that our Terms and Conditions, Privacy Policy, and Disclaimers have been updated.
Market
XRP Battle Heats Up—Can Bulls Turn the Tide?

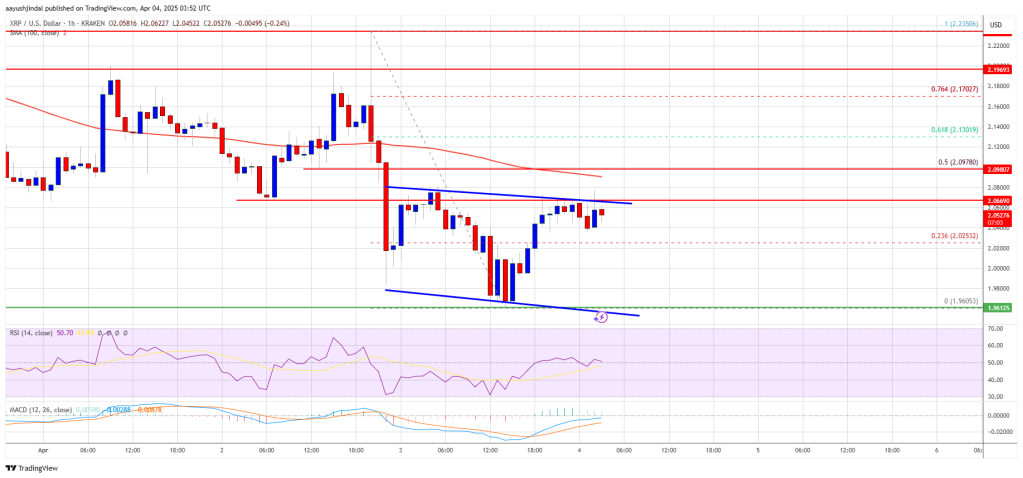
XRP price started a fresh decline below the $2.050 zone. The price is now consolidating and might face hurdles near the $2.10 level.
- XRP price started a fresh decline below the $2.120 and $2.050 levels.
- The price is now trading below $2.10 and the 100-hourly Simple Moving Average.
- There is a short-term declining channel forming with resistance at $2.0680 on the hourly chart of the XRP/USD pair (data source from Kraken).
- The pair might extend losses if it fails to clear the $2.10 resistance zone.
XRP Price Attempts Recovery
XRP price extended losses below the $2.050 support level, like Bitcoin and Ethereum. The price declined below the $2.00 and $1.980 support levels. A low was formed at $1.960 and the price is attempting a recovery wave.
There was a move above the $2.00 and $2.020 levels. The price surpassed the 23.6% Fib retracement level of the downward move from the $2.235 swing high to the $1.960 low. However, the bears are active below the $2.10 resistance zone.
The price is now trading below $2.10 and the 100-hourly Simple Moving Average. On the upside, the price might face resistance near the $2.070 level. There is also a short-term declining channel forming with resistance at $2.0680 on the hourly chart of the XRP/USD pair.
The first major resistance is near the $2.10 level. It is near the 50% Fib retracement level of the downward move from the $2.235 swing high to the $1.960 low. The next resistance is $2.120.
A clear move above the $2.120 resistance might send the price toward the $2.180 resistance. Any more gains might send the price toward the $2.2350 resistance or even $2.40 in the near term. The next major hurdle for the bulls might be $2.50.
Another Decline?
If XRP fails to clear the $2.10 resistance zone, it could start another decline. Initial support on the downside is near the $2.00 level. The next major support is near the $1.960 level.
If there is a downside break and a close below the $1.960 level, the price might continue to decline toward the $1.920 support. The next major support sits near the $1.90 zone.
Technical Indicators
Hourly MACD – The MACD for XRP/USD is now losing pace in the bearish zone.
Hourly RSI (Relative Strength Index) – The RSI for XRP/USD is now above the 50 level.
Major Support Levels – $2.00 and $1.960.
Major Resistance Levels – $2.10 and $2.120.
Market
Ethereum Price Losing Ground—Is a Drop to $1,550 Inevitable?

Reason to trust

Strict editorial policy that focuses on accuracy, relevance, and impartiality
Created by industry experts and meticulously reviewed
The highest standards in reporting and publishing
Strict editorial policy that focuses on accuracy, relevance, and impartiality
Morbi pretium leo et nisl aliquam mollis. Quisque arcu lorem, ultricies quis pellentesque nec, ullamcorper eu odio.
Ethereum price attempted a recovery wave above the $1,820 level but failed. ETH is now consolidating losses and might face resistance near the $1,840 zone.
- Ethereum failed to stay above the $1,850 and $1,840 levels.
- The price is trading below $1,840 and the 100-hourly Simple Moving Average.
- There is a short-term bearish trend line forming with resistance at $1,810 on the hourly chart of ETH/USD (data feed via Kraken).
- The pair must clear the $1,820 and $1,840 resistance levels to start a decent increase.
Ethereum Price Dips Further
Ethereum price failed to stay above the $1,800 support zone and extended losses, like Bitcoin. ETH traded as low as $1,751 and recently corrected some gains. There was a move above the $1,780 and $1,800 resistance levels.
The bulls even pushed the price above the 23.6% Fib retracement level of the downward move from the $1,955 swing high to the $1,751 low. However, the bears are active near the $1,820 zone. The price is now consolidating and facing many hurdles.
Ethereum price is now trading below $1,820 and the 100-hourly Simple Moving Average. On the upside, the price seems to be facing hurdles near the $1,810 level. There is also a short-term bearish trend line forming with resistance at $1,810 on the hourly chart of ETH/USD.
The next key resistance is near the $1,840 level or the 50% Fib retracement level of the downward move from the $1,955 swing high to the $1,751 low at $1,850. The first major resistance is near the $1,880 level.
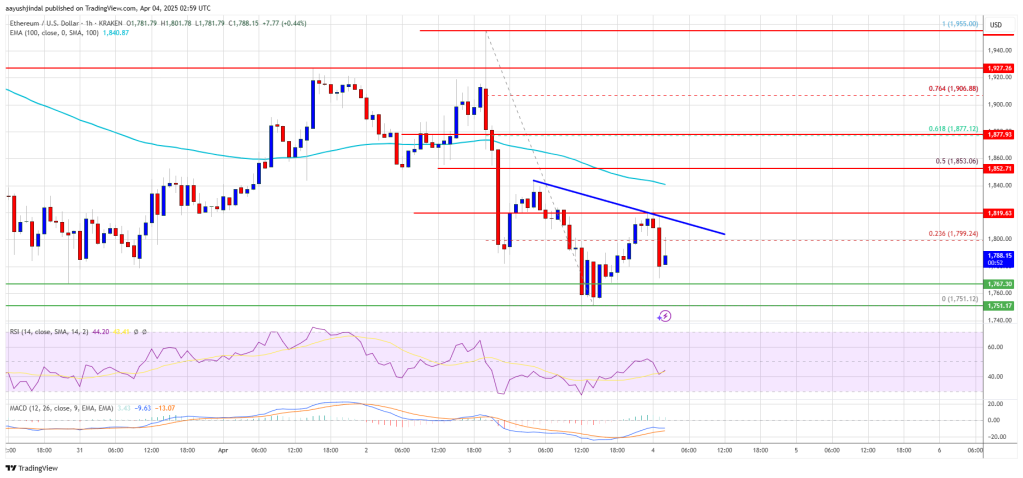
A clear move above the $1,880 resistance might send the price toward the $1,920 resistance. An upside break above the $1,920 resistance might call for more gains in the coming sessions. In the stated case, Ether could rise toward the $2,000 resistance zone or even $2,050 in the near term.
Another Decline In ETH?
If Ethereum fails to clear the $1,850 resistance, it could start another decline. Initial support on the downside is near the $1,765 level. The first major support sits near the $1,750 zone.
A clear move below the $1,750 support might push the price toward the $1,720 support. Any more losses might send the price toward the $1,680 support level in the near term. The next key support sits at $1,620.
Technical Indicators
Hourly MACD – The MACD for ETH/USD is gaining momentum in the bearish zone.
Hourly RSI – The RSI for ETH/USD is now below the 50 zone.
Major Support Level – $1,750
Major Resistance Level – $1,850
-

 Market21 hours ago
IP Token Price Surges, but Weak Demand Hints at Reversal
-

 Altcoin22 hours ago
Binance Issues Key Announcement On StakeStone TGE; Here’s All
-

 Altcoin21 hours ago
Movimiento millonario de Solana, SOLX es la mejor opción
-

 Ethereum21 hours ago
Ethereum Trading In ‘No Man’s Land’, Breakout A ‘Matter Of Time’?
-

 Bitcoin20 hours ago
BlackRock Approved by FCA to Operate as UK Crypto Asset Firm
-

 Bitcoin23 hours ago
US Dollar Index Drops – What Does It Mean for Bitcoin?
-

 Market20 hours ago
HBAR Foundation Eyes TikTok, Price Rally To $0.20 Possible
-

 Altcoin20 hours ago
John Squire Says XRP Could Spark A Wave of Early Retirements


