Market
DOT Experiences 25% Price Drop in June Amid Bearish Pressure

Polkadot faces bearish pressure as it struggles to maintain critical support levels, signaling potential further declines in its price action.
The goal of the analysis is to assess Polkadot’s bearish selling pressure, using Key Support and Resistance Levels, Market Sentiment, and Future Price Movements.
Polkadot Faces Bearish Pressure: Key Levels and Market Sentiment Analysis
Polkadot (DOT) has been experiencing a bearish trend, evident from the recent price action where it fell below critical support levels. The rejection from the Ichimoku Cloud and testing of lower support levels further emphasize this downtrend.
Following Bitcoin’s price drop to $64,700 yesterday, the price of DOT reached the important support level of $5.46. Subsequently, the price of DOT bounced upward, stabilizing around $5.80, as observed in the 4-hour chart.
DOT’s price has dropped 25% from its local high recorded on June 7
Read More: 5 Best Polkadot (DOT) Wallets To Consider In 2024

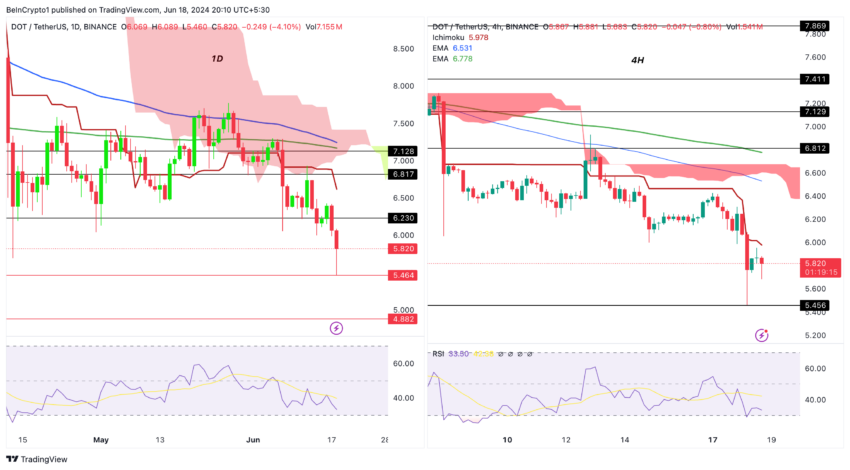
Currently, Polkadot faces several key support and resistance levels. Following our insights shared on BeInCrypto analysis, the DOT price managed to break below the $6.23 price level yesterday. This prompted the price to drop 12% in 2 days, underscoring and highlighting the importance of monitoring this price level. This price level should now act as a resistance level for DOT.
The Ichimoku Cloud analysis shows that the price action is clearly rejected from the cloud, indicating bearish sentiment. On the daily chart, the price is currently below the Ichimoku Cloud, suggesting strong bearish momentum. The baseline and conversion lines are trending downwards, which confirms the bearish outlook.
Similarly, on the 4-hour chart, the price is below the cloud, reinforcing the short-term bearish sentiment.
A breakdown below the current support at $5.46 could lead to further declines towards the next major support at $4.88. On the upside, the first major resistance to watch is $6.81. Reclaiming this level could indicate a potential reversal of the current downtrend.
To confirm a bullish reversal, higher resistance levels at $7.12 and $7.41 will also need to be broken through.
The moving averages also support the bearish outlook. The price is trading well below the 200 EMA, indicating a long-term bearish trend, and the 100 EMA is also above the current price, acting as a resistance level.
The Relative Strength Index (RSI) is trending towards the oversold territory, currently hovering around 30. This indicates increasing selling pressure. If the RSI drops below 30, it could signal potential further declines. Conversely, if it bounces off this level, it could indicate a short-term relief rally.
OI-Weighted Funding Rate Reflects Cautious Market Sentiment
Open Interest (OI) is the total number of outstanding derivative contracts, such as futures or options, yet to be settled. Higher OI indicates increased market participation and speculative activity, while lower OI suggests reduced trader engagement.
The funding rate is the periodic payment between traders holding long and short positions in perpetual futures contracts. Positive rates mean long positions pay shorts, indicating bullish sentiment, while negative rates mean shorts pay longs, indicating bearish sentiment.
The OI-weighted funding rate combines the funding rate with open interest, offering a detailed view of market sentiment. It shows whether sentiment is driven by many participants or just a few, helping to gauge the strength of market trends.
During June, the funding rate remained relatively stable and positive, indicating a bullish sentiment among traders. This period coincided with DOT’s price stability around the $7 mark. However, the market sentiment shifted around June 8 when the funding rate briefly turned negative, suggesting increased short positions or a reduction in long positions.
From June 9 to June 15, the funding rate returned to positive territory, though with some fluctuations, reflecting a mixed but generally bullish sentiment. Notably, during this time, DOT’s price faced resistance around $7, experiencing multiple rejections. This suggests that while traders were willing to maintain long positions, the price struggled to break through this key resistance level, indicating potential exhaustion among buyers.
Read More: Polkadot (DOT) Price Prediction 2024/2025/2030
The most significant change occurred between June 16 and June 17, when both the funding rate and DOT’s price experienced sharp declines. The funding rate turning negative again reflects a bearish pressure, aligning with Polkadot dropping from around $6.50 to approximately $5.4. This period of heightened volatility and increased trading volume suggests panic selling or intensified shorting, reinforcing the bearish outlook.

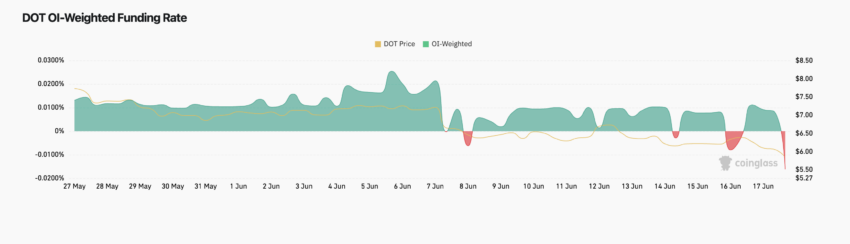
Overall, the analysis of the OI-weighted funding rate indicates that traders are becoming more cautious, anticipating further declines. The reduced speculative activity, as evidenced by the decreasing funding rate, points to a market sentiment that is hesitant to take long positions at current levels.
Monitoring this indicator alongside key support and resistance levels can provide crucial insights for future price movements and market sentiment.
Strategic Recommendations
If Polkadot’s price continues to fall below the $5.45 level, it could trigger a significant cascade of liquidations and bearish selling pressure, potentially driving the price down to $4.88. The fact that Bitcoin remains above the $65,000 level suggests it is experiencing only a minor correction.
However, if Bitcoin’s price continues to decline and reaches $60,000, this could be very bearish for Polkadot and incentivize further price drops below $4.88.
A reversion back to $67,000 for Bitcoin could positively impact Polkadot, potentially driving its price back up to $6.23. If this level is broken, it could signal a possible reversal, allowing for further upward movement.
Disclaimer
In line with the Trust Project guidelines, this price analysis article is for informational purposes only and should not be considered financial or investment advice. BeInCrypto is committed to accurate, unbiased reporting, but market conditions are subject to change without notice. Always conduct your own research and consult with a professional before making any financial decisions. Please note that our Terms and Conditions, Privacy Policy, and Disclaimers have been updated.